. 2021 Nov 8;39(11):1531-1547.e10.
doi: 10.1016/j.ccell.2021.09.003. Epub 2021 Oct 7.

Three subtypes of lung cancer fibroblasts define distinct therapeutic paradigms

Affiliations

Three subtypes of lung cancer fibroblasts define distinct therapeutic paradigms

Haichuan Hu et al. Cancer Cell. .

Abstract

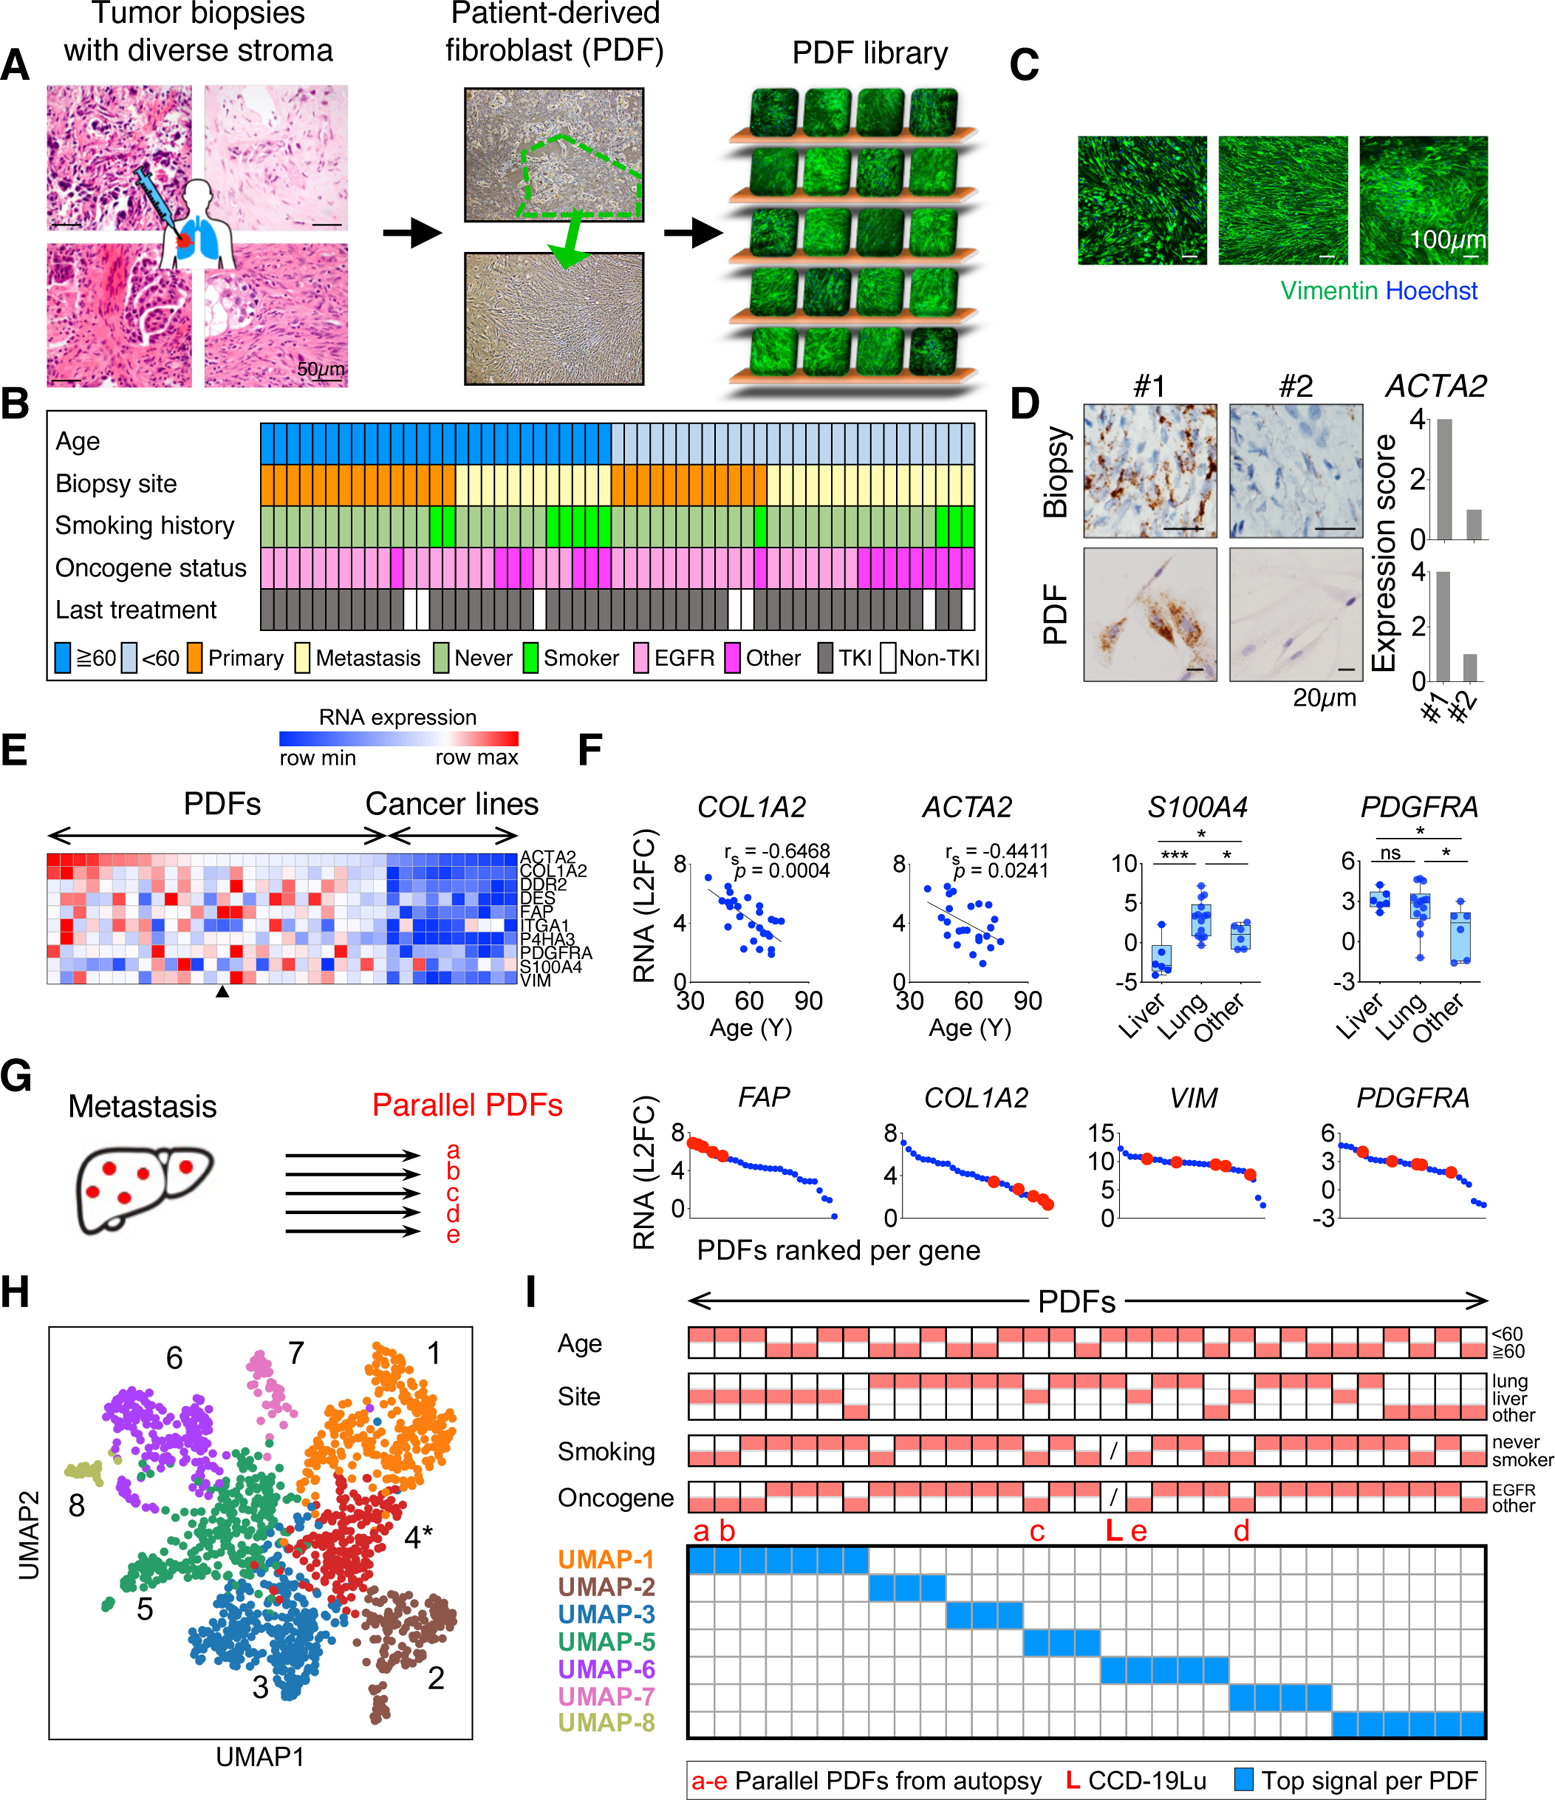
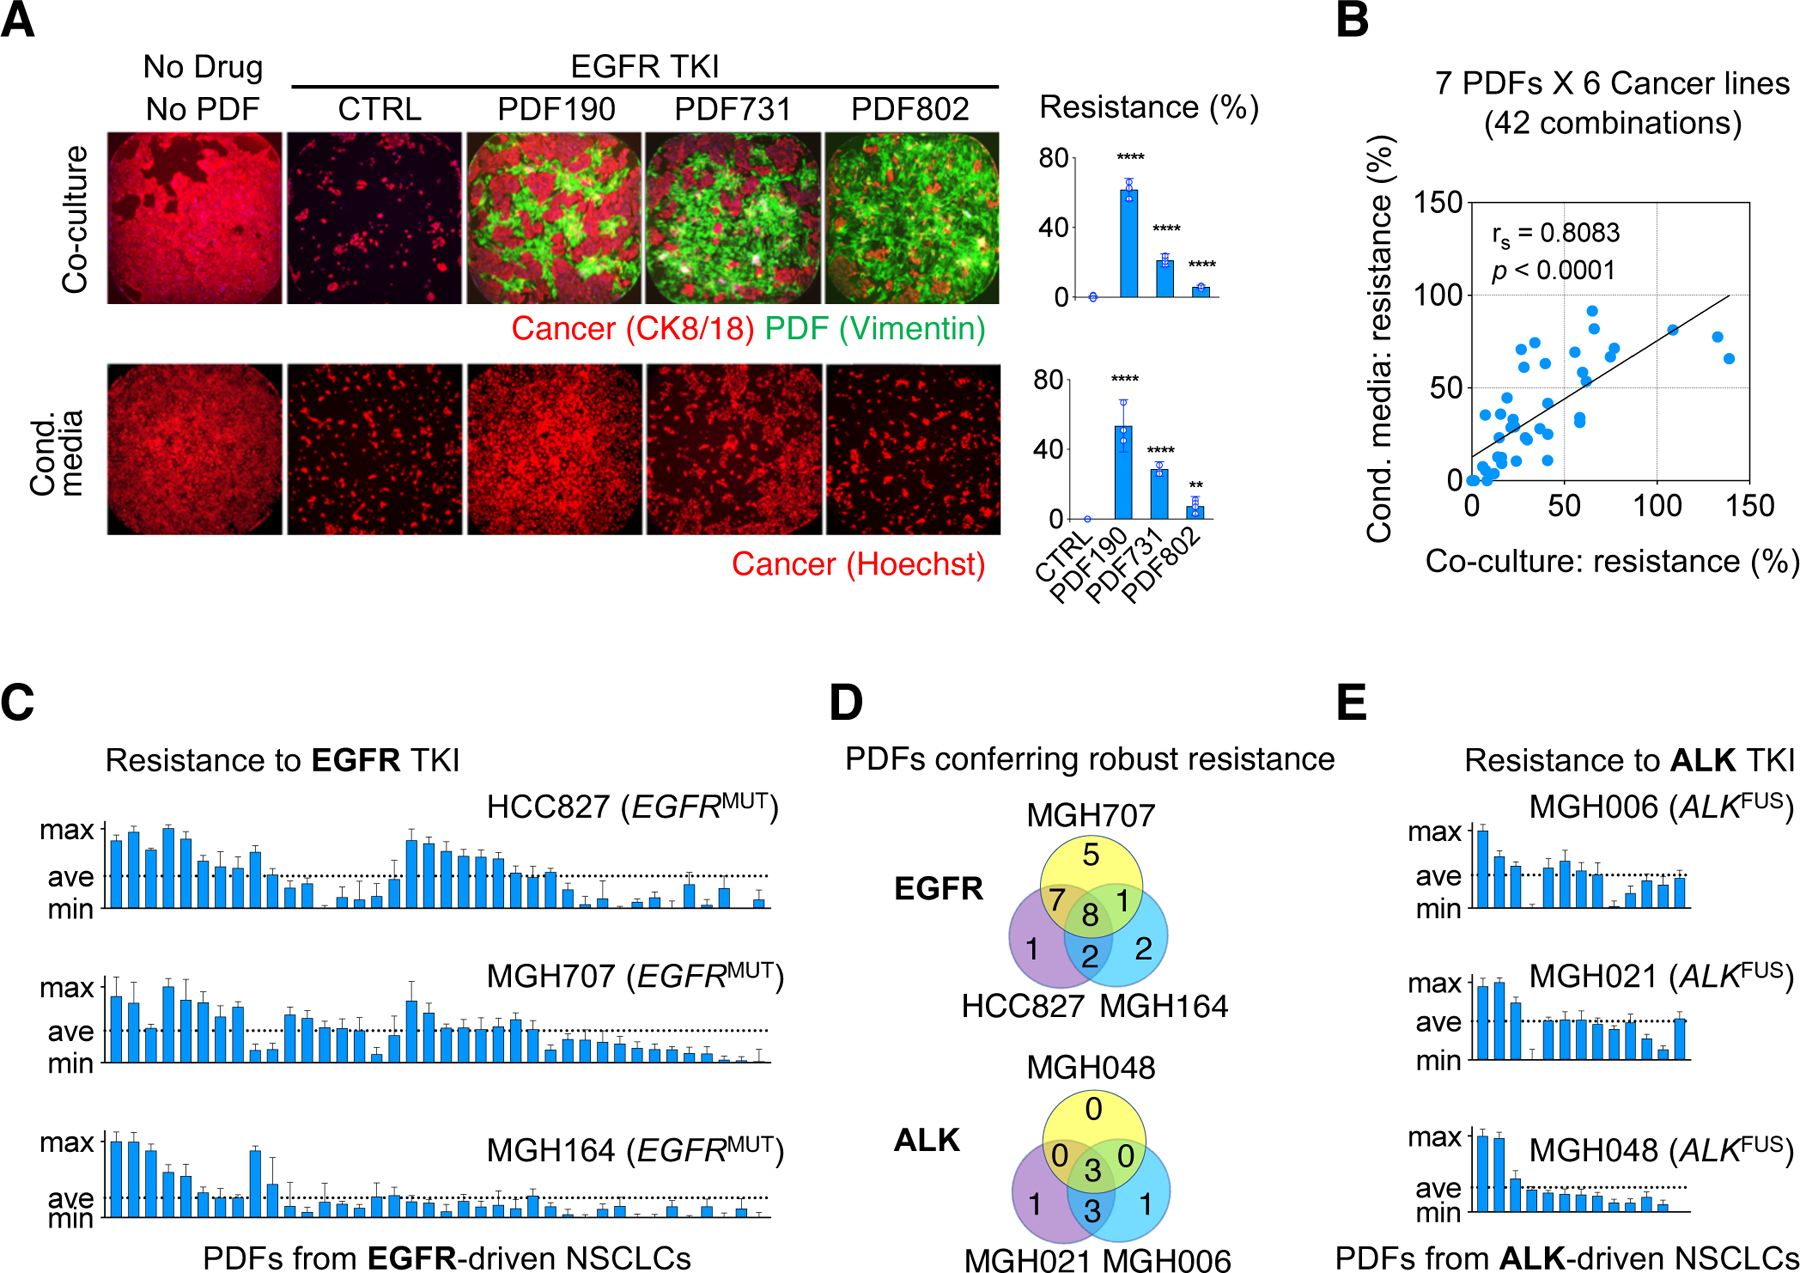
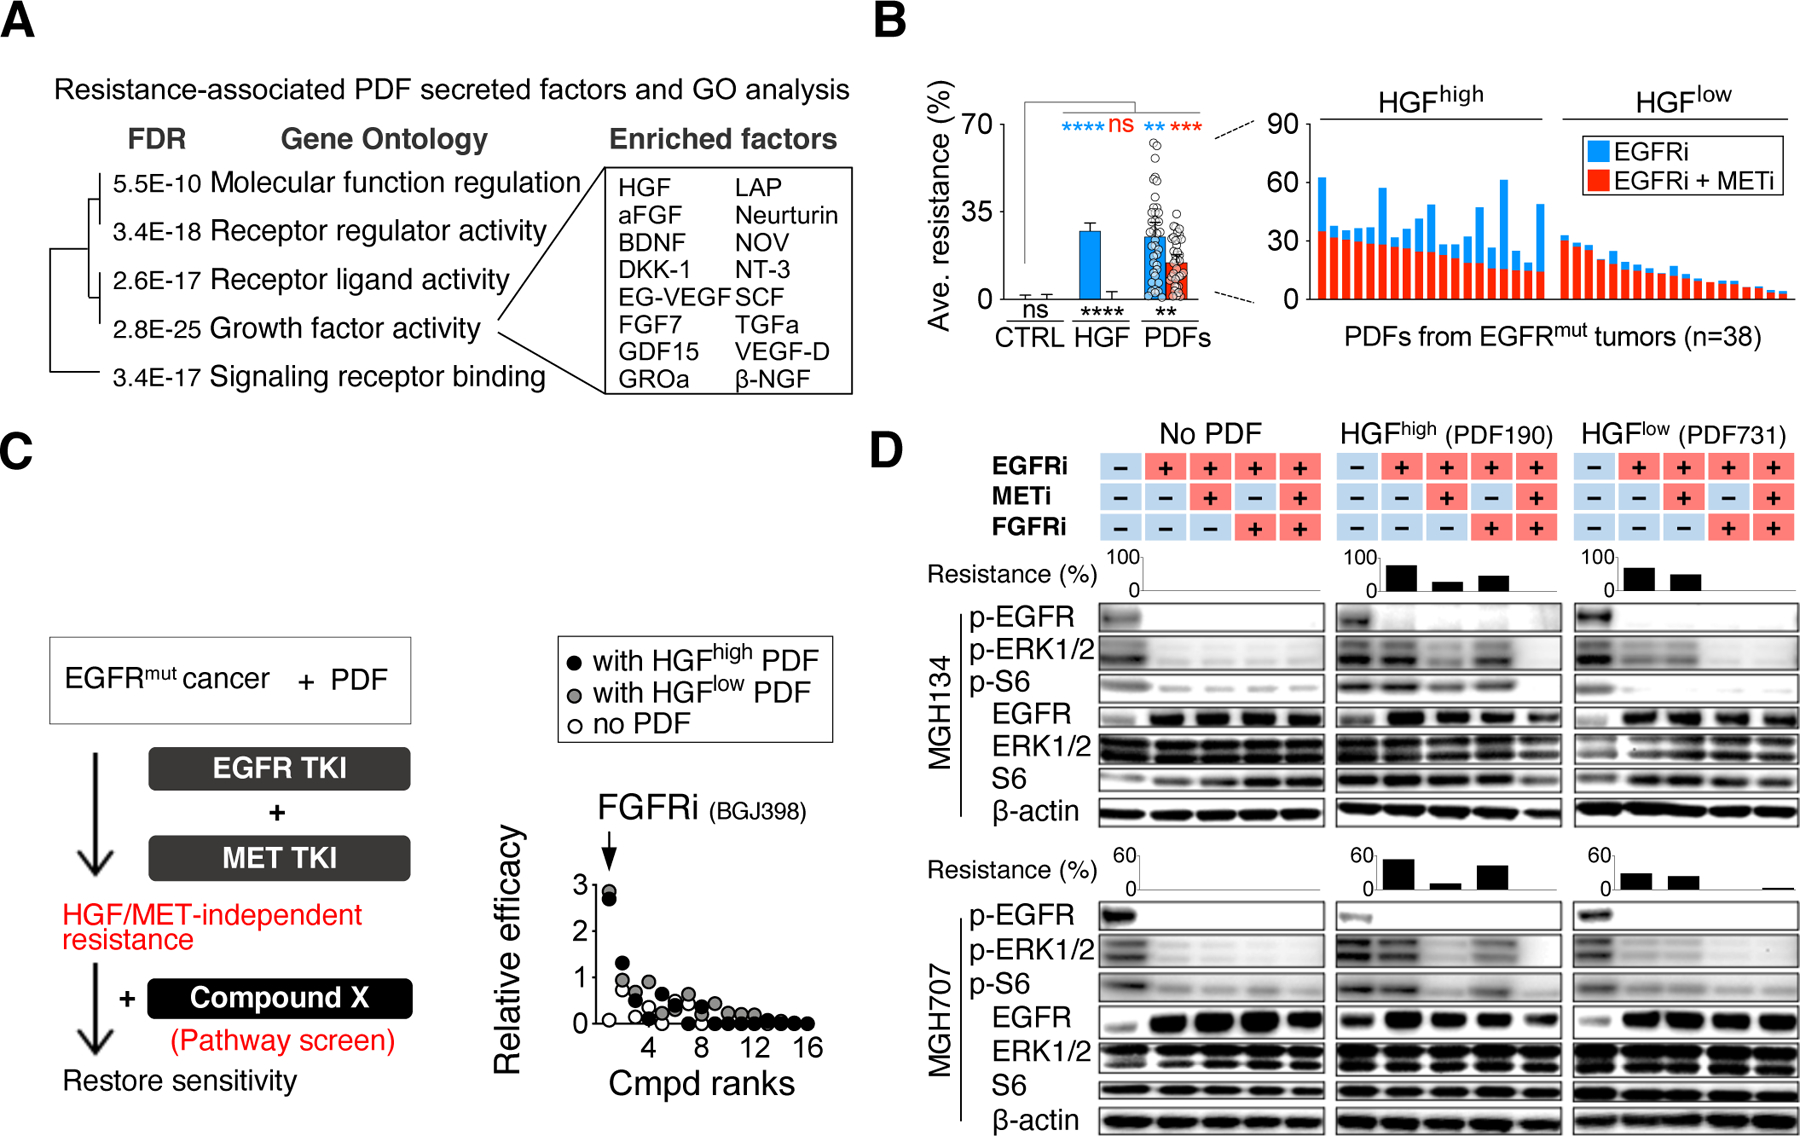
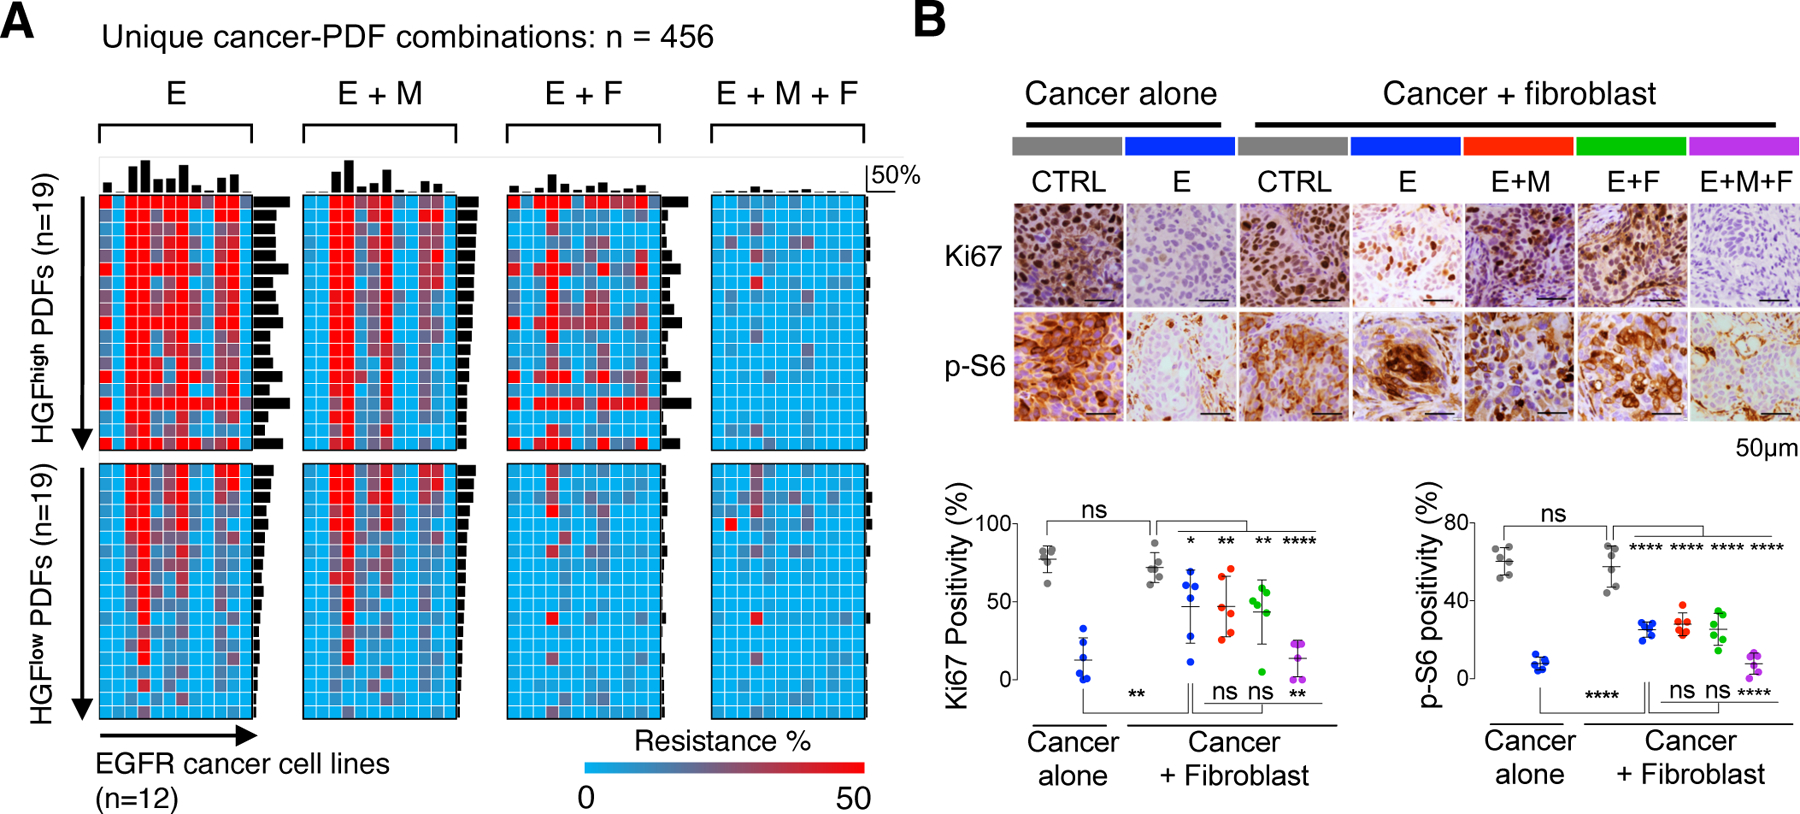
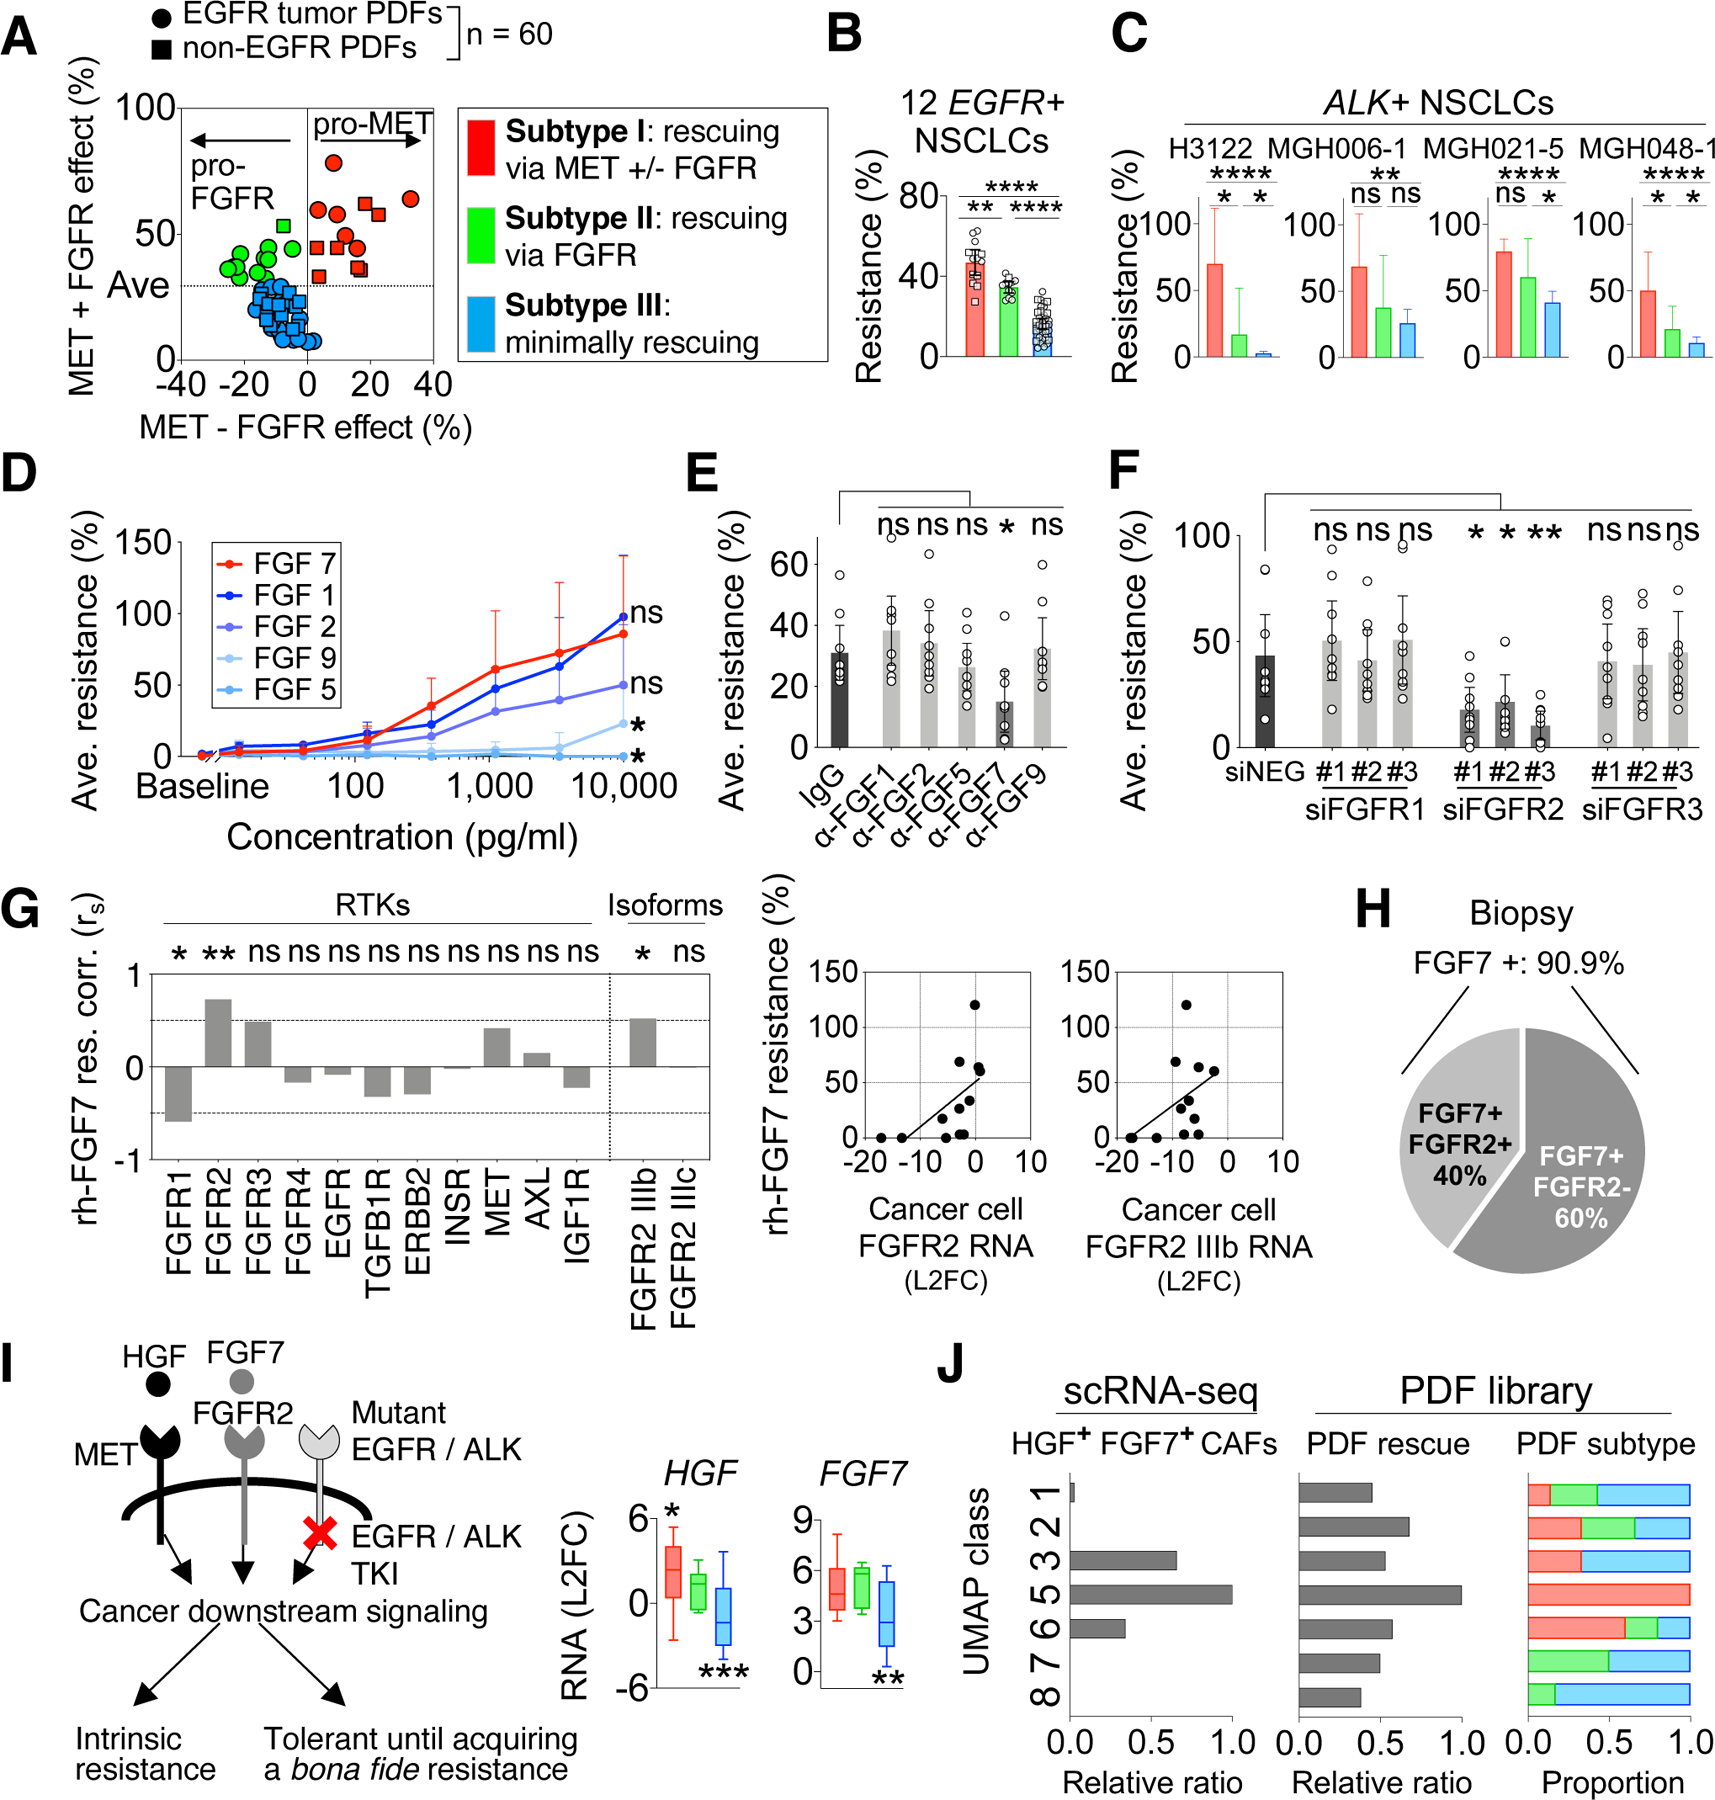
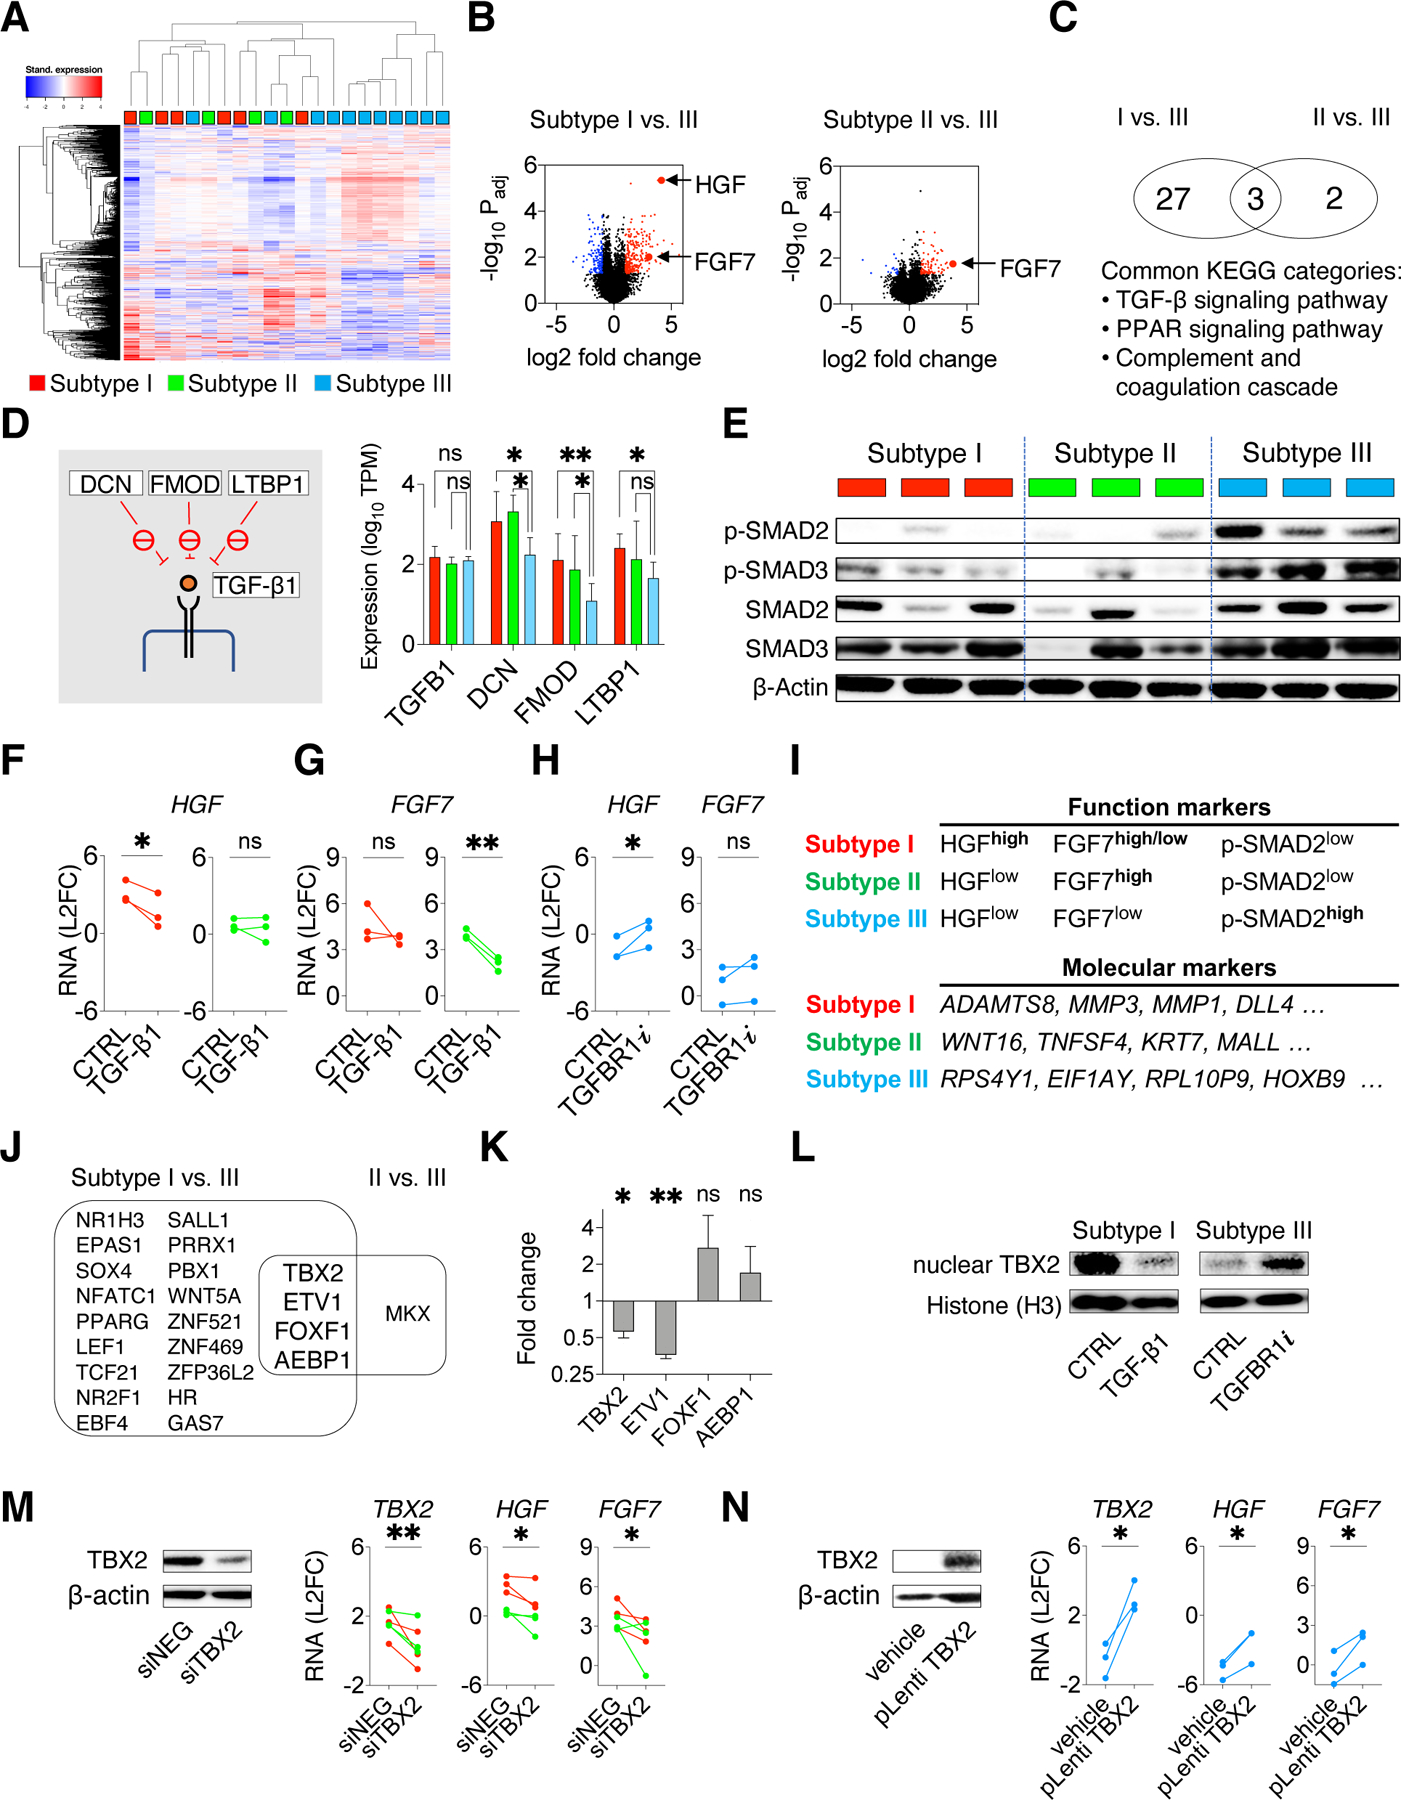
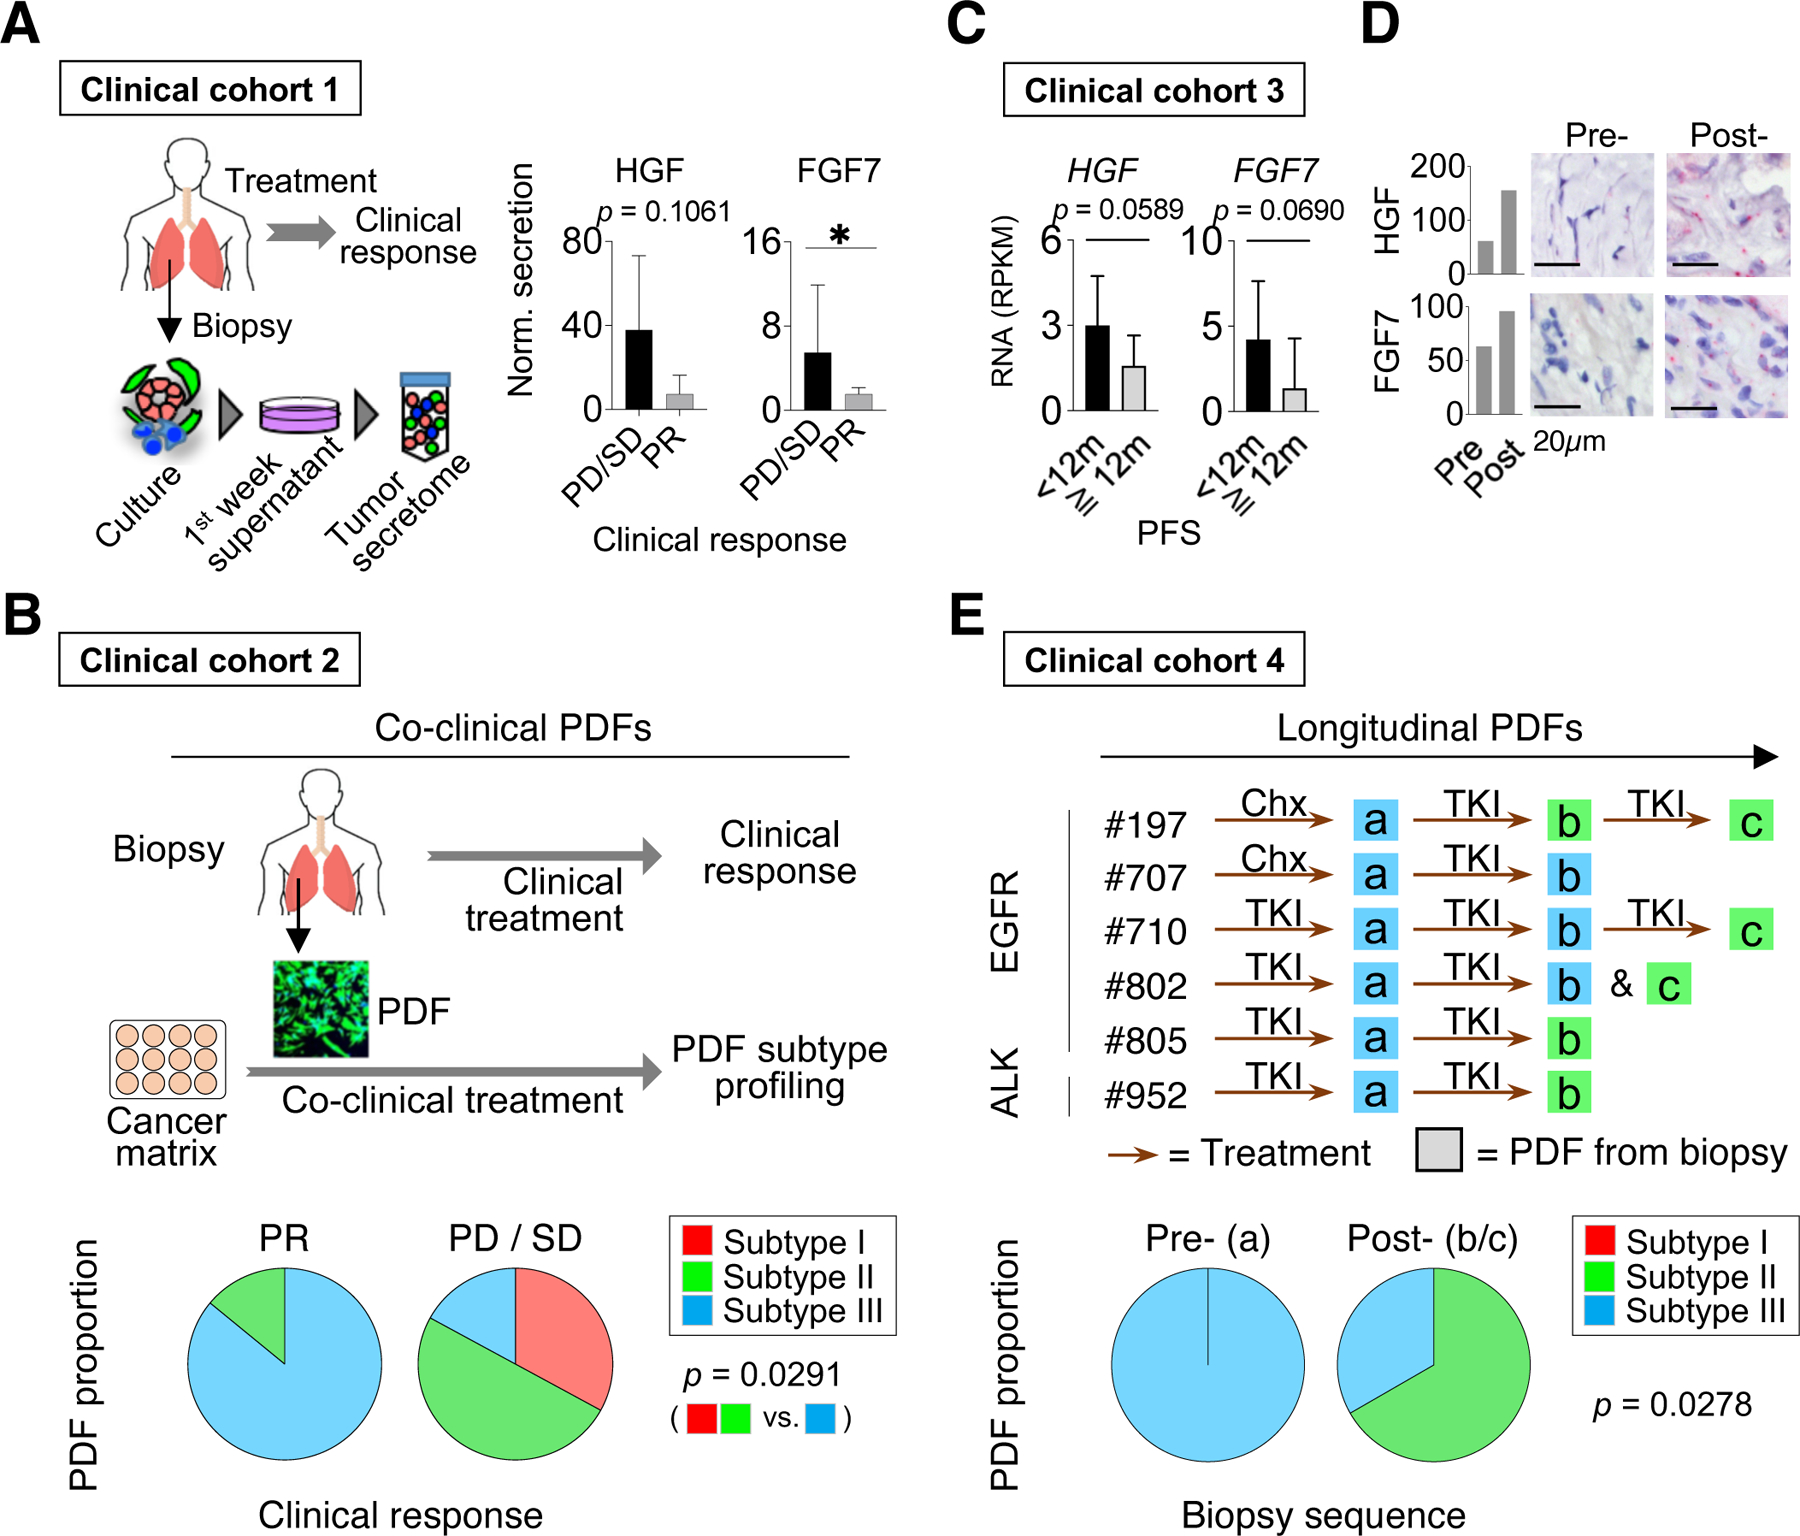
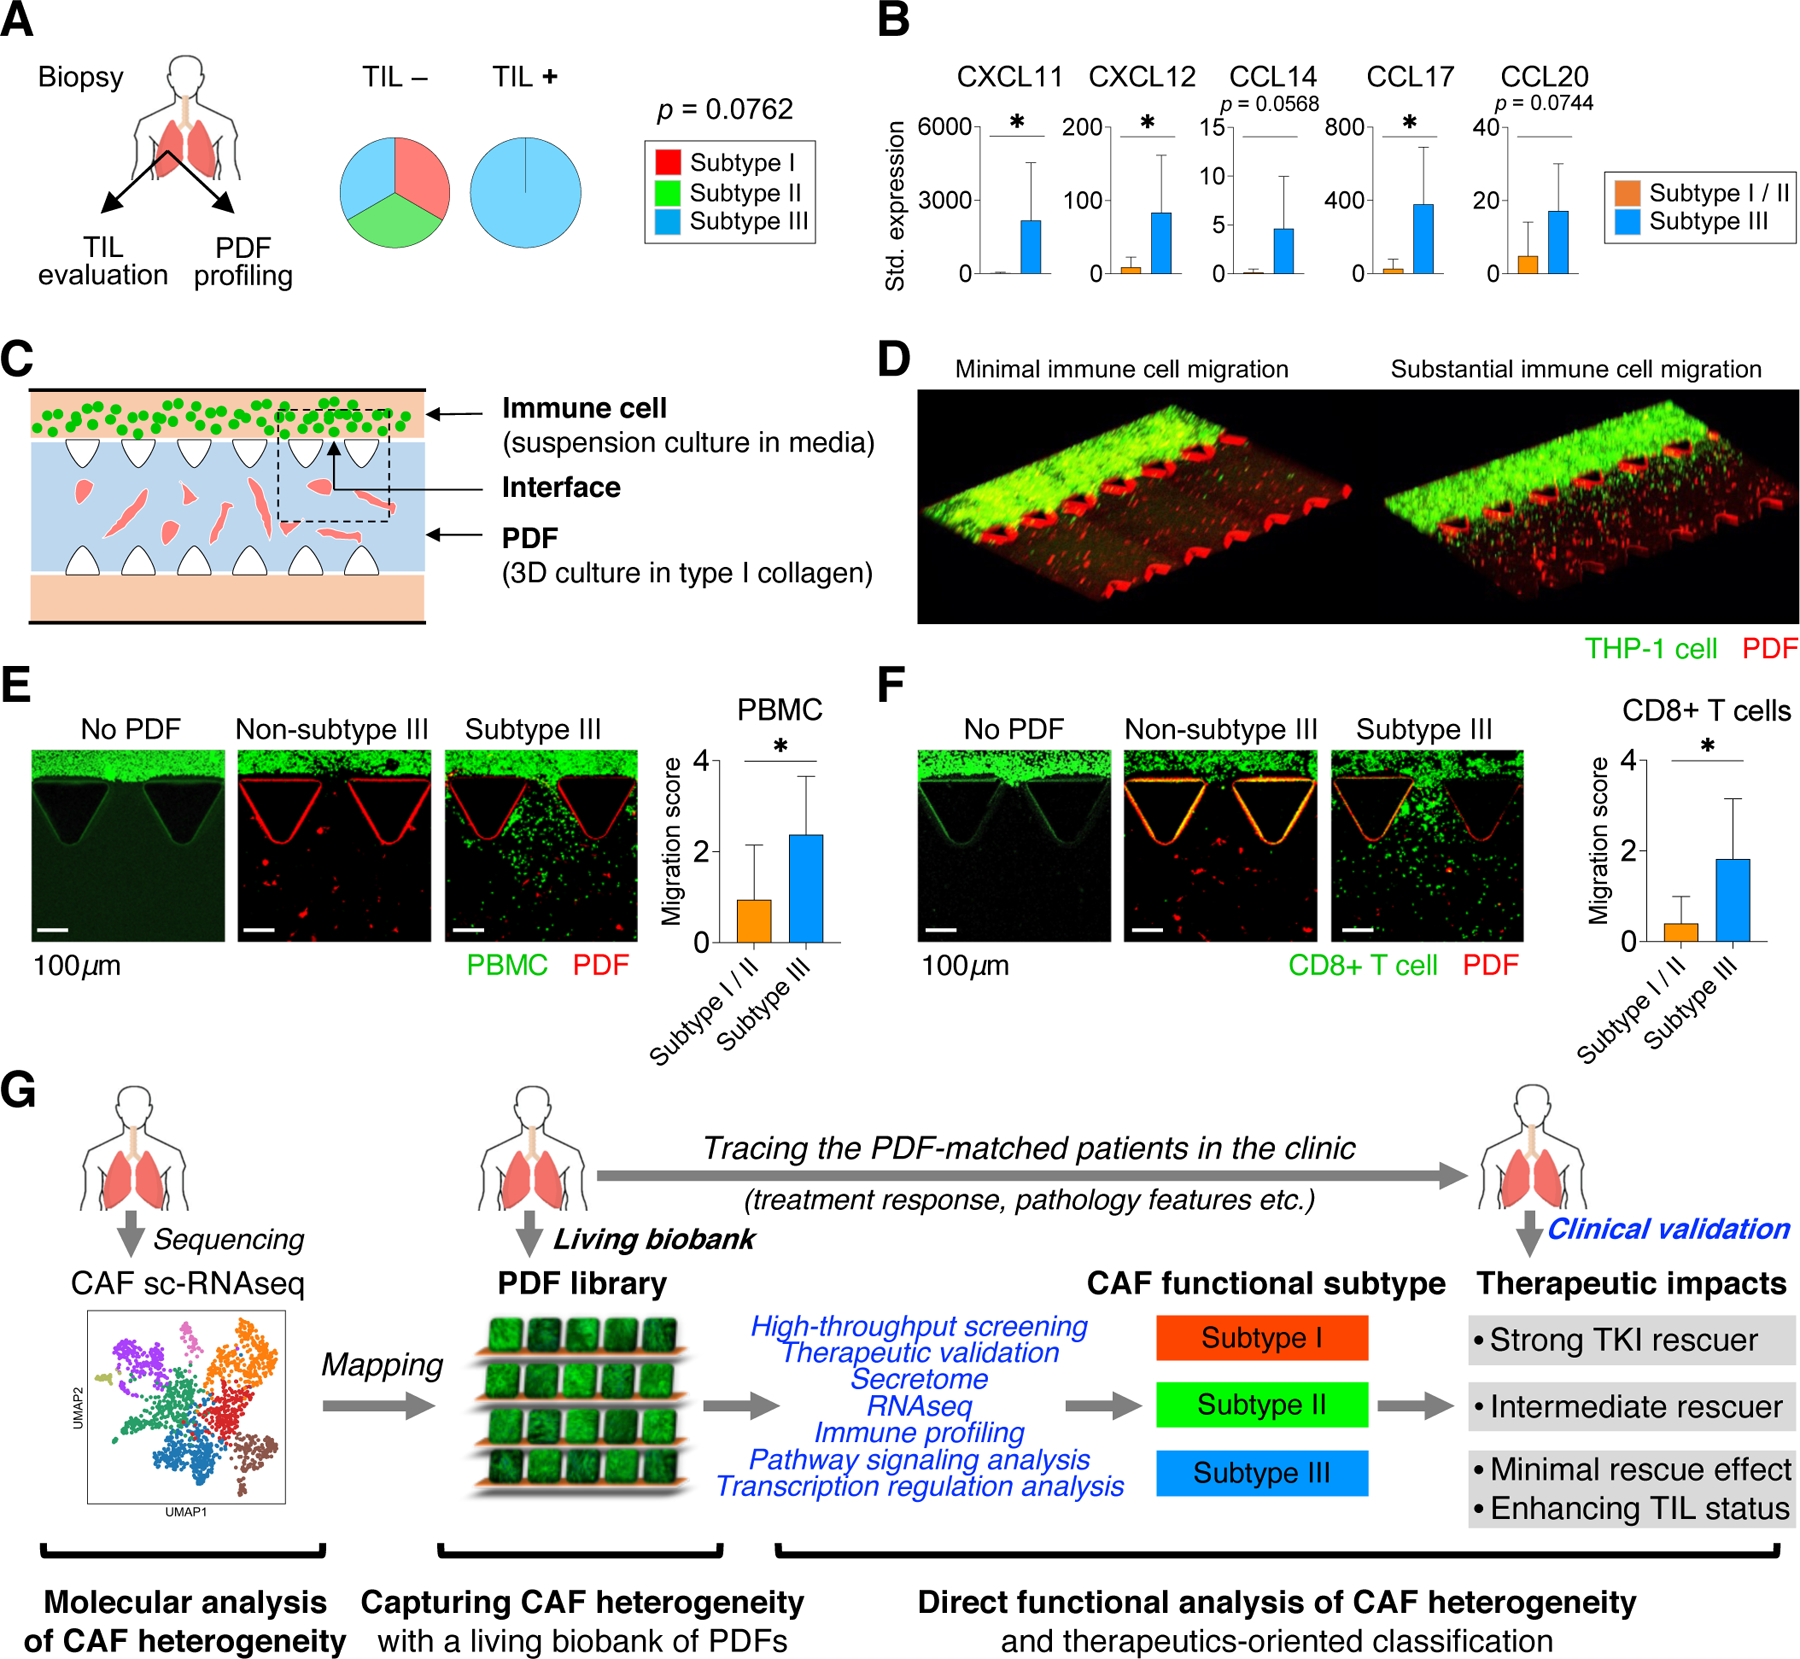
Cancer-associated fibroblasts (CAFs) are highly heterogeneous. With the lack of a comprehensive understanding of CAFs' functional distinctions, it remains unclear how cancer treatments could be personalized based on CAFs in a patient's tumor. We have established a living biobank of CAFs derived from biopsies of patients' non-small lung cancer (NSCLC) that encompasses a broad molecular spectrum of CAFs in clinical NSCLC. By functionally interrogating CAF heterogeneity using the same therapeutics received by patients, we identify three functional subtypes: (1) robustly protective of cancers and highly expressing HGF and FGF7; (2) moderately protective of cancers and highly expressing FGF7; and (3) those providing minimal protection. These functional differences among CAFs are governed by their intrinsic TGF-β signaling, which suppresses HGF and FGF7 expression. This CAF functional classification correlates with patients' clinical response to targeted therapies and also associates with the tumor immune microenvironment, therefore providing an avenue to guide personalized treatment.

Keywords: cancer therapy; cancer-associated fibroblasts; lung cancer; patient-derived models; personalized medicine; resistance; targeted therapy; tumor heterogeneity; tumor microenvironment; tumor-infiltrating lymphocytes.


Conflict of interest statement

Declaration of interests Z.P. receives commercial research support from Novartis, Tesaro, Spectrum, AstraZeneca, and Takeda; and serves as a consultant/advisory board member for AstraZeneca, Takeda, Novartis, ImmunoGen, Guardant Health, and Spectrum. L.V.S. serves as a compensated consultant or received honoraria from AstraZeneca, Janssen, Merrimack, and Genentech; and receives institutional research funding from AstraZeneca, Boehringer Ingelheim, Novartis, Genentech, Merrimack, Blueprint Medicines, and LOXO. C.H.B.’s laboratory received support for research from Novartis, Amgen, and Araxes. A.T.S. is an employee of Novartis and a paid consultant for Pfizer, Genentech/Roche, Ariad/Takeda, Syros, Blueprint Medicine, KSQ Therapeutics, TP Therapeutics, Chugai, Daiichi-Sankyo, LOXO/Bayer, Achilles, Archer, Foundation Medicine, and Guardant. M.M.-K. serves as a consultant for Merrimack Pharmaceuticals and H3 Biomedicine. A.N.H. receives commercial research grants from Amgen, Novartis, Relay Therapeutics, Pfizer, and Roche/Genentech. R.S.H. receives consulting honoraria from Boehringer Ingelheim, Tarveda, and Apollomics; and receives institutional research funding from Daichii Sankyo, Agios, Novartis, Corvus, Mirati, Genentech Roche, Incyte, Abbvie, Celgene, and Exelixis. L.P. has financial interests in Edilytics. L.P.’s interests were reviewed and are managed by Massachusetts General Hospital and Partners Health Care in accordance with their conflict-of-interest policies. J.J.W., Y.-Q.M., and R.-P.H. are employees of RayBiotech Inc. M.J.N. is a Novartis employee and equity holder. D.P.K., C.H.B., and J.A.E. are Novartis employees (contribution at Massachusetts General Hospital). The other authors declare no competing interests.

Figures

Figure 1:
Figure 1:. Establishment of a living biobank adequately capturing NSCLC CAFs heterogeneity
A. Workflow of patient-derived fibroblast (PDF) development. PDF library is symbolized with different PDFs (staining of Vimentin) on the shelf. B. Clinical features of patients whose tumors were used for developing PDFs. C. Images from immunofluorescence staining of Vimentin and Hoechst of representative PDFs. D. Images and quantification of αSMA (encoded by ACTA2) mRNA in two EGFR+ lung cancer samples and their corresponding PDFs detected by using RNAscope. E. mRNA levels of canonical CAF markers in PDFs and in lung cancer cell lines measured by qRT-PCR. The arrowhead indicates the average expression level of the five PDFs in (G). F. Correlations between the mRNA level of COL1A2 or ACTA2 and patients’ age at the time of biopsy across PDFs (left two graphs) and the mRNA level of S100A4 or PDGFRA according to the site of tumor biopsy. * p < 0.05, *** p < 0.001, Spearman’s r and two-tailed t-test are used. G. Expression of indicated CAF markers (red) in PDFs established from liver metastases in an autopsy case. H. Uniform Manifold Approximation and Projection (UMAP) analysis of 1,465 single fibroblasts in NSCLC (from Lambrechts et al., 2018) showing seven molecular classes, excluding UMAP-4 (*) due to poor quality cells. I. PDFs are mapped based on their top UMAP signal. Red blocks on the top indicate clinical features of the corresponding PDFs. See also Figures S1-S3 and Table S1.
Figure 2:
Figure 2:. CAFs determine the TKI treatment efficacy on NSCLC
A. Representative images and quantification of rescue % of MGH707 NSCLC cells co-cultured with indicated PDFs (top) or PDF conditioned media (bottom).Resistance%=[(NdrugwithPDFNdrugnoPDF)/(NnodrugnoPDFNdrugnoPDF)×100%.B. The viability outcome of cancer cells (n=6) evaluated in the presence of EGFRi and either a PDF co-culture (n=7) or a PDF conditioned media. Rescue obtained in the two settings are plotted against each other. C. Viability rescuing effect against EGFRi across three EGFR+ NSCLC cell lines by conditioned media from PDFs derived from 38 EGFR+ NSCLC. Each bar corresponds to a PDF’s effect tested in four replicates, mean values and 95% CI are plotted. D. Venn diagram showing PDFs conferring robust resistance (above average level per cancer model) in EGFR+ (C) and ALK+ (E) tumor-derived PDFs. E. Viability rescuing effect against ALKi across different ALK+ NSCLC cell lines by conditioned media from PDFs derived from 13 ALK+ NSCLC. Results shown as in (C).
Figure 3:
Figure 3:. NSCLC CAFs recurrently rescue EGFR cancers via bypass signaling
A. PDF-secreted factors profiled by a 448-analyte multiplexed ELISA, and the gene ontology of the top 30 PDF rescue correlates (ranked by Spearman’s r). B. Effects of METi on diminishing rhHGF-driven (10ng/ml) and PDF conditioned media-driven EGFRi resistance. PDFs’ rescue against EGFRi + METi treatment (red bars) is superimposed over PDFs’ rescue against EGFRi (blue bars). Effect of each PDF conditioned medium (dots on the left and bars on the right) is tested across 12 EGFR+ cancer cells. HGFhigh and HGFlow indicate PDF conditioned media with HGF level above and below the median value, respectively. Mean with 95% CI. ns, not significant; **, p < 0.01, ***, p < 0.001, ****, p < 0.0001, two-tailed t test. C. A screening across 16 compounds to identify pathway-specific inhibitors that can negate HGF/MET-independent resistance. Relative efficacy is measured by comparing cancer cells’ response to the indicated compound alone and their response to the compound in the presence of dual EGFR and MET inhibition (IC50 shift). Two cancer models (MGH134 and MGH707, average is shown) are used and are tested both in the absence and presence of conditioned media from two different PDFs (HGFhigh and HGFlow). D. Western blotting in two cancer cell lines showing rescue of ERK and S6 phosphorylation by PDFs and the effect of the addition of FGFRi and METi on cancer cell signaling. Bars correspond to the matched resistance effect in the presence of the indicated inhibitors. See also Figures S4-S5 and Table S2-S3.
Figure 4:
Figure 4:. HGF-MET and FGF-FGFR are two mainstream CAF-cancer crosstalk contributing to resistance
A. A set of 38 PDFs (all derived from EGFR+ NSCLC) conditioned media was tested across 12 EGFR+ cancer cell lines in the presence of EGFRi (E) alone or EGFRi in combination with METi (M), FGFRi (F) or both. Top bars are average resistance level of a given cancer cell line tested across all PDFs, and side bars are average rescue effect of a given PDF tested across all cancer lines. B. Nude mice implanted with MGH707 cancer cells alone or together with CCD19-Lu fibroblasts were treated as indicated 10 days after injection for 3 days. Given the extra tumor volume due to fibroblasts, Ki67 and phospho-S6 IHC staining in cancer cells, instead of the tumor size, were measured. Six xenograft tumors were quantified in each treatment group. * p < 0.05, ** p < 0.01, **** p < 0.0001, two-tailed t test. See also Figures S5.
Figure 5:
Figure 5:. Expression of HGF and FGF7 define three subtypes of CAFs marked with distinct therapeutic strategies
A. Sixty PDFs (dots) are classified according to their rescue effect mediated by MET and FGFR: MET-predominant rescue (red), FGFR-predominant rescue (green), and minimum rescue (blue). “MET – FGFR effect” (x-axis) is calculated by MET effect (resistance to EGFRi+FGFRi) minus FGFR effect (resistance to EGFRi+METi). “MET+FGFR effect” (y-axis) is calculated by MET effect plus FGFR effect. B. The overall EGFRi resistance (plain effect against EGFRi) conferred by PDFs is then plotted based on the functional subtypes defined in (A). (A-B), Effect of each PDF (dot) is tested across 12 EGFR+ NSCLC cancers. C. The rescue level of 19 PDFs on ALK+ NSCLC cell lines against ALKi. Results are shown by PDFs’ functional subtypes defined in (A). D. The average effect of indicated recombinant FGF on resistance to EGFRi across 5 cancer cell lines. E. The effect of neutralizing indicated FGF in PDF conditioned media on diminishing cancer cells’ resistance to EGFRi plus METi (HGF-independent resistance). F. The effect of knockdown FGFR1, FGFR2 and FGFR3 in cancer cells on diminishing cancer cells’ resistance to EGFRi plus METi in the presence of PDF conditioned media. (E-F), Effect of each PDFs (dots, n = 9) is tested across 5 cancer models. (B-F), Mean with 95% CI are shown. G. Correlations between cancer cells’ expression of indicated receptors and their resistance level conferred by recombinant FGF7 (10ng/mL). Two-tailed Spearman’s r is used. H. Prevalence of FGF7 and FGFR2 expression in EGFR+ NSCLC biopsies (n=11). I. Schematics showing that HGF and FGF7 mediate the bypass activation of cancer downstream signaling and resistance (left). HGF and FGF7 RNA levels are assessed in PDFs based on their functional subtypes by qRT-PCR (right). Whiskers are maximum and minimum values, two-tailed t test based on single group compared to all other PDFs. J. Comparison between CAF molecular classes defined by scRNA-seq analysis and CAF functional subtypes revealed by PDF analysis. The PDFs’ functional profiles are plotted by the UMAP classes (right). * p < 0.05, ** p < 0.01, *** p < 0.001, **** p < 0.0001, two-tailed t test. See also Figures S6.
Figure 6:
Figure 6:. Intrinsic TGF-beta signaling contributes to CAF functional heterogeneity by suppressing HGF and FGF7 expression
A. Heatmap with unsupervised clustering showing the top 1000 differentially expressed genes across a total of 21 PDFs. B. Volcano plots show the over-expressed genes (red) and under-expressed genes (blue) in subtype I or II PDFs compared with subtype III PDFs. C. Venn diagram showing pathways (KEGG annotation) related with genes over-expressed in subtypes I and II PDFs. D. RNAseq expressions of TGF-β1 and TGF-β1 upstream suppressors DCN, FMOD, and LTBP1(schematics on the left) in subtypes I (red), II (green), and III PDFs (blue). Mean with 95% CI. Two-tailed t test is used. E. Western blotting shows TGF-β signaling (phospho-SMAD2/SMAD3) in PDFs. Lysates were also probed in Figure S7B. F-G. HGF (F) and FGF7 (G) RNA expression measured by qRT-PCR in subtypes I (red) and II (green) PDFs upon activating TGF-β signaling using TGF-β1 (10ng/mL) for 24 hours. H. HGF and FGF7 RNA expression in subtype III (blue) PDFs after TGFBR1 inhibitor vactosertib (1μM) treatment for 24 hours. I. Function markers (HGF, FGF7, and phospho-SMAD2) and molecular markers (most variably expressed genes identified by PDF RNA sequencing, top four genes are shown) to distinguish CAF functional subtypes. J. Venn diagram shows transcription factor genes commonly over-expressed in subtype I and subtype II PDFs. K. RNA expression change of the indicated transcription factors genes in subtype I PDFs after treating with TGF-β1 for 24 hours. Mean with standard error are shown. L. Western blotting shows the nuclear TBX2 in a subtype I PDF upon TGF-β1 treatment and in a subtype III PDF upon TGFBR1i treatment. Histone H3 is used as a loading control. M. HGF and FGF7 expression in subtypes I (red) and II (green) PDFs upon TBX2 knockdown (siRNA pool). N. HGF and FGF7 expression in subtype III (blue) PDFs upon ectopic expression of TBX2. (M-N), knockdown and overexpression are confirmed by western blotting (left) and qRT-PCR (right),. (F-H, K, M-N), Paired one-tailed t-test is used. * p < 0.05, ** p < 0.01. See also Figures S7 and Table S4.
Figure 7:
Figure 7:. CAFs functional classification correlates with patients’ clinical outcome
A. Normalized FGF7 and HGF secretion in 12 tumor secretome samples derived from EGFR+ NSCLC biopsies before the covalent EGFR TKI (osimertinib or equivalent) treatment. Results are compared based on patients’ clinical response, progressive disease (PD)/stable disease (SD) vs. partial response (PR). Average with 95% CI are shown, one-tailed Mann-Whitney U test. B. The functional subtypes of PDFs established from 13 NSCLC patients before receiving a covalent EGFR TKI treatment (osimertinib or equivalent) are plotted against patients’ response to their treatment. C. RNAseq data of pre-osimertinib biopsies from 11 EGFR+ NSCLC patients (from Roper et al., 2020). The HGF and FGF7 RNA levels are shown based on patients’ progression-free survival (PFS) on the treatment. Average and 95% CI are shown, one-tailed t-test. D. RNA expression of HGF and FGF7 are stained by RNAscope in pre- and post-treatment biopsy samples from two patients. E. The functional heterogeneity in a collection of PDFs established from longitudinal biopsies from same patients. PDFs are colored by functional subtypes. Bottom: the proportion of PDF subtypes according to early (a) and later biopsies (b/c). (B and E), two-tailed Fisher’s exact test is used. See also Figures S7 and Table S5.
Figure 8:
Figure 8:. Subtype III CAFs are chemoattractant to immune cells
A. The status of tumor-infiltrating lymphocytes, based on CD8 staining, in EGFR+ NSCLC (n=10) according to functional subtypes of PDFs. Two-tailed Fisher’s exact test is used. B. The expression of indicated chemokines with chemoattractant properties for T-lymphocytes and monocytes in subtype III PDFs compared with subtypes I and II PDFs. Mean with 95% CI. * p < 0.05, two-tailed t test is used. C. Schematics of an ex vivo microfluidic assay to recapitulate the immune cell migration process. D. Representative images showing minimal (left) and substantial (right) immune cell migration in the microfluidic chip. E-F. Example images and summary of non-subtype III PDFs (subtypes I and II, n=4, example of a subtype I PDF is shown) and subtype III PDFs (n=4) in chemoattracting peripheral blood mononuclear cells (PBMC) (E) and peripheral blood CD8+ T cells (F) from two healthy donors. One of the representative interface areas is shown. Average level with 95%CI is shown. *, p < 0.05, one-tailed t-test is used. G. A graphic summary of the current study. See also Figure S7 and Table S5-6.

References

    1. Bartoschek M, Oskolkov N, Bocci M, Lövrot J, Larsson C, Sommarin M, Madsen CD, Lindgren D, Pekar G, Karlsson G, Ringnér M, Bergh J, Björklund Å, Pietras K, 2018. Spatially and functionally distinct subclasses of breast cancer-associated fibroblasts revealed by single cell RNA sequencing. Nat Commun 9, 5150. - PMC - PubMed
    1. Bhowmick NA, Chytil A, Plieth D, Gorska AE, Dumont N, Shappell S, Washington MK, Neilson EG, Moses HL, 2004. TGF-beta signaling in fibroblasts modulates the oncogenic potential of adjacent epithelia. Science 303, 848–851. - PubMed
    1. Biffi G, Oni TE, Spielman B, Hao Y, Elyada E, Park Y, Preall J, Tuveson DA, 2019. IL1-Induced JAK/STAT Signaling Is Antagonized by TGFβ to Shape CAF Heterogeneity in Pancreatic Ductal Adenocarcinoma. Cancer Discov 9, 282–301. - PMC - PubMed
    1. Blomme A, Van Simaeys G, Doumont G, Costanza B, Bellier J, Otaka Y, Sherer F, Lovinfosse P, Boutry S, Palacios AP, De Pauw E, Hirano T, Yokobori T, Hustinx R, Bellahcène A, Delvenne P, Detry O, Goldman S, Nishiyama M, Castronovo V, Turtoi A, 2018. Murine stroma adopts a human-like metabolic phenotype in the PDX model of colorectal cancer and liver metastases. Oncogene 37, 1237–1250. - PubMed
    1. Blondel VD, Guillaume J-L, Lambiotte R, Lefebvre E, 2008. Fast unfolding of communities in large networks. J. Stat. Mech 2008, P10008.

Publication types

MeSH terms