. 2021 Dec 1;109(23):3823-3837.e6.
doi: 10.1016/j.neuron.2021.09.020. Epub 2021 Oct 7.

Transcriptional and functional divergence in lateral hypothalamic glutamate neurons projecting to the lateral habenula and ventral tegmental area

Affiliations

Transcriptional and functional divergence in lateral hypothalamic glutamate neurons projecting to the lateral habenula and ventral tegmental area

Mark A Rossi et al. Neuron. .

Abstract

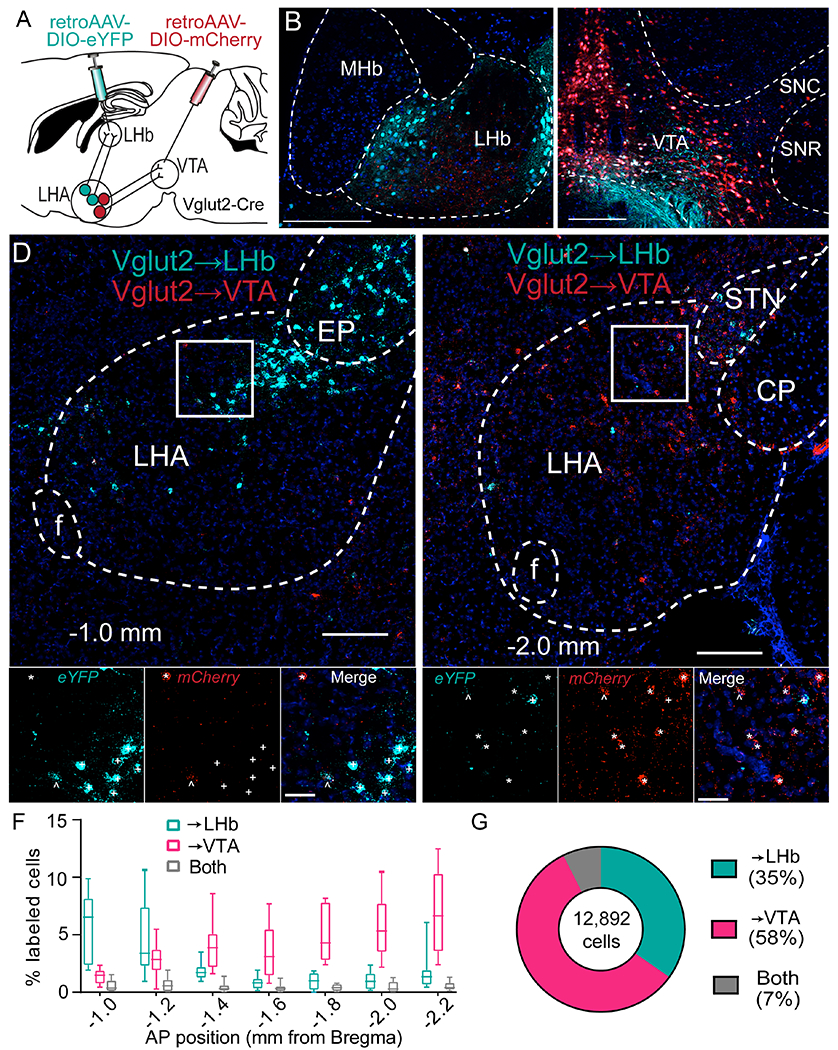
The lateral hypothalamic area (LHA) regulates feeding- and reward-related behavior, but because of its molecular and anatomical heterogeneity, the functions of defined neuronal populations are largely unclear. Glutamatergic neurons within the LHA (LHAVglut2) negatively regulate feeding and appetitive behavior. However, this population comprises transcriptionally distinct and functionally diverse neurons that project to diverse brain regions, including the lateral habenula (LHb) and ventral tegmental area (VTA). To resolve the function of distinct LHAVglut2 populations, we systematically compared projections to the LHb and VTA using viral tracing, single-cell sequencing, electrophysiology, and in vivo calcium imaging. LHAVglut2 neurons projecting to the LHb or VTA are anatomically, transcriptionally, electrophysiologically, and functionally distinct. While both populations encode appetitive and aversive stimuli, LHb projecting neurons are especially sensitive to satiety state and feeding hormones. These data illuminate the functional heterogeneity of LHAVglut2 neurons, suggesting that reward and aversion are differentially processed in divergent efferent pathways.

Keywords: calcium imaging; electrophysiology; ghrelin; lateral habenula; lateral hypothalamic area; leptin; single-cell sequencing; ventral tegmental area.


Conflict of interest statement

Declaration of interests The authors declare no competing interests.

Figures

Figure 1:
Figure 1:. LHAVglut2→LHb and LHAVglut2→VTA projections are anatomically distinct.
A. Dual retrovirus strategy. B-C. Examples of locally transduced cells at LHb and VTA injection sites. Blue, DAPI. Scale bars, 200 μm. D-E. Confocal micrographs showing in situ hybridization of eYFP and mCherry expression in anterior (D) and posterior LHA (E). Approximate AP coordinates are shown. Scale bars: 200 μm top, 50 μm bottom. +, eYFP+; *, mCherry+; ^, eYFP+/mCherry+. F. Relative density of LHAVglut2→LHb and LHAVglut2→VTA projections throughout the AP extent of the LHA (n=10 hemispheres; 5 mice; effect of Projection: F(2,18)=65.83, p=5.3e-9; no effect of AP location: F(6,54)=1.97, p=0.09; Interaction: F(12,108)=12.05, p=4.0e-15). G. Proportion of cells classified as projecting to LHb, VTA, or both. CP, cerebral peduncle; EP, entopeduncular nucleus; MHb, medial habenula; SNC, substantia nigra pars compacta; SNR, pars reticulata; STN, subthalamic nucleus.
Figure 2:
Figure 2:. LHAVglut2→LHb and LHAVglut2→VTA projections are transcriptionally distinct.
A. Experimental pipeline. Fluorophore-encoding retrogradely trafficked AAVs were injected into LHb and VTA. LHA tissue punches were taken and single-cell RNA sequencing was performed. B. UMAP showing 32 LHA neuronal subclusters (n=6). C. Proportion of labeled cells expressing tdTomato (tdT), eYFP, or both. D. DEG analysis comparing eYFP+ and tdTomato+ cells reveals 106 differentially expressed genes (orange and green; p<0.01, dashed line). Positive log fold change (logFC) indicates enrichment in eYFP+ cells. Highlighted genes were selected for in situ validation (See Figure 3). E. eYFP+ and tdTomato+ cells are enriched in distinct neuronal subclusters. F. Pax6 and Pdyn expression within neuronal subclusters. G. Neuronal subclusters are distinguished by unique genes. Highlighted clusters were targeted for in situ validation.
Figure 3:
Figure 3:. HCR validation of single-cell sequencing results.
A. Dual retrograde virus strategy used to profile LHA projection neurons. B. Sequential HRC workflow. Three genes were targeted per round. C-K. Example expression of the nine genes targeted. Rows correspond to HCR rounds. Scale bar, 200 μm. Λ eYFP+, < tdT+ L. Normalized spatial distribution of eYFP+ and tdTomato+ cells within LHA. M-N. Proportion of eYFP+ and tdTomato+ cells expressing each of the 7 marker genes in HCR (M) and RNA sequencing (N) experiments. O. Percent cells expressing each gene is highly correlated between sequencing and HCR experiments (r=0.81, p=0.00047). P. LogFC values were highly correlated between RNA sequencing and HCR experiments (r=0.94, p=0.00015). Negative values indicate enrichment in tdTomato+ cells. Q. HCR and RNA sequencing data are equally effective at classifying cells as eYFP+ or tdTomato+ (* Bonferroni adjusted p<0.05).
Figure 4:
Figure 4:. LHAVglut2→LHb and LHAVglut2→VTA projections are electrophysiologically distinct.
A. Dual retrovirus strategy (left) and example cells (right). B. Example whole cell recording of basal firing rate (left), current step injections (center; −20, 0, and +190 pA injections), and rheobase (right; 10 ms current injections, 10 pA steps). C. Resting potential (46/47 cells; 11/10 mice; t(91)=0.01, p=0.99). D. Action potential amplitude (45/46 cells; 11/10 mice; t(89)=0.01, p=0.99). E. Membrane capacitance (46/47 cells; 11/10 mice; t(91)=2.69, p=0.008). F. Action potential threshold (45/46 cells; 11/10 mice; t(89)=4.56, p=0.00002). G. Afterhyperpolarization (AHP) amplitude (45/46 cells; 11/10 mice; t(89)=2.53, p=0.01). H. Cell attached spontaneous firing rate (30/35 cells; 8/7 mice; t(63)=4.02, p=0.0002). I. Rheobase (46/47 cells; 11/10 mice; t(91)=5.62, p=2e-7). J. Current step injection (spikes per 800 ms sweep. 45/46 cells; 11/10 mice. Effect of Current: F(19,1691)=69.92, p<1e-6; Effect of Projection: F(1,89)=6.34, p=0.01; Interaction: F(19,1691)=3.77, p<1e-6). Mean±s.e.m. K. Electrophysiological properties can be used to decode the projection target (p=0.002).
Figure 5:
Figure 5:. LHAVglut2→LHb and LHAVglut2→VTA projections differentiate appetitive and aversive tastants.
A. Intersectional virus strategy. B. Experimental design. C. Average±s.e.m. lick rate for all trials (n=10 mice). D. Example field of view for LHAVglut2→LHb (top) and LHAVglut2→VTA (bottom) recordings. E. Calcium dynamics extracted from the cells in D. F-G. Single LHAVglut2→LHb and LHAVglut2→VTA ROI activity dynamics for sucrose and quinine trials. Data are aligned to first lick after tastant delivery (dashed line). Right, mean responses. ROIs correspond to arrows in D. Heatmap scale bar: 2s. H. Population activity dynamics for sucrose and quinine trials for LHAVglut2→LHb and LHAVglut2→VTA (n=5 mice/group) recordings. Mean±s.e.m. traces at bottom. Scale bar 2s. I. AUC for LHAVglut2→LHb and LHAVglut2→VTA recordings for sucrose and quinine trials (effect of Tastant: F(1,268)=63.48, p=4.7e-14; no effect of Projection: F(1,268)=1.75, p=0.19; Interaction: F(1,268)=3.97, p=0.047). *, Tukey multiple comparisons test p<0.05. Mean+s.e.m. J. ROI sucrose and quinine responses are correlated (LHb: Pearson r=0.86, p<1.0e-15; VTA: r=0.72, p<1.0e-15; *, F test to compare intercepts: F(1,267)=10.48, p=0.0014). K. Percent ROIs in which quinine response magnitude is higher (↑), lower (↓), or unchanged (↔) relative to sucrose response (paired t-test, p<0.05). Populations compared with chi-squared test (X2=15.60, p=0.0004). L. Activity of individual ROIs belonging to both projections can decode delivered tastant (Welch’s t test LHb model vs shuffle: t(275.4)=14.98, p<1.0e-15; VTA model vs shuffle: t(236.2)=20.84, p>1.0e-15; t test LHb model vs VtA model: t(268)=2.10, p=0.037).
Figure 6:
Figure 6:. Satiety modifies reward encoding in LHAVglut2→LHb and LHAVglut2→VTA projections in vivo.
A. Field of view for LHAVglut2→LHb (top) and LHAVglut2→VTA (bottom) projections. B. Single ROI examples (arrows in A) of activity dynamics during sucrose consumption when mice are fed and fasted. Data are aligned to first lick after sucrose delivery (dashed line). Bottom, mean response. Scale bars: 10% ΔF/F (bottom). Horizontal scale, 2s. C. LHAVglut2→LHb and LHAVglut2→VTA population responses during sucrose consumption (n=5 mice/group). Bottom, mean±s.e.m. Vertical scale, 2% ΔF/F. Horizontal scale, 2s. D. AUC is increased by fasting in both projection populations (effect of Fasting: F(1,578)=21.77, p=3.8e-6; no effect of Projection: F(1,578)=3.40, p=0.07; no Interaction: F(1,578)=0.15, p=0.70). *, Tukey multiple comparisons test p<0.05. Mean+s.e.m. E. AUC values are correlated in fed and fasted ROIs (LHb: Pearson r=0.79, p<1.0e-15; VTA: r=0.75, p<1.0e-15; *, F test to compare slopes: F(1,287)=5.96, p=0.015). F. Percent cells responding to sucrose consumption. Both projections showed more responsivity when fasted than when fed (LHb: X2=25.56, p=2.8e-6; VTA: X2=36.95, p=9.4e-9). When fed, LHb projectors are more responsive than VTA projectors to sucrose consumption (X2=12.58, p=1.9e-3), whereas projections show similar responsivity when fasted (X2=1.71, p=0.42). G. Activity dynamics from single ROIs of both projections could be used to decode satiety state significantly better than shuffled data (LHb: Welch’s t(280.26)=7.13, p=8.5e-12; VTA: t(237.27)=6.18, p=2.7e-9).
Figure 7:
Figure 7:. Feeding hormones differentially modify reward encoding in LHAVglut2→LHb and LHAVglut2→VTA projections.
A. Experimental design. Leptin was injected into fasted mice and ghrelin injected into fed mice. B. Example fields of view. C. Leptin increases the latency to lick following reward delivery for both groups (* effect of Leptin: F(1,390)=5.02, p=0.026; no effect of Projection: F(1,390)=0.15, p=0.70; no Interaction: F(1,390)=0.19, p=0.66). D. Ghrelin reduces the latency to lick following reward delivery for both groups (* effect of Ghrelin: F(1,389)=6.39, p=0.012; no effect of Projection: F(1,389)=0.04, p=0.85; no Interaction: F(1,389)=0.04, p=0.85). E. Population heatmap showing individual cell responses to vehicle and leptin injections. F-G. Mean±s.e.m. response of LHAVglut2→LHb (F) and LHAVglut2→VTA (G) projections during sucrose consumption after leptin administration. H. Leptin reduces evoked response magnitude in LHb projections and increases response magnitude in VTA projections (effect of Leptin: F(1,370)=10.50, p=0.0013; effect of Projection: F(1,370)=7.60, p=0.006; Interaction: F(1,370)=63.99, p=1.6e-14. * Sidak’s multiple comparisons test, p<0.001). V, vehicle; L, leptin. I. Population heatmap showing individual cell responses to vehicle and ghrelin. J-K. Mean±s.e.m. response of LHAVglut2→LHb (J) and LHAVglut2→VTA (K) projections during sucrose consumption after ghrelin administration. L. Ghrelin reduces evoked response magnitude in LHb projections (no effect of Ghrelin: F(1,313)=1.56, p=0.21; no effect of Projection: F(1,313)=2.94, p=0.087; Interaction: F(1,313)=14.94, p=0.00013. * Sidak’s multiple comparisons test, p<0.001). V, vehicle; G, ghrelin. Mean+s.e.m.

References

    1. Abizaid A, Liu Z-W, Andrews ZB, Shanabrough M, Borok E, Elsworth JD, Roth RH, Sleeman MW, Picciotto MR, Tschöp MH, et al. (2006). Ghrelin modulates the activity and synaptic input organization of midbrain dopamine neurons while promoting appetite. J Clin Invest 116, 3229–3239. - PMC - PubMed
    1. Abrahamsen GC, Berman Y, and Carr KD (1995). Curve-shift analysis of self-stimulation in food-restricted rats: relationship between daily meal, plasma corticosterone and reward sensitization. Brain Research 695, 186–194. - PubMed
    1. Anand BK, and Brobeck JR (1951). Hypothalamic Control of Food Intake in Rats and Cats. Yale J Biol Med 24, 123–140. - PMC - PubMed
    1. de Araujo IE, Gutierrez R, Oliveira-Maia AJ, Pereira A, Nicolelis MAL, and Simon SA (2006). Neural Ensemble Coding of Satiety States. Neuron 51, 483–494. - PubMed
    1. Bagnasco M, Kalra PS, and Kalra SP (2002). Ghrelin and Leptin Pulse Discharge in Fed and Fasted Rats. Endocrinology 143, 726–729. - PubMed

Publication types

MeSH terms