. 2021 Oct 14;184(21):5338-5356.e21.
doi: 10.1016/j.cell.2021.09.019. Epub 2021 Oct 7.

Microbiota triggers STING-type I IFN-dependent monocyte reprogramming of the tumor microenvironment

Affiliations

Microbiota triggers STING-type I IFN-dependent monocyte reprogramming of the tumor microenvironment

Khiem C Lam et al. Cell. .

Abstract

The tumor microenvironment (TME) influences cancer progression and therapy response. Therefore, understanding what regulates the TME immune compartment is vital. Here we show that microbiota signals program mononuclear phagocytes in the TME toward immunostimulatory monocytes and dendritic cells (DCs). Single-cell RNA sequencing revealed that absence of microbiota skews the TME toward pro-tumorigenic macrophages. Mechanistically, we show that microbiota-derived stimulator of interferon genes (STING) agonists induce type I interferon (IFN-I) production by intratumoral monocytes to regulate macrophage polarization and natural killer (NK) cell-DC crosstalk. Microbiota modulation with a high-fiber diet triggered the intratumoral IFN-I-NK cell-DC axis and improved the efficacy of immune checkpoint blockade (ICB). We validated our findings in individuals with melanoma treated with ICB and showed that the predicted intratumoral IFN-I and immune compositional differences between responder and non-responder individuals can be transferred by fecal microbiota transplantation. Our study uncovers a mechanistic link between the microbiota and the innate TME that can be harnessed to improve cancer therapies.

Keywords: STING; cancer immunology; dendritic cells; immune checkpoint blockade immunotherapy; innate immunity; interferon; macrophages; microbiota; monocytes; tumor microenvironment.


Conflict of interest statement

Declaration of interests J.A.W. is an inventor on a US patent application (PCT/US17/53.717) relevant to the current work; reports compensation for speaker’s bureau and honoraria from Imedex, Dava Oncology, Omniprex, Illumina, Gilead, PeerView, MedImmune, and Bristol-Myers Squibb (BMS); and serves as a consultant/advisory board member for Roche/Genentech, Novartis, AstraZeneca, GlaxoSmithKline, BMS, Merck, Biothera Pharmaceuticals, and Micronoma. All other authors have no competing interests.

Figures
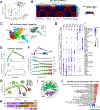
Figure 1.
Figure 1.. Microbiota shapes the MP landscape in the TME
Transcriptomic analysis of tumor MPs from SPF or GF mice. (A-B) NanoString analysis of sorted MPs. PCA (A); Heatmap of DEGs in DCs (FDR < 0.1, |log2(fc)| > 0.6) with ImmGen enriched DC (orange) or Mac (blue) signatures indicated (B). (C-J) scRNAseq analysis of MPs. UMAP projection of cell clusters or group ID (inset) (C). Dot plot of selected cluster specific genes (D). Trajectory analysis (top) and density plot with the relative contribution of SPF and GF cells (bottom) (E). Pseudotime analysis of E with expression of selected genes correlating with pseudotime (F). Trajectory analysis of Mo and Mac clusters with pie charts showing the proportion of each cluster per state (G). Proportion of cells from each state shown in G in SPF and GF samples (H). Circos plot showing common DEGs between SPF and GF within each cell cluster (FDR < 0.1, |log2(fc)| > 0.5). Outer circle: clusters per group. Inner circle: up-regulated DEGs. Lines connect the same genes to each other (I). IPA Canonical Pathways comparing DC2 populations (J). Data from 2 experiments combined (A-B). n=2–3/group/exp (A-J). See also Figures S1–S2 and Tables S1–S3.
Figure 2.
Figure 2.. Absence of microbiota skews TME towards pro-tumorigenic Mac at the expense of Mo and DCs
Tumor leukocytes from mice with (SPF; H2O) or without (GF; ABX) microbiota. (A-D) MPs from EL4 tumors. Frequency of Mo and DCs in tumors from SPF vs GF (A); or H2O vs ABX (B); pie chart of Mac subsets with center inlet indicating pro- or antitumorigenic phenotype (C); pro/antitumor Mac ratios in tumors from SPF vs GF (left) or H2O vs ABX (right) (D). (E-G) MPs from MC38, BP, or TUBO tumors. Frequency of Mo of total CD45+ cells (E); Frequency of DCs of total CD45+ cells (F); pro/antitumor Mac ratio (G). Data are representative of 2 (B, E-G TUBO) or 3 (A, C) experiments. n=5/group/exp (A, C, E-G MC38), n=3–5/group/exp (B, E-G TUBO), n=9–10/group (E-G BP). Data shown as mean +/− SEM, *p<0.05, **p<0.01. See also Figure S2.
Figure 3.
Figure 3.. Microbiota regulates intratumoral IFN-I signaling and NK–DC axis.
(A-B) Cytokine/chemokine profile of EL4 tumor lysates. Normalized measurements from SPF and GF mice (crossed square indicate below detection limit) (A); difference of fold change means of SPF-GF and WT-Ifnar1−/− (Kappa=0.313; SE: standard error of the difference) (B). (C) Frequency of indicated MPs in EL4 tumor of WT or Ifnar1−/− mice. (D-E) Survival plot of WT and Ifnar1−/− (D) or Tmem173−/− (E) EL4 tumor-bearing mice treated or not with oxa. (F-G) Frequency of NKs in EL4 tumors of WT or Ifnar1−/− mice (F) or in indicated syngeneic tumors with or without microbiota (G). (H) RT-qPCR of Xcl1 expression in EL4 tumors from GF or SPF (normalized to Actb SPF mean). (I) MFI of Xcl1 in EL4 tumor-infiltrating NKs from GF or SPF. (J) DEGs between SPF and GF within the NK cell cluster of scRNAseq (FDR < 0.1, |log2(fc)| > 0.5). (K-M) EL4 tumor-infiltrating cells stimulated ex vivo with cdAMP. Frequency of each cell population of total Ifnb1+ CD45+ (K); frequency of Xcl1+ or Ccl5+ NKs of total NKs (L); fold change Ifnb1+ Mo cdAMP vs control (M). (N-O) Intraperitoneal (i.p.) administration of cdAMP. Experimental design (N); frequency of Mo and DCs in the TME (O). Data from 2 experiments combined (A, B SPF-GF, C-F, I, K) or one representative of 2 (G TUBO, H, L, O) or 3 (G EL4) experiments. n=3/group/exp (A, B SPF-GF), n=5/group/exp (B WT-Ifnar1−/−, H), n=4–8/group/exp (C, F, G, K, L, M), n=5–10/group/exp (I, O). Data shown as mean +/− SEM, *p<0.05, **p<0.01, ***p<0.001, ****p<0.0001. See also Figures S3, S4, and Table S4.
Figure 4.
Figure 4.. Fiber diet increases tumor DCs and antitumor response
Mice receiving control or fiber diet as indicated. (A-C) Frequency of DCs (A); tumor weight (B); average (left) and individual (right) tumor growth curves (C) of EL4 tumors. (D-H) Frequency of DCs (D); tumor weight (E); average (left) and individual (right) tumor growth curve (F); frequency of indicated MPs (G-H) in MC38 tumors. (I-J) Tumor growth curve and survival plot of MC38 tumor-bearing mice treated with anti-PD-1 (I) or anti-PD-L1 (J). Data from 2 (D, E) or 3 (A-C) experiments combined. One representative of 2 (G, H) or 3 (F, I) experiments. (A-H) n=4–8/group/exp. Data shown as mean +/− SEM, *p<0.05, **p<0.01, ***p<0.001, ****p<0.0001. See also Figure S4.
Figure 5.
Figure 5.. Fiber diet and A. muciniphila (Akk) trigger IFN-I–NK–DC axis in the TME
(A) EL4 tumor-infiltrating cells from SPF mice fed control or fiber diet stimulated ex vivo with cdAMP. Fold change of Ifnb1+ Mo (left) and Xcl1 MFI on NKs (right). (B-C) Microbiome analysis of feces from mice fed control or fiber diet. PCoA using weighted Unifrac (B); relative abundance of phyla after diet and before tumor implantation (C). (D) Transkingdom network analysis of host phenotype and differentially abundant microbes (DAMs) from mice fed control or fiber diet. Nodes = host phenotypes (square) or DAMs (circle); edges = Spearman correlation. (E) Bipartite betweenness centrality (BiBC) score calculated between DAMs and phenotypes for each DAM in D. (F-G) GF mice monocolonized or not with Akk and implanted with EL4 tumors. MP characterization (F); tumor growth curve (G). (H-I) LCMS quantification of indicated cyclic dinucleotides (CDNs) in Akk cell pellets (H) or in cecum content of tumor-bearing SPF or mice from F (I). (J) Fold change of IRF3 activation in STING reporter cells stimulated with cdAMP (3 ug/ml), heat-killed Akk (MOI 100), or Akk spent medium (1:10) in presence or absence of STING inhibitor H-151. (K) EL4 tumor-infiltrating cells from mice from F stimulated ex vivo with cdAMP. Fold change of Ifnb1+ Mo (left) and Xcl1 MFI on NKs (right). Data from 2 (A) or 3 (B, C, J) experiments combined or one representative of 2 (F, G) or 3 (H) experiments. Dots in H and J depict technical replicates. n=5–8/group/exp (F, G, K), n=4–10/group/exp (A, I), n=8–15 mice/group/exp (B, C). Data shown as mean +/− SEM, *p<0.05, **p<0.01, ****p<0.0001. See also Figure S5 and Table S5.
Figure 6.
Figure 6.. Monocytes and the IFN-I–NK–DC axis correlate with response to ICB in melanoma patients
Analysis of tumor RNAseq data from melanoma patients treated with ICB. Indicated signatures described in Methods under Patient tumor RNAseq analysis. (A-B) Discovery cohort tumor samples from multiple timepoints representative of 10 responder (R) and 12 non-responder (NR) patients. Pearson correlations (A); signatures’ Z-score means in R (n=27) and NR (n=35) tumor samples (B). (C-D) Validation cohort tumor samples post-treatment (n=84 patients) with 45 R and 38 NR. Signatures’ Z-score means in R and NR tumors (C); overall survival of patients after ICB treatment stratified by median expression of the indicated signatures (log-rank p-value shown). Truncated violin plots show median with quartiles, *p<0.05, **p<0.01, ***p<0.001. See also Figure S6.
Figure 7.
Figure 7.. Patient microbiota regulates IFN-I and shapes the MP landscape in the TME
(A-F) FMT from 3 R or 3 NR patients individually transferred into GF mice implanted with BP tumors. Experimental design (A); UMAP projection of tumor-infiltrating cells analyzed by FACS (LiveCD45+) (B); pie chart of Mo and Mac clusters from B (C); fold change of MP proportions (D) or Ifnb1 expression (RT-qPCR normalized to Actb; E) referred to respective R of each experimental cohort (individual donors indicated by color and experimental cohort by symbol); tumor growth curve (F). (G-I) Analysis of tumor RNAseq from FMT clinical trial including 3 trial-R and 6 trial-NR (Baruch et al., 2021). GSEA showing Interferon Alpha Response pathway enriched in trial-R vs trial-NR patients post-FMT (G); signatures’ Z-score means in trial-R and trial-NR tumors post-FMT (H); signature change after FMT (I). Data from 3 experiments combined (D, E) or one representative of 3 (B, C, F) experiments. n=5–8/donor/exp (B-F). Data shown as mean +/− SEM, *p<0.05, **p<0.01, ****p<0.0001. See also Figure S7.

Comment in

References

    1. Abt MC, Osborne LC, Monticelli LA, Doering TA, Alenghat T, Sonnenberg GF, Paley MA, Antenus M, Williams KL, Erikson J, et al. (2012). Commensal bacteria calibrate the activation threshold of innate antiviral immunity. Immunity 37, 158–170. - PMC - PubMed
    1. Antunes KH, Fachi JL, de Paula R, da Silva EF, Pral LP, Dos Santos AA, Dias GBM, Vargas JE, Puga R, Mayer FQ, et al. (2019). Microbiota-derived acetate protects against respiratory syncytial virus infection through a GPR43-type 1 interferon response. Nat Commun 10, 3273. - PMC - PubMed
    1. Araya RE, and Goldszmid RS (2020). Characterization of the tumor immune infiltrate by multiparametric flow cytometry and unbiased high-dimensional data analysis. Methods Enzymol 632, 309–337. - PMC - PubMed
    1. Arthur JC, Perez-Chanona E, Muhlbauer M, Tomkovich S, Uronis JM, Fan TJ, Campbell BJ, Abujamel T, Dogan B, Rogers AB, et al. (2012). Intestinal inflammation targets cancer-inducing activity of the microbiota. Science 338, 120–123. - PMC - PubMed
    1. Bae HR, Leung PSC, Hodge DL, Fenimore JM, Jeon SM, Thovarai V, Dzutsev A, Welcher AA, Boedigheimer M, Damore MA, et al. (2020). Multi-omics: Differential expression of IFN-gamma results in distinctive mechanistic features linking chronic inflammation, gut dysbiosis, and autoimmune diseases. J Autoimmun 111, 102436. - PMC - PubMed

Publication types

MeSH terms

Supplementary concepts