. 2022 Jan 11;45(1):zsab249.
doi: 10.1093/sleep/zsab249.

Concordance of multiple methods to define resiliency and vulnerability to sleep loss depends on Psychomotor Vigilance Test metric

Affiliations

Concordance of multiple methods to define resiliency and vulnerability to sleep loss depends on Psychomotor Vigilance Test metric

Erika M Yamazaki et al. Sleep. .

Abstract

Study objectives: Sleep restriction (SR) and total sleep deprivation (TSD) reveal well-established individual differences in Psychomotor Vigilance Test (PVT) performance. While prior studies have used different methods to categorize such resiliency/vulnerability, none have systematically investigated whether these methods categorize individuals similarly.

Methods: Forty-one adults participated in a 13-day laboratory study consisting of two baseline, five SR, four recovery, and one 36 h TSD night. The PVT was administered every 2 h during wakefulness. Three approaches (Raw Score [average SR performance], Change from Baseline [average SR minus average baseline performance], and Variance [intraindividual variance of SR performance]), and within each approach, six thresholds (±1 standard deviation and the best/worst performing 12.5%, 20%, 25%, 33%, and 50%) classified Resilient/Vulnerable groups. Kendall's tau-b correlations examined the concordance of group categorizations of approaches within and between PVT lapses and 1/reaction time (RT). Bias-corrected and accelerated bootstrapped t-tests compared group performance.

Results: Correlations comparing the approaches ranged from moderate to perfect for lapses and zero to moderate for 1/RT. Defined by all approaches, the Resilient groups had significantly fewer lapses on nearly all study days. Defined by the Raw Score approach only, the Resilient groups had significantly faster 1/RT on all study days. Between-measures comparisons revealed significant correlations between the Raw Score approach for 1/RT and all approaches for lapses.

Conclusion: The three approaches defining vigilant attention resiliency/vulnerability to sleep loss resulted in groups comprised of similar individuals for PVT lapses but not for 1/RT. Thus, both method and metric selection for defining vigilant attention resiliency/vulnerability to sleep loss is critical.

Keywords: Psychomotor Vigilance Test; baseline; individual differences; recovery; sleep deprivation; variance.


Figures

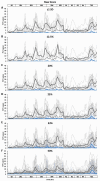
Figure 1.
Figure 1.
Resilient (Res), Vulnerable (Vul), and Intermediate (Int) group Psychomotor Vigilance Test (PVT) lapses profiles across the study using six different thresholds within the Raw Score approach. Res, Vul, and Int groups were determined by averaging PVT lapses from all test administrations during sleep restriction days 1–5 (SR1–SR5) (e.g. the fewer PVT lapses, the more resilient) and using the following six thresholds: (A) ±1 standard deviation (SD) (Res N = 5; Vul N = 8; Int N = 28); (B) the best and worst performing 12.5% (Res N = 5; Vul N = 5; Int N = 31); (C) the best and worst performing 20% (Res N = 8; Vul N = 8; Int N = 25); (D) the best and worst performing 25% (Res N = 10; Vul N = 10; Int N = 21); (E) the best and worst performing 33% (Res N = 13; Vul N = 13; Int N = 15); (F) the best and worst performing 50% (Res N = 20; Vul N = 21; all N = 41). All Res groups had significantly better performance than their respective Vul groups at all thresholds and on all study days (see Table 2 for detailed daytime performance t-test results). The top and bottom axis labels depict the study design: Baseline day 2 (B2, 1000–2400 h), SR1 (0200 h, 0800–0200 h), SR2–SR4 (0800–0200 h), SR5 (0800–2000 h), Recovery days 1–4 (R1–R4, 1000–2000 h), and total sleep deprivation day (TSD, 2200–2000 h). Light blue lines and light gray lines depict individual PVT lapses profiles for the Res and Vul groups, respectively; the dark blue and the dark gray line depict averaged PVT lapses profiles for the Res and Vul groups, respectively. The black dotted line depicts the Int group (except for 50%, for which this line depicts all participants) average PVT lapses profile. Breaks in the lines indicate missing data.
Figure 2.
Figure 2.
Resilient (Res), Vulnerable (Vul), and Intermediate (Int) group Psychomotor Vigilance Test (PVT) lapses profiles across the study using six different thresholds within the Change from Baseline approach. Res, Vul, and Int groups were determined by subtracting each participant’s mean PVT lapses score across baseline day (B2) from their mean PVT lapses score across sleep restriction days 1–5 (SR1–SR5) (e.g. the lower the average change from baseline score, the more resilient) and using the following six thresholds: (A) ±1 standard deviation (SD) (Res N = 4; Vul N = 7; Int N = 30); (B) the best and worst performing 12.5% (Res N = 5; Vul N = 5; Int N = 31); (C) the best and worst performing 20% (Res N = 8; Vul N = 8; Int N = 25); (D) the best and worst performing 25% (Res N = 10; Vul N = 10; Int N = 21); (E) the best and worst performing 33% (Res N = 13; Vul N = 13; Int N = 15); (F) the best and worst performing 50% (Res N = 20; Vul N = 21; all N = 41). All Res groups had significantly better performance than their respective Vul groups at all thresholds and on all study days except for on B2 at the 50% threshold (see Table 2 for detailed daytime performance t-test results). The top and bottom axis labels depict the study design: B2 (1000–2400 h), SR1 (0200 h, 0800–0200 h), SR2–SR4 (0800–0200 h), SR5 (0800–2000 h), Recovery days 1–4 (R1–R4, 1000–2000 h), and total sleep deprivation day (TSD, 2200–2000 h). Light blue lines and light gray lines depict individual PVT lapses profiles for the Res and Vul groups, respectively; the dark blue and the dark gray line depict averaged PVT lapses profiles for the Res and Vul groups, respectively. The black dotted line depicts the Int group (except for 50%, for which this line depicts all participants) average PVT lapses profile. Breaks in the lines indicate missing data.
Figure 3.
Figure 3.
Resilient (Res), Vulnerable (Vul), and Intermediate (Int) group Psychomotor Vigilance Test (PVT) lapses profiles across the study using six different thresholds within the Variance approach. Res, Vul, and Int groups were determined by intraindividual variance in PVT lapses from all test administrations during sleep restriction days 1–5 (SR1–SR) (e.g. the less variance, the more resilient) and using the following six thresholds: (A) ±1 standard deviation (SD) (Res N = 0; Vul N = 8; Int N = 33); (B) the best and worst performing 12.5% (Res N = 5; Vul N = 5; Int N = 31); (C) the best and worst performing 20% (Res N = 8; Vul N = 8; Int N = 25); (D) the best and worst performing 25% (Res N = 10; Vul N = 10; Int N = 21); (E) the best and worst performing 33% (Res N = 13; Vul N = 13; Int N = 15); (F) the best and worst performing 50% (Res N = 20; Vul N = 21; all N = 41). All Res groups had significantly better performance than their respective Vul groups at all thresholds and on all study days (see Table 2 for detailed daytime performance t-test results). The top and bottom axis labels depict the study design: Baseline day 2 (B2, 1000–2400 h), SR1 (0200 h, 0800–0200 h), SR2–SR4 (0800–0200 h), SR5 (0800–2000 h), Recovery days 1–4 (R1–R4, 1000–2000 h), and total sleep deprivation day (TSD, 2200–2000 h). Light blue lines and light gray lines depict individual PVT lapses profiles for the Res and Vul groups, respectively; the dark blue and the dark gray line depict averaged PVT lapses profiles for the Res and Vul groups, respectively. There was no Res group for the ±1 SD threshold due to no participants having a z-score >1.0. The black dotted line depicts the Int group (except for 50%, for which this line depicts all participants) average PVT lapses profile. Breaks in the lines indicate missing data.
Figure 4.
Figure 4.
Resilient (Res), Vulnerable (Vul), and Intermediate (Int) group Psychomotor Vigilance Test (PVT) response speed (1/RT) profiles across the study using six different thresholds within the Raw Score approach. Res, Vul, and Int groups were determined by averaging PVT 1/RT from all test administrations during sleep restriction days 1–5 (SR1–SR5) (e.g. the greater PVT 1/RT, the more resilient) and using the following six thresholds: (A) ±1 standard deviation (SD) (Res N = 7; Vul N = 6; Int N = 28); (B) the best and worst performing 12.5% (Res N = 5; Vul N = 5; Int N = 31); (C) the best and worst performing 20% (Res N = 8; Vul N = 8; Int N = 25); (D) the best and worst performing 25% (Res N = 10; Vul N = 10; Int N = 21); (E) the best and worst performing 33% (Res N = 13; Vul N = 13; Int N = 15); (F) the best and worst performing 50% (Res N = 20; Vul N = 21; all N = 41). All Res groups had significantly better performance than their respective Vul groups at all thresholds and on all study days (see Table 2 for detailed daytime performance t-test results). The top and bottom axis labels depict the study design: Baseline day 2 (B2, 1000–2400 h), SR1 (0200 h, 0800–0200 h), SR2–SR4 (0800–0200 h), SR5 (0800–2000 h), Recovery days 1–4 (R1–R4, 1000–2000 h), and total sleep deprivation day (TSD, 2200–2000 h). Light blue lines and light gray lines depict individual PVT 1/RT profiles for the Res and Vul groups, respectively; the dark blue and the dark gray line depict group averaged PVT 1/RT profiles for the Res and Vul groups, respectively. The black dotted line depicts the Int group (except for 50%, for which this line depicts all participants) average PVT 1/RT profile. Breaks in the lines indicate missing data.
Figure 5.
Figure 5.
Resilient (Res), Vulnerable (Vul), and Intermediate (Int) group Psychomotor Vigilance Test (PVT) response speed (1/RT) profiles across the study using six different thresholds within the Change from Baseline approach. Res, Vul, Int groups were determined by subtracting each participant’s mean PVT 1/RT score across baseline day (B2) from their mean PVT 1/RT score across sleep restriction days 1–5 (SR1–SR5) (e.g. the greater the average change from baseline score, the more resilient) and using the following six thresholds: (A) ±1 standard deviation (SD) (Res N = 8; Vul N = 6; Int N = 28); (B) the best and worst performing 12.5% (Res N = 5; Vul N = 5; Int N = 31); (C) the best and worst performing 20% (Res N = 8; Vul N = 8; Int N = 25); (D) the best and worst performing 25% (Res N = 10; Vul N = 10; Int N = 21); (E) the best and worst performing 33% (Res N = 13; Vul N = 13; Int N = 15); (F) the best and worst performing 50% (Res N = 20; Vul N = 21; all N = 41). All Res groups had significantly better performance than their respective Vul groups at all thresholds and on all study days except for on B2 at all thresholds and on SR1 at the ±1 SD, 12.5%, 20%, 33%, and 50% thresholds (see Table 2 for detailed daytime performance t-test results). The top and bottom axis labels depict the study design: B2 (1000–2400 h), SR1 (0200 h, 0800–0200 h), SR2–SR4 (0800–0200 h), SR5 (0800–2000 h), Recovery days 1–4 (R1–R4, 1000–2000 h), and total sleep deprivation day (TSD, 2200–2000 h). Light blue lines and light gray lines depict individual PVT 1/RT profiles for the Res and Vul groups, respectively; the dark blue and the dark gray line depict averaged PVT 1/RT profiles for the Res and Vul groups, respectively. The black dotted line depicts the Int group (except for 50%, for which this line depicts all participants) average PVT 1/RT profile. Breaks in the lines indicate missing data.
Figure 6.
Figure 6.
Resilient (Res), Vulnerable (Vul), and Intermediate (Int) group Psychomotor Vigilance Test (PVT) response speed (1/RT) profiles across the study using six different thresholds within the Variance approach. Res, Vul, and Int groups were determined by intraindividual variance in PVT 1/RT from all test administrations during sleep restriction days 1–5 (SR1–SR5) (e.g. the less variance, the more resilient) and using the following six thresholds: (A) ±1 standard deviation (SD) (Res N = 3; Vul N = 7; Int N = 31); (B) the best and worst performing 12.5% (Res N = 5; Vul N = 5; Int N = 31); (C) the best and worst performing 20% (Res N = 8; Vul N = 8; Int N = 25); (D) the best and worst performing 25% (Res N = 10; Vul N = 10; Int N = 21); (E) the best and worst performing 33% (Res N = 13; Vul N = 13; Int N = 15); (F) the best and worst performing 50% (Res N = 20; Vul N = 21; all N = 41). Results from t-tests comparing daytime performance varied based on study day and threshold (see Table 2 for detailed daytime performance t-test results). The top and bottom axis labels depict the study design: Baseline day 2 (B2, 1000–2400 h), SR1 (0200 h, 0800–0200 h), SR2–SR4 (0800–0200 h), SR5 (0800–2000 h), Recovery days 1–4 (R1–R4, 1000–2000 h), and total sleep deprivation day (TSD, 2200–2000 h). Light blue lines and light gray lines depict individual PVT 1/RT profiles for the Res and Vul groups, respectively; the dark blue and the dark gray line depict averaged PVT 1/RT profiles for the Res and Vul groups, respectively. The black dotted line depicts the Int group (except for 50%, for which this line depicts all participants) average PVT 1/RT profile. Breaks in the lines indicate missing data.

Similar articles

Cited by

References

    1. Belenky G, et al. . Patterns of performance degradation and restoration during sleep restriction and subsequent recovery: a sleep dose-response study. J Sleep Res. 2003;12(1):1–12. - PubMed
    1. Goel N. Neurobehavioral effects and biomarkers of sleep loss in healthy adults. Curr Neurol Neurosci Rep. 2017;17(11):89. - PubMed
    1. Goel N, et al. . Neurocognitive consequences of sleep deprivation. Semin Neurol. 2009;29(4):320–339. - PMC - PubMed
    1. Yamazaki EM, et al. . Residual, differential neurobehavioral deficits linger after multiple recovery night following chronic sleep restriction or acute total sleep deprivation. Sleep. 2021;44(4):zsaa224. doi: 10.1093/sleep/zsaa224. - DOI - PMC - PubMed
    1. Dennis LE, et al. . Healthy Adults display long-term trait-like neurobehavioral resilience and vulnerability to sleep loss. Sci Rep. 2017;7(1):14889. - PMC - PubMed

Publication types