. 2022 Feb 1;28(3):507-517.
doi: 10.1158/1078-0432.CCR-21-2404. Epub 2021 Oct 8.

Circulating Tumor DNA in Stage III Colorectal Cancer, beyond Minimal Residual Disease Detection, toward Assessment of Adjuvant Therapy Efficacy and Clinical Behavior of Recurrences

Affiliations

Circulating Tumor DNA in Stage III Colorectal Cancer, beyond Minimal Residual Disease Detection, toward Assessment of Adjuvant Therapy Efficacy and Clinical Behavior of Recurrences

Tenna Vesterman Henriksen et al. Clin Cancer Res. .

Abstract

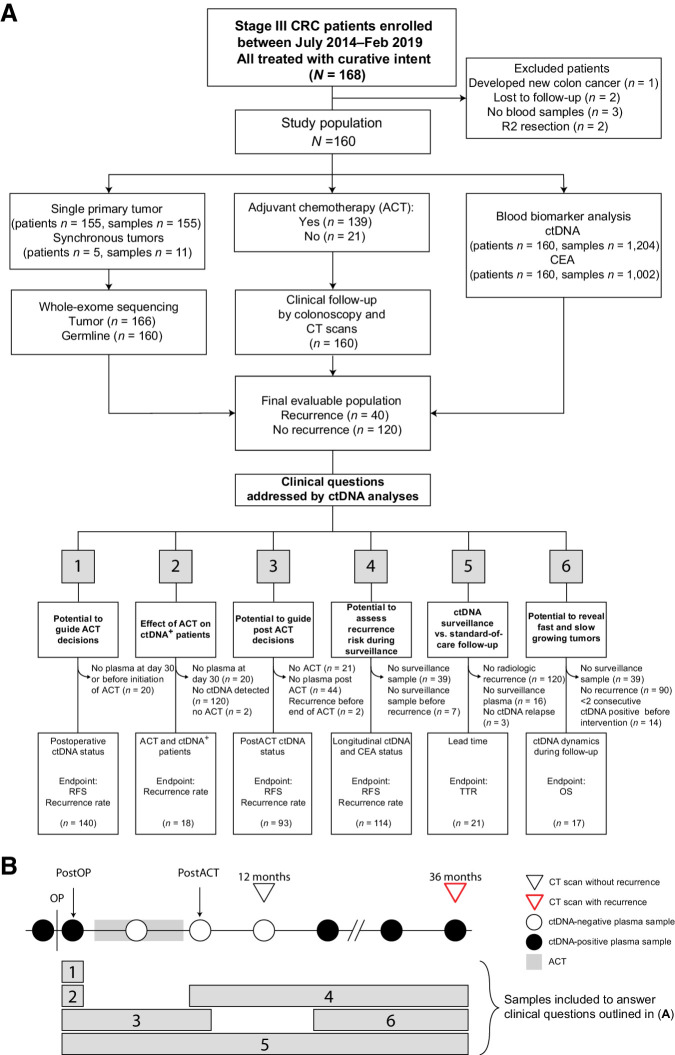
Purpose: Sensitive methods for risk stratification, monitoring therapeutic efficacy, and early relapse detection may have a major impact on treatment decisions and patient management for stage III colorectal cancer patients. Beyond assessing the predictive power of postoperative ctDNA detection, we explored the added benefits of serial analysis: assessing adjuvant chemotherapy (ACT) efficacy, early relapse detection, and ctDNA growth rates.

Experimental design: We recruited 168 patients with stage III colorectal cancer treated with curative intent at Danish and Spanish hospitals between 2014 and 2019. To quantify ctDNA in plasma samples (n = 1,204), 16 patient-specific somatic single-nucleotide variants were profiled using multiplex-PCR, next-generation sequencing.

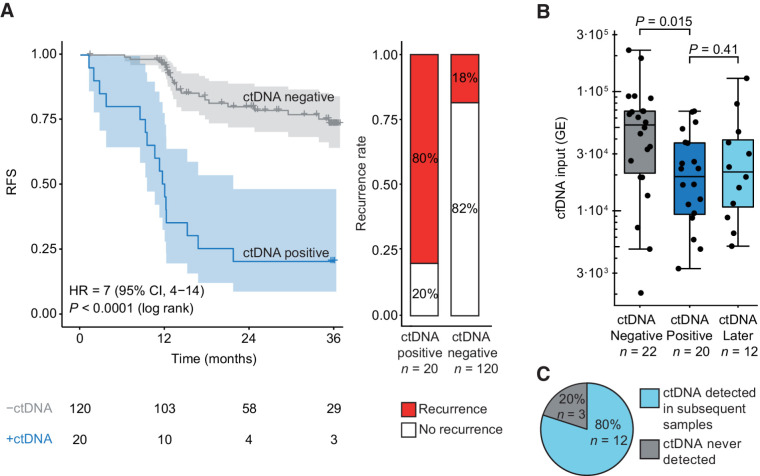
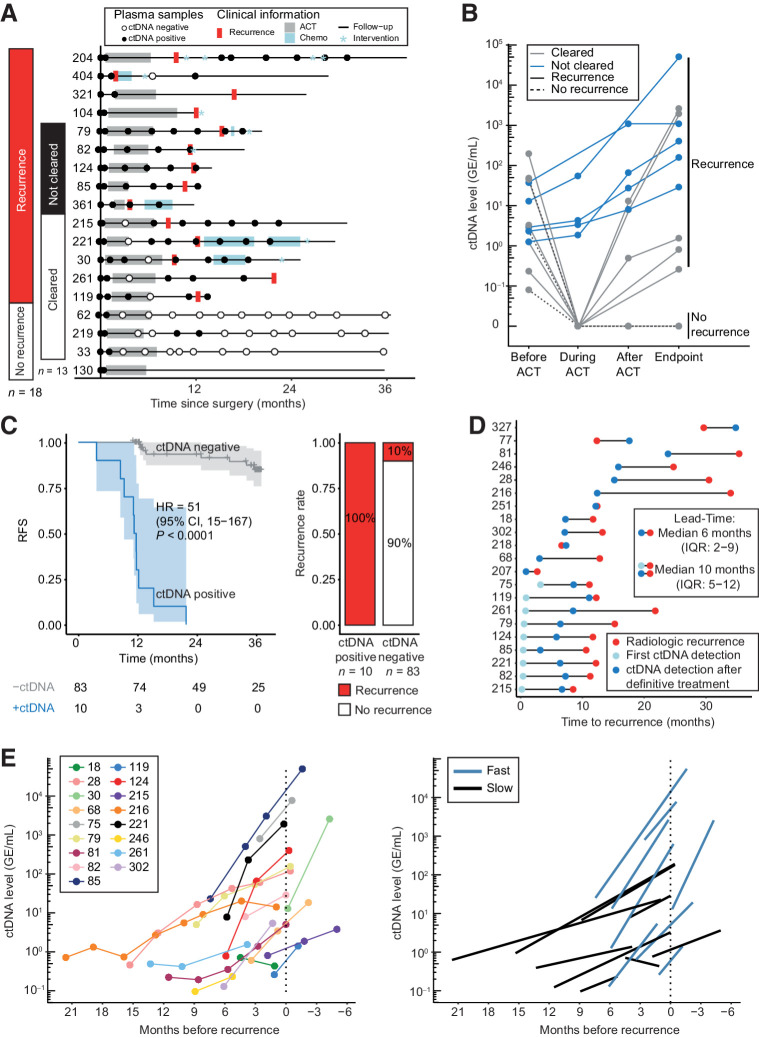
Results: Detection of ctDNA was a strong recurrence predictor postoperatively [HR = 7.0; 95% confidence interval (CI), 3.7-13.5; P < 0.001] and directly after ACT (HR = 50.76; 95% CI, 15.4-167; P < 0.001). The recurrence rate of postoperative ctDNA-positive patients treated with ACT was 80% (16/20). Only patients who cleared ctDNA permanently during ACT did not relapse. Serial ctDNA assessment after the end of treatment was similarly predictive of recurrence (HR = 50.80; 95% CI, 14.9-172; P < 0.001), and revealed two distinct rates of exponential ctDNA growth, slow (25% ctDNA-increase/month) and fast (143% ctDNA-increase/month; P < 0.001). The ctDNA growth rate was prognostic of survival (HR = 2.7; 95% CI, 1.1-6.7; P = 0.039). Serial ctDNA analysis every 3 months detected recurrence with a median lead-time of 9.8 months compared with standard-of-care computed tomography.

Conclusions: Serial postoperative ctDNA analysis has a strong prognostic value and enables tumor growth rate assessment. The novel combination of ctDNA detection and growth rate assessment provides unique opportunities for guiding decision-making.See related commentary by Morris and George, p. 438.


Figures

Figure 1. Inclusion of patients in subanalyses. A, Flow diagram of patient inclusion in subanalyses with clinical questions answered by each analysis denoted. Clinical questions numbered from 1–6. B, Outline of plasma samples included in each subanalysis. Numbered bars correspond to numbered clinical questions denoted in A. CRC, colorectal cancer; OS, overall survival; postOP, postoperative blood sample; postACT, post adjuvant chemotherapy blood sample.
Figure 1.
Inclusion of patients in subanalyses. A, Flow diagram of patient inclusion in subanalyses with clinical questions answered by each analysis denoted. Clinical questions numbered from 1–6. B, Outline of plasma samples included in each subanalysis. Numbered bars correspond to numbered clinical questions denoted in A. CRC, colorectal cancer; OS, overall survival; postOP, postoperative blood sample; postACT, post adjuvant chemotherapy blood sample.
Figure 2. Detection of ctDNA after surgery. A, Kaplan–Meier plot of RFS stratified for ctDNA detection in blood samples collected within 2 months after surgery. Recurrence rates in ctDNA-positive and ctDNA-negative patients are shown. B, Levels of cell-free DNA (cfDNA, in genome equivalents) in samples that were ctDNA negative immediately after surgery in recurrence patients; ctDNA positive immediately after surgery; or ctDNA positive >2 months after surgery in initially ctDNA-negative recurrence patients. Log-transformed cfDNA levels were compared by a Student t test. C, Recurrence patients without detectable ctDNA immediately after surgery and with samples collected >2 months after surgery were included in this analysis (n = 15). Proportion of patients, initially ctDNA negative, with ctDNA detected in subsequent samples, is shown.
Figure 2.
Detection of ctDNA after surgery. A, Kaplan–Meier plot of RFS stratified for ctDNA detection in blood samples collected within 2 months after surgery. Recurrence rates in ctDNA-positive and ctDNA-negative patients are shown. B, Levels of cell-free DNA (cfDNA, in genome equivalents) in samples that were ctDNA negative immediately after surgery in recurrence patients; ctDNA positive immediately after surgery; or ctDNA positive >2 months after surgery in initially ctDNA-negative recurrence patients. Log-transformed cfDNA levels were compared by a Student t test. C, Recurrence patients without detectable ctDNA immediately after surgery and with samples collected >2 months after surgery were included in this analysis (n = 15). Proportion of patients, initially ctDNA negative, with ctDNA detected in subsequent samples, is shown.
Figure 3. Using ctDNA for assessment of ACT effect and recurrence risk after end of treatment. A, Overview of blood samples analyzed for ctDNA in patients who were ctDNA positive within 2 months after surgery and received ACT. Patients are grouped according to recurrence status and whether the patient was cleared for ctDNA by ACT. B, ctDNA level before ACT, during ACT, immediately after ACT, and at time of recurrence or end of follow-up (endpoint). C, Kaplan–Meier plot of recurrence-free survival stratified for ctDNA detection in blood samples drawn within three months after the end of ACT. Recurrence rates in ctDNA-positive and ctDNA-negative patients are shown. D, Time to recurrence detection for ctDNA and CT imaging in ctDNA-positive recurrence patients with serially collected plasma samples after end of definitive therapy (n = 21). Lead-time calculated for (i) ctDNA detection after end of definitive therapy (dark blue dot) versus radiologic recurrence (red dot) and (ii) for ctDNA detection at any time (light and dark blue dot) versus radiologic recurrence (red dot). Recurrence was detected by ctDNA before or at the same time as CT imaging in 19 of 24 (79%) recurrence patients. E, An exponential increase in ctDNA levels was observed for recurrence patients after end of definitive treatment. Raw ctDNA measurements for each patient are shown in a unique color (left). Regression line of slow and fast growing ctDNA levels are shown (right).
Figure 3.
Using ctDNA for assessment of ACT effect and recurrence risk after end of treatment. A, Overview of blood samples analyzed for ctDNA in patients who were ctDNA positive within 2 months after surgery and received ACT. Patients are grouped according to recurrence status and whether the patient was cleared for ctDNA by ACT. B, ctDNA level before ACT, during ACT, immediately after ACT, and at time of recurrence or end of follow-up (endpoint). C, Kaplan–Meier plot of recurrence-free survival stratified for ctDNA detection in blood samples drawn within three months after the end of ACT. Recurrence rates in ctDNA-positive and ctDNA-negative patients are shown. D, Time to recurrence detection for ctDNA and CT imaging in ctDNA-positive recurrence patients with serially collected plasma samples after end of definitive therapy (n = 21). Lead-time calculated for (i) ctDNA detection after end of definitive therapy (dark blue dot) versus radiologic recurrence (red dot) and (ii) for ctDNA detection at any time (light and dark blue dot) versus radiologic recurrence (red dot). Recurrence was detected by ctDNA before or at the same time as CT imaging in 19 of 24 (79%) recurrence patients. E, An exponential increase in ctDNA levels was observed for recurrence patients after end of definitive treatment. Raw ctDNA measurements for each patient are shown in a unique color (left). Regression line of slow and fast growing ctDNA levels are shown (right).

Comment in

References

    1. Sung H, Ferlay J, Siegel RL, Laversanne M, Soerjomataram I, Jemal A, et al. Global cancer statistics 2020: GLOBOCAN estimates of incidence and mortality worldwide for 36 cancers in 185 countries. CA Cancer J Clin 2020;71:209–49. - PubMed
    1. Osterman E, Hammarström K, Imam I, Osterlund E, Sjöblom T, Glimelius B. Recurrence risk after radical colorectal cancer surgery-less than before, but how high is it? Cancers 2020;12:3308. - PMC - PubMed
    1. Argilés G, Tabernero J, Labianca R, Hochhauser D, Salazar R, Iveson T, et al. Localised colon cancer: ESMO clinical practice guidelines for diagnosis, treatment and follow-up y on behalf of the ESMO Guidelines Committee. Ann Oncol 2020;31:1291–305. - PubMed
    1. Pahlman LA, Hohenberger WM, Matzel K, Sugihara K, Quirke P, Glimelius B. Should the benefit of adjuvant chemotherapy in colon cancer be re-evaluated? J Clin Oncol 2016;34:1297–9. - PubMed
    1. Osterman E, Glimelius B. Recurrence risk after up-to-date colon cancer staging, surgery, and pathology. Dis Colon Rectum 2018;61:1016–25. - PubMed

Publication types