. 2021 Oct 19;118(42):e2018640118.
doi: 10.1073/pnas.2018640118.

Reduction in gene expression noise by targeted increase in accessibility at gene loci

Affiliations

Reduction in gene expression noise by targeted increase in accessibility at gene loci

LaTasha C R Fraser et al. Proc Natl Acad Sci U S A. .

Abstract

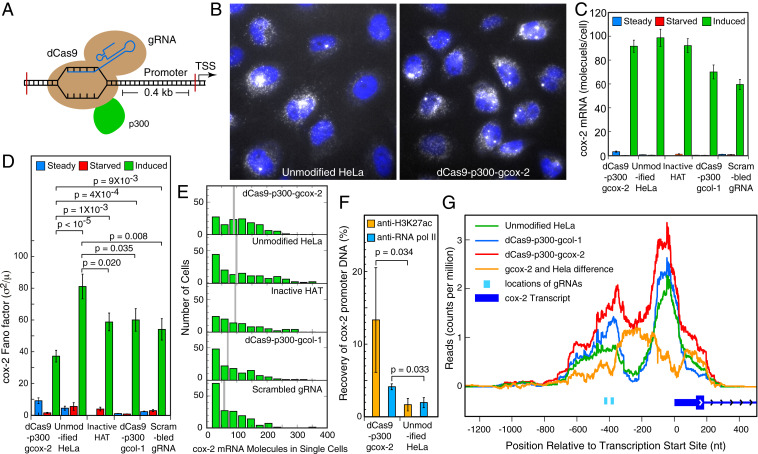
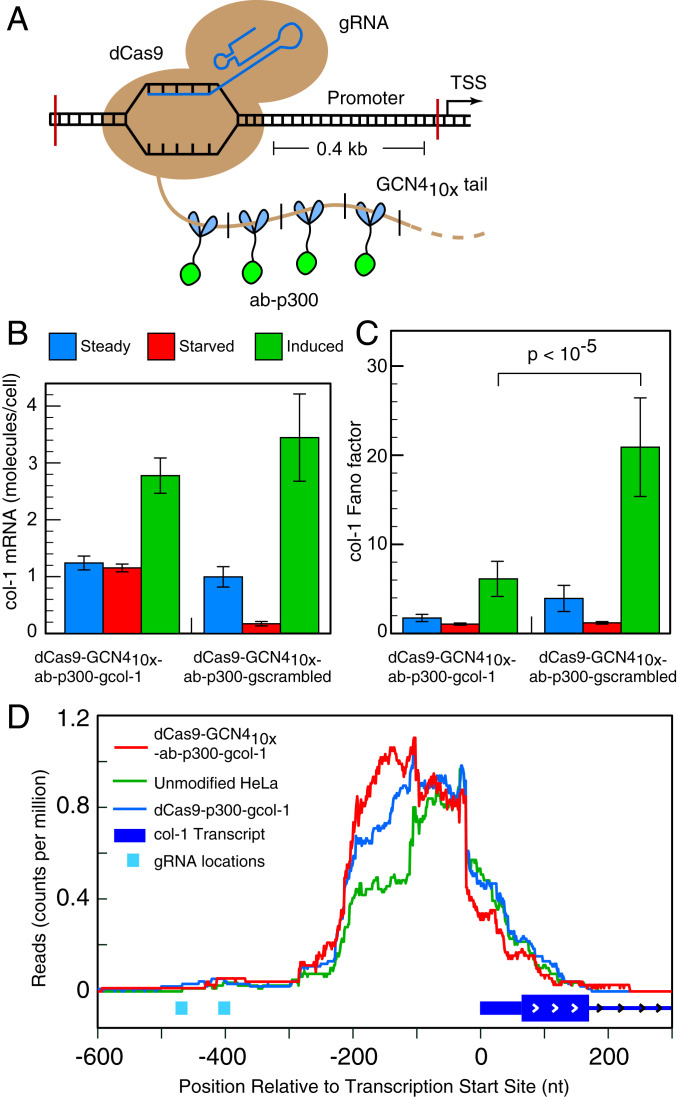
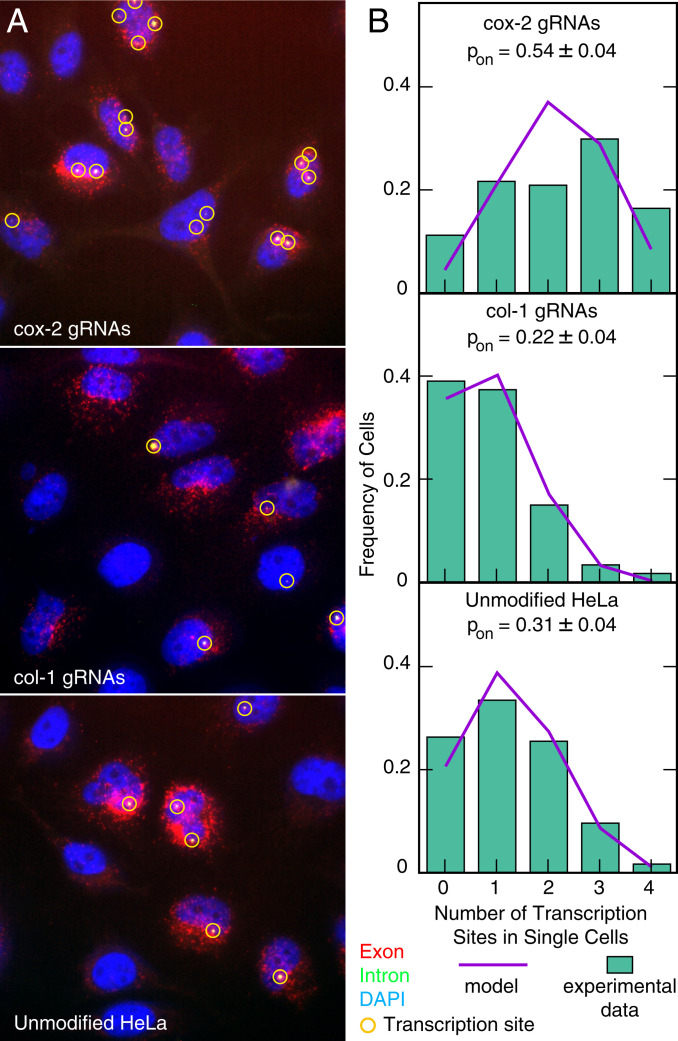
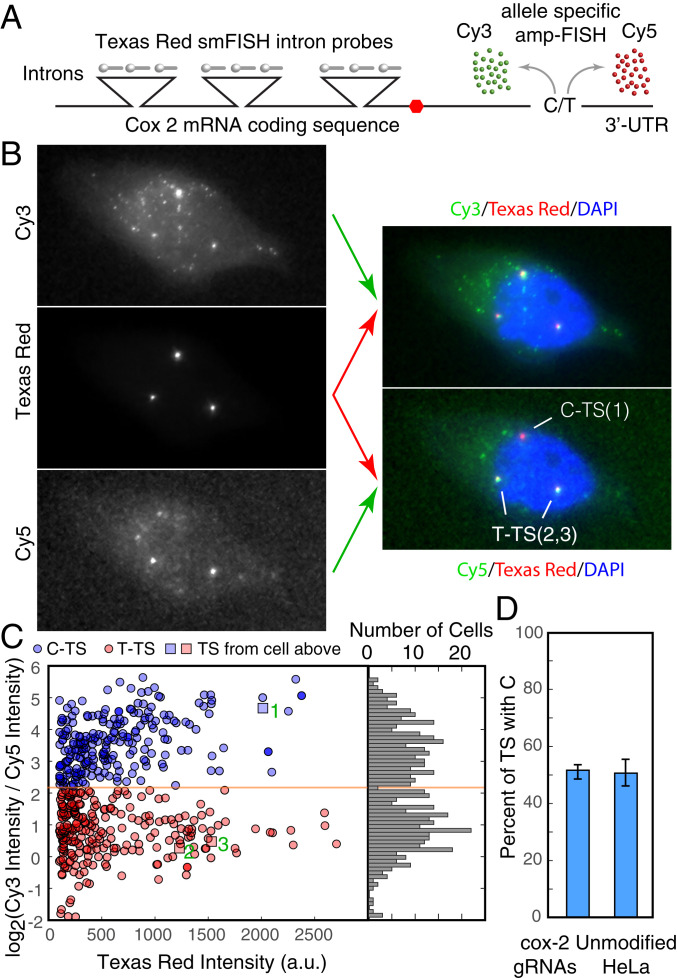
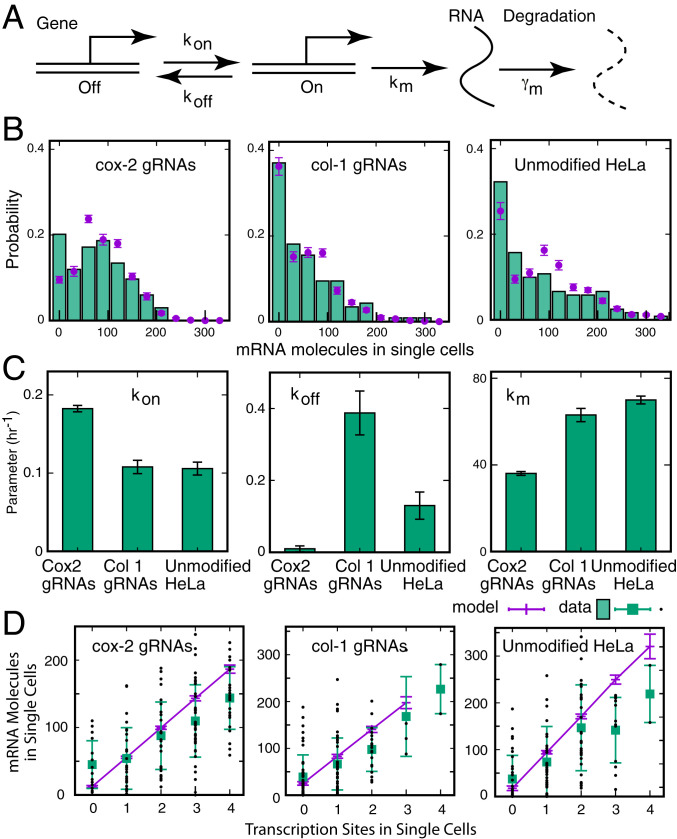
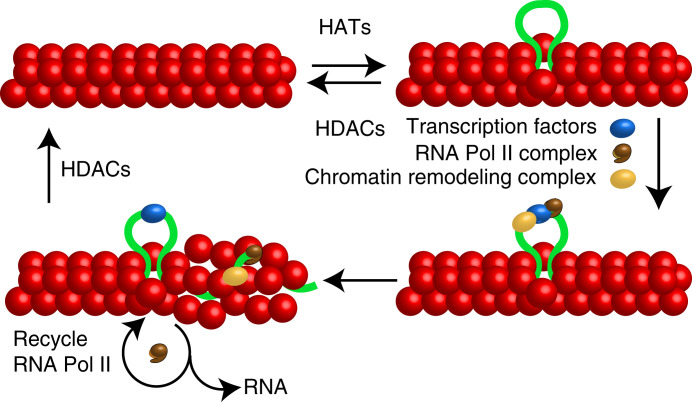
Many eukaryotic genes are expressed in randomly initiated bursts that are punctuated by periods of quiescence. Here, we show that the intermittent access of the promoters to transcription factors through relatively impervious chromatin contributes to this "noisy" transcription. We tethered a nuclease-deficient Cas9 fused to a histone acetyl transferase at the promoters of two endogenous genes in HeLa cells. An assay for transposase-accessible chromatin using sequencing showed that the activity of the histone acetyl transferase altered the chromatin architecture locally without introducing global changes in the nucleus and rendered the targeted promoters constitutively accessible. We measured the gene expression variability from the gene loci by performing single-molecule fluorescence in situ hybridization against mature messenger RNAs (mRNAs) and by imaging nascent mRNA molecules present at active gene loci in single cells. Because of the increased accessibility of the promoter to transcription factors, the transcription from two genes became less noisy, even when the average levels of expression did not change. In addition to providing evidence for chromatin accessibility as a determinant of the noise in gene expression, our study offers a mechanism for controlling gene expression noise which is otherwise unavoidable.

Keywords: single-cell heterogeneity; stochastic mRNA synthesis; transcriptional bursting.


Conflict of interest statement

The authors declare no competing interest.

Figures

Fig. 1.
Fig. 1.
dCas9-mediated tethering of a HAT at the promoter of the cox-2 gene (also known as PTGS2) increases accessibility to the locus and decreases noise in expression from it. (A) Schematic depiction of how the dCas9–HAT fusion construct is attached at the promoter of the cox-2 gene. TSS here refers to the transcription start site, and p300 is the HAT used here. (B) Representative smFISH images of cox-2 mRNA molecules (white) in two cell lines 4 h after serum stimulation. The images are merged z-stacks with DAPI-stained nuclei (blue). (C) Average number of cox-2 mRNA molecules in single cells determined by smFISH 4 h after induction of the gene by the addition of serum. (Left to Right) The data are from cell lines expressing dCas9 and cox-2 gRNAs, unmodified HeLa cells, a dCas9 fused to a catalytically inactive HAT and cox-2 specific gRNAs, dCas9 and col-1 gRNAs, and dCas9 and a scrambled gRNA with no target in the cells. (D) Gene expression noise levels in terms of Fano factors (σ2/μ). Error bars represent the standard deviations (SDs) derived by the bootstrapping of single-cell counts obtained from 102 to 169 cells in a single experiment. The calculated probability (P values) are the probabilities that the observed difference in the mean Fano factor values in the pairs indicated by horizontal brackets can arise by chance. (E) Distribution of cox-2 mRNA counts in indicated clones 4 h after induction. Mean values are indicated by gray bars. (F) Percent recovery of cox-2 promoter DNA after ultralow-input native ChIP using antibodies against lysine 27 of histone 3 and the active form of RNA polymerase II after induction of the cox-2 gene for 4 h. Error bars are the SD of the mean from three biological replicates and P values from a single-tailed t test. (G) ATAC-seq analysis of an accessible region of chromatin at the promoter of the cox-2 locus in the indicated cell lines after serum induction. The reads represent counts per million of total reads in the sample (which ranged from 71 to 84 million) that map at each nucleotide. Measures of ATAC-seq quality are presented in SI Appendix, Fig. S4.
Fig. 2.
Fig. 2.
Impact of tethering a large number of HAT p300 molecules to the col-1 (also known as MMP1) promoter on the noise in gene expression from that locus. (A) The SunTag strategy for attaching 10 copies of p300 fused to a single-chain antibody against peptide GCN4. (B) Average number of col-1 mRNA molecules in single cells determined by smFISH in cells that are steadily growing, serum starved, or stimulated for 4 h by the addition of serum after starvation. The data are from two different cell lines expressing dCas9-GCN410x, ab-p300, and indicated gRNAs. (C) Fano factor determined from single-cell col-1 mRNA counts. Error bars represent the SDs derived by the bootstrapping of single-cell counts obtained from 122 to 163 cells in a single experiment. The P values are the probabilities that the observed difference in the mean Fano factor values in the pairs indicated by horizontal brackets can arise by chance. (D) ATAC-seq analysis of the accessible region of chromatin at the col-1 promoter of the indicated cell lines after serum induction. The reads represent counts per million of total reads in the sample (which ranged from 69 to 84 million) that map at each nucleotide.
Fig. 3.
Fig. 3.
Analysis of the number of transcriptionally active cox-2 gene loci (out of four alleles present in HeLa cells) 4 h after serum induction. (A) Representative images of cox-2 mRNA imaged using exon-specific (red) and intron-specific smFISH (green) probe sets from cell lines expressing dCas9 and cox-2 gRNAs, dCas9 and col-1 gRNAs, and unmodified HeLa cells. The images are color-coded, maximum intensity–merged z-stacks. Intron-specific probes in this case reveal only the nascent mRNAs that are yet to be released from the gene loci, whereas the exon-specific probes reveal both the nascent RNAs at the gene locus and the mature mRNAs dispersed throughout the cell. Algorithmically identified transcription sites are marked by yellow circles. (B) The distribution of the number of active transcription sites from 130 to 140 cells (bars) and their best fits to the binomial distribution considering the four copies of the gene are identical and independent (lines). The probabilities of a gene locus being on and their 95% CI are shown.
Fig. 4.
Fig. 4.
Determination of the likelihood with which two variants of the four cox-2 gene loci are turned on. (A) Schematic for using amp-FISH to distinguish two variants of the cox-2 gene that differ by an SNP in the 3′ untranslated region (UTR ) of the gene. One variant has a C at complementary DNA position 2375, and the other variant has a T at the same position. The Texas Red–labeled intron-specific set of smFISH probes label all cox-2 TSs, whereas allele-specific amp-FISH (35) creates a Cy3 spot if C is present and a Cy5 spot if T is present. (B) Analysis of a cell that has three active transcription sites. (Left) Merged z-stacks in each of the three different channels. (Right) Their color-combined versions. (Top Right) The Texas Red image is depicted in red and the Cy3 image in green, whereas in lower right, the Texas Red image is depicted in red and the Cy5 image in green. The determinations of the sites are indicated. (C) Analysis of 493 TSs from 521 cells using intensity measurements (in arbitrary units [a.u.]) at the TSs from the cell of line dCas9-p300-gcox-2 and from unmodified HeLa cells. The population falls into two groups based on the log2 ratio of the Cy3 intensity/Cy5 intensity at the TSs (histogram on Right). The reason that the yellow line does not fall at 0 on the y-axis is because the discriminatory capacities of the two probes are not equal (SI Appendix, Materials and Methods). The intensities of the three TSs depicted in the cell in B are indicated by numbered squares in the scatter diagram. (D) The likelihood of turning on the C sites in cell line dCas9-p300-gcox-2 is compared to the likelihood of turning on C sites in unmodified HeLa cells.
Fig. 5.
Fig. 5.
Determination of the kinetic steps in transcription using single-cell mRNA measurements and the two-state model. (A) Each of the four copies of the gene can switch randomly between an on state and an off state, with rates kon and koff, producing mRNAs in the on state with rate km. After its synthesis, mRNA decays with the rate of γm, which is assumed to be constant. These parameters were inferred from single-cell data using a maximum likelihood estimation method (SI Appendix). (B) Predictions of the two-state model (purple circles) overlaid on the distribution of cox-2–mRNA molecules in single cells. (C) Estimates of the three kinetic parameters from the model. (D) Relationship between the number of active transcription sites and mRNA copy number in the three cell types and the prediction of the model. The error bars correspond to SDs.
Fig. 6.
Fig. 6.
Schematic depiction of the random chromatin accessibility model for intermittent mRNA synthesis. Chromatin prevents TFs from accessing the regulatory regions of genes. Diffusible chromatin remodelers (HATs, pioneer factors, and HDACs are examples) dynamically decondense and condense chromatin. Occasional exposure of promoters allows gene-specific and general TFs to bind to the gene, which then recruit the RNA polymerase II complex and additional, polymerase-associated, and chromatin-remodeling complexes to the gene locus. The activities of these complexes decondense the gene in a more sustained manner, and RNA polymerase II is recycled repeatedly to produce bursts of mRNA synthesis (the on state). The locus becomes compact again by the stochastic action of chromatin condensing remodelers, and an off state ensues.

References

    1. Raser J. M., O’Shea E. K., Control of stochasticity in eukaryotic gene expression. Science 304, 1811–1814 (2004). - PMC - PubMed
    1. Sanchez A., Golding I., Genetic determinants and cellular constraints in noisy gene expression. Science 342, 1188–1193 (2013). - PMC - PubMed
    1. Little S. C., Tikhonov M., Gregor T., Precise developmental gene expression arises from globally stochastic transcriptional activity. Cell 154, 789–800 (2013). - PMC - PubMed
    1. Padovan-Merhar O., et al. ., Single mammalian cells compensate for differences in cellular volume and DNA copy number through independent global transcriptional mechanisms. Mol. Cell 58, 339–352 (2015). - PMC - PubMed
    1. Bahar Halpern K., et al. ., Bursty gene expression in the intact mammalian liver. Mol. Cell 58, 147–156 (2015). - PMC - PubMed

Publication types