. 2021 Oct 8;11(1):514.
doi: 10.1038/s41398-021-01627-w.

Exercise as a model to identify microRNAs linked to human cognition: a role for microRNA-409 and microRNA-501

Affiliations

Exercise as a model to identify microRNAs linked to human cognition: a role for microRNA-409 and microRNA-501

Maria Goldberg et al. Transl Psychiatry. .

Abstract

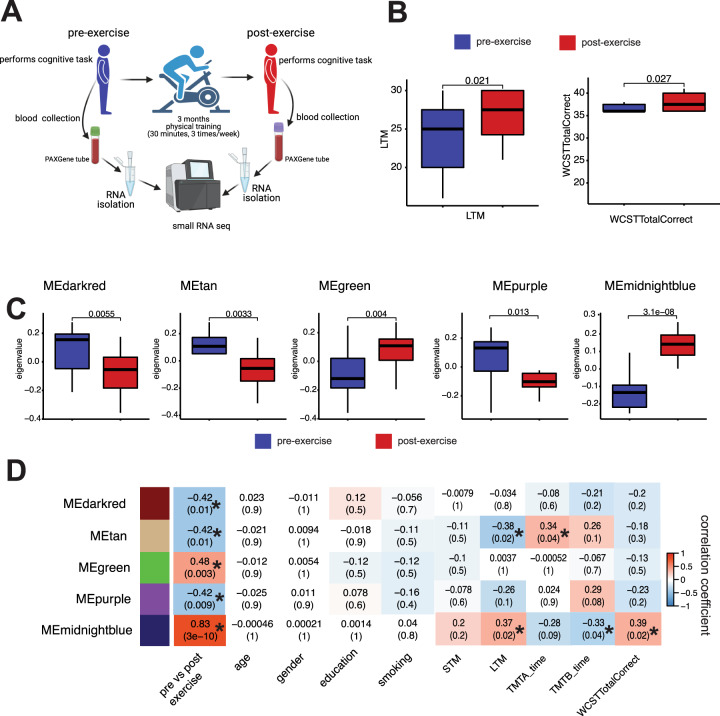
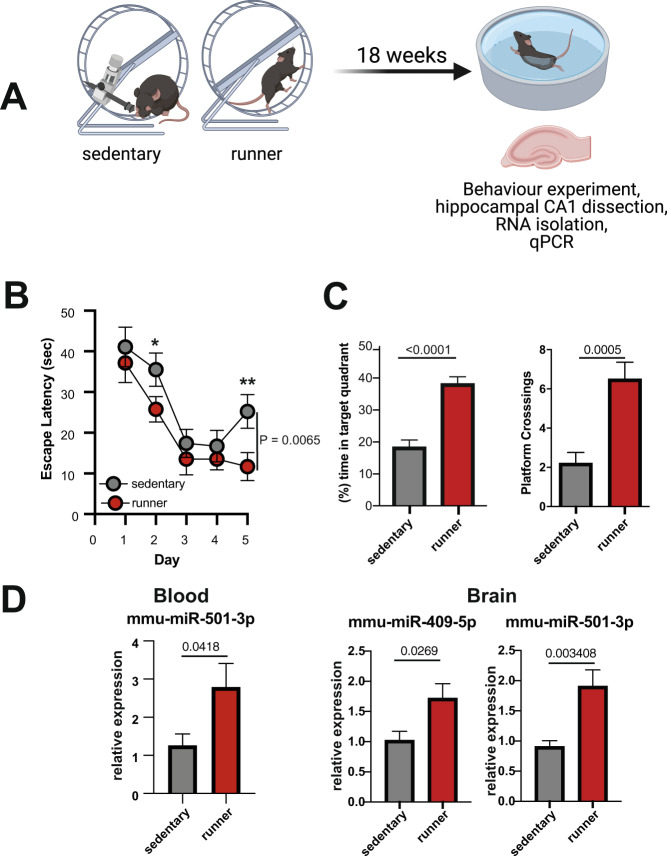
MicroRNAs have been linked to synaptic plasticity and memory function and are emerging as potential biomarkers and therapeutic targets for cognitive diseases. Most of these data stem from the analysis of model systems or postmortem tissue from patients which mainly represents an advanced stage of pathology. Due to the in-accessibility of human brain tissue upon experimental manipulation, it is still challenging to identify microRNAs relevant to human cognition, which is however a key step for future translational studies. Here, we employ exercise as an experimental model for memory enhancement in healthy humans with the aim to identify microRNAs linked to memory function. By analyzing the circulating smallRNAome we find a cluster of 18 microRNAs that are highly correlated to cognition. MicroRNA-409-5p and microRNA-501-3p were the most significantly regulated candidates. Functional analysis revealed that the two microRNAs are important for neuronal integrity, synaptic plasticity, and morphology. In conclusion, we provide a novel approach to identify microRNAs linked to human memory function.


Conflict of interest statement

The authors declare no competing interests.

Figures

Fig. 1
Fig. 1. Circulating miroRNAs are correlated to exercise-mediated cognitive improvement.
A Experimental scheme. Healthy volunteers (n = 19; 14 male and 5 females, 39 ± 10 years of age) participated in 3-month long physical exercise training. Cognitive performance was assessed using various psycho-cognitive tests prior (pre) and after (post) the experiment. Blood was collected at pre and post time points and RNA isolated from total blood was subjected to generate high-quality small RNAome profile. B Left panel: Long-term memory (LMT) measured via the VLMT and performance in the WCST (right panel) as measured by the number of correct choices (TotalCorrect) was significantly increased when comparing pre- vs. post-exercise. C Box plots showing the eigenvalue-expression of five microRNA co-expression modules (ME) that significantly differ when comparing pre- vs. post-exercise. D Heatmap showing a correlation between the eigenvalue-expression of five microRNA co-expression modules from (C) and the clinical traits. Each row represents a ME, each column corresponds to a trait. Each cell shows the corresponding correlation, p values are shown in brackets. The values are color-coded based on direction and degree of correlation. Blue represents negative correlation and red represents positive correlation. *p < 0.05 was considered significant. The horizontal line in the box plot represents the median, the box spans 25 and 75% quantile, and the whiskers represent the smallest and largest values in the 1.5× interquartile range.
Fig. 2
Fig. 2. microRNA-409-5p and microRNA-501-3p are linked to exercise-mediated cognitive improvement.
A MicroRNA network of MEmidnightblue representing the 18 microRNAs and their interconnectivity. B Gene ontology (GO) terms of biological processes regulated by deregulated microRNAs from MEmidnightblue. The analysis was limited to the confirmed microRNA target genes retrieved from miRTarBase database (version 8). Statistically significant GO enrichment terms for those genes were determined (FDR < 0.05, Benjamin–Hochberg corrected) based on the analysis performed using the gene ontology tool (http://geneontology.org/). For relevant GO terms related to brain functions, the significant GO terms were filtered based on the previous curation of GO annotation relevant for dementia research (from Alzheimer’s Disease Association at UCL and Alzheimer’s project at the University of Toronto). Similar GO terms were merged into clusters using GO semantic similarity and the parental GO term was highlighted for visualization. Small squares (thin width) within a large box (thick width) represent sister GO terms that belong to the given parental GO term. Numbers denote the unique parental biological processes. Barplot displays 16 parental GO terms that were statistically significant (p < 0.05, Fisher’s combined test, adjusted with Bonferroni test). The red dot line highlights the significance cut-off. (C). Volcano plot of differentially expressed microRNAs between samples collected before and after exercise. The x-axis shows fold changes in expression (log2), blue represents downregulation, red represents upregulation. The y-axis shows the adjusted p value (−log10) scale for the analyzed microRNAs. Values above the dashed line are considered significantly deregulated with adjusted p value < 0.05. Non-significant microRNAs are depicted in gray color. Each dot represents one single microRNA. D Venn diagram representing common genes between differentially regulated microRNAs when compared pre - vs. post-exercise samples and the microRNAs of MEmidnightblue module. E Expression of microRNA-409-5p and microRNA-501-3p when comparing pre- vs. post-exercise samples. The horizontal line in the box plot represents the median, the box spans 25 and 75% quantile, and the whiskers represent the smallest and largest values in the 1.5× interquartile range. y-Axis represents the normalized read counts. Two-tailed t test, unpaired. F Heatmap showing a correlation between the expression of microRNA-409-5p and microRNA-501-3p in human blood and the clinical traits. G Average expression of microRNA-409-5p and microRNA-501-3p in post-mortem human brain, healthy human blood, mouse hippocampus, and primary hippocampal neurons.
Fig. 3
Fig. 3. Increased expression of microRNA-409-5p and microRNA-501-3p in the hippocampus of mice upon exercise.
A Experimental design. Mice of the experimental group (runners; n = 10) had free access to running wheels for voluntary exercise during a period of 18 weeks. Mice of the control group (n = 10) were housed under similar conditions but the running wheels were blocked (sedentary). After 18 weeks mice were subjected to a water maze-based spatial memory test and subsequently, hippocampal sub-regions were microdissected for molecular analysis. B Escape latency during the 5 days of training. Two-way ANOVA revealed a significant difference amongst groups (P = 0.0065, F = 7.7). Post hoc analysis revealed significant differences when comparing the performance on day 2 and day 5 amongst groups (*P < 0.1, unpaired t test; **P < 0.05, unpaired t test). C Left panel: The time spent in the target quadrant during a probe test performed after 5 days of training was significantly increased (19.86 ± 3.14; mean ± SEM) in the runners-group (n = 10/group, unpaired t test, parametric, two-tailed). Right panel: Similarly, the number of platform crossings during the probe test was significantly higher in the runners-group (n = 10/group, unpaired t test, parametric, two-tailed). D Left panel: Bar graph depicting qPCR results showing increased expression of microRNA-501-3p in blood samples collected from mice before and after completion of the exercise procedure (n = 8/group unpaired t test, parametric, two-tailed). Please note that we could not detect microRNA-409-5p in blood samples from mice. Right panel: Bar graphs showing the qPCR expression of microRNA-409-5p and microRNA-501-3p in the hippocampal CA1 region. MicroRNA levels were increased in the runners-group (n = 9/group, unpaired t test, parametric, two-tailed). Error bars indicate mean ± SEM.
Fig. 4
Fig. 4. Inhibition of microRNA-409-5p and microRNA-501-3p affect gene-expression programs linked to neuronal integrity.
A Experimental design. Primary hippocampal neurons were cultured for 10 days. Cells were then incubated with lipid nanoparticles (LNPs) containing anti-miRs or scramble control RNA for 48 h before RNA was isolated for sequencing. B Bar graphs showing the quantification of microRNA-409-5p and microRNA-501-3p expression by qPCR. n = 6/group, unpaired two-tailed t test. Error bar indicates mean ± SEM. C Volcano plot representing differentially expressed genes upon microRNA-409-5p knockdown. The x-axis displays fold changes (log2), blue represents downregulation, red represents upregulation of genes after anti-microRNA-409-5p treatment. The y-axis shows an adjusted p value (−log10). FDR < 0.05. D Barplot showing comparison of FDR adjusted p value distribution between up- and downregulated genes after silencing of microRNA-409-5p. ****p < 0.0001, Wilcoxon–Mann–Whitney test, two-tailed test, unpaired. Error bar = mean ± SEM. E Percentage of the up-regulated genes overlapped with the genes having predicted microRNA-409-5p binding sites at 3′ UTR, 5′ UTR, coding sequence (CDS) and all three combined (all). Genome-wide predicted microRNA binding sites were retrieved from miRWalk (version 3). F Gene ontology analysis of the deregulated genes. Dots on the left and represent up- and downregulated processes respectively. The size of the dots represents the number of genes belonging to each process. Color intensity represents adjusted p value. G Volcano plot representing differentially expressed genes upon microRNA-501-3p knockdown. H Barplot displays FDR adjusted p value distribution from up- and downregulated genes after microRNA-501-3p knockdown. ****p < 0.0001, Wilcoxon–Mann–Whitney test, two-tailed test, unpaired. Error bar = mean ± SEM. I Percentage of the microRNA-501-3p inhibition induced upregulated genes overlapped with the genes having predicted microRNA binding sites at 3′ UTR, 5′ UTR, coding sequence (CDS), and all three combined (all). Genome-wide predicted microRNA binding sites were retrieved from miRWalk (version 3). J Dot plot representing the deregulated gene ontology biological processes. K Overlap between up-regulated genes from microRNA-409-5p and microRNA-501-3p inhibition experiments. L Hypergeometric overlap of the deregulated genes to those from hypoxia and ER stress responses in neurons. Fisher’s exact test, adjusted p value with Benjamini Hochberg (BH) correction. Color map represents the number of overlapping genes. PHC represents primary hippocampal neurons, BO represents Brain organoids. PHC data were retrieved from [25] and BO data were retrieved from [54].
Fig. 5
Fig. 5. MicroRNA-409-5p and microRNA-501-3p control synaptic morphology and neuronal activity.
A Representative confocal images of dendrites from scramble control and anti-miR treated neurons. B (Left panel) Spine density in anti-miR-409-5p and (Right panel) anti-miR-501-3p treated neurons in comparison to control. Dots represent dendritic segments acquired randomly from images. y-Axis shows the number of total spines per length of a chosen dendritic segment. (Left panel) number of dendritic segments analyzed, control siRNA = 49, anti-miR-409-5p = 41. (Right panel) number of dendritic segments analyzed, control siRNA = 49, anti-miR-501-3p = 48. Unpaired t test, two-tailed. Error bars = mean ± SEM. C Representative merged images of scramble control and anti-miRs treated neurons showing IHC staining for Synaptophysin 1, PSD-95, and MAP2. D Number of synapses in anti-miR-409-5p and anti-miR-501-3p treated neurons compared to those from scramble control-treated neurons. Dots represent individual images acquired randomly from the coverslips. Functional synapses were enumerated based on colocalized signals for PSD95 and Synaptophysin 1. y-Axis shows relative percentage of functional synapse in the treatment group(s) compared to controls. (Left panel) Number of images analyzed (control siRNA = 34, anti-miR-409-5p = 34). (Right panel) Number of images analyzed (control siRNA = 34, anti-miR-501-3p = 33). Unpaired t test, two-tailed. Error bar indicates mean ± SEM. E Primary hippocampal neurons were cultured on a Axion MEA plate and treated with lipid nanoparticles (LNPs) containing anti-miR cocktail of microRNA-409-5p and microRNA-501-3p at DIV 7. Neurons treated with scramble control were treated as controls. At DIV10, spontaneous neuronal activity was recorded at every 3 h for 10 min. The complete recording session lasted for 24 h. Left panel shows representative raw data traces from one electrode from a MEA plate from treatment and control groups (top) and representative low and high magnification images from a neuronal culture grown in one well of the MEA plate. The right panel shows from left to right thrree datasets; the Mean firing rate, the number of bursts and the number of network bursts after treatment with anti-miR-cocktail and scramble controls. n = 54/group, unpaired t test, two-tailed. Error bar indicates mean ± SEM.

References

    1. Gurtan AM, Sharp PA. The role of miRNAs in regulating gene expression networks. J Mol Biol. 2013. Epub ahead of print. - PMC - PubMed
    1. Rao P, Benito E, Fischer A. MicroRNAs as biomarkers for CNS disease. Front Mol Neurosci. 2013;26, eCollection 2013. - PMC - PubMed
    1. Rajman M, Schratt G. MicroRNAs in neural development: from master regulators to fine-tuners. Development. 2017;44:2310–2322. doi: 10.1242/dev.144337. - DOI - PubMed
    1. Salta E, De Strooper B. Noncoding RNAs in neurodegeneration. Nat Rev Neurosci. 2017;18:627–640. doi: 10.1038/nrn.2017.90. - DOI - PubMed
    1. Galimberti D, Villa C, Fenoglio C, Serpente M, Ghezzi L, Cioffi SM, et al. Circulating miRNAs as potential biomarkers in Alzheimer’s disease. J Alzheimers Dis. 2014;42:1261–1267. doi: 10.3233/JAD-140756. - DOI - PubMed

Publication types