. 2021 Oct 8;12(1):5827.
doi: 10.1038/s41467-021-26033-0.

Stage-resolved Hi-C analyses reveal meiotic chromosome organizational features influencing homolog alignment

Affiliations

Stage-resolved Hi-C analyses reveal meiotic chromosome organizational features influencing homolog alignment

Wu Zuo et al. Nat Commun. .

Abstract

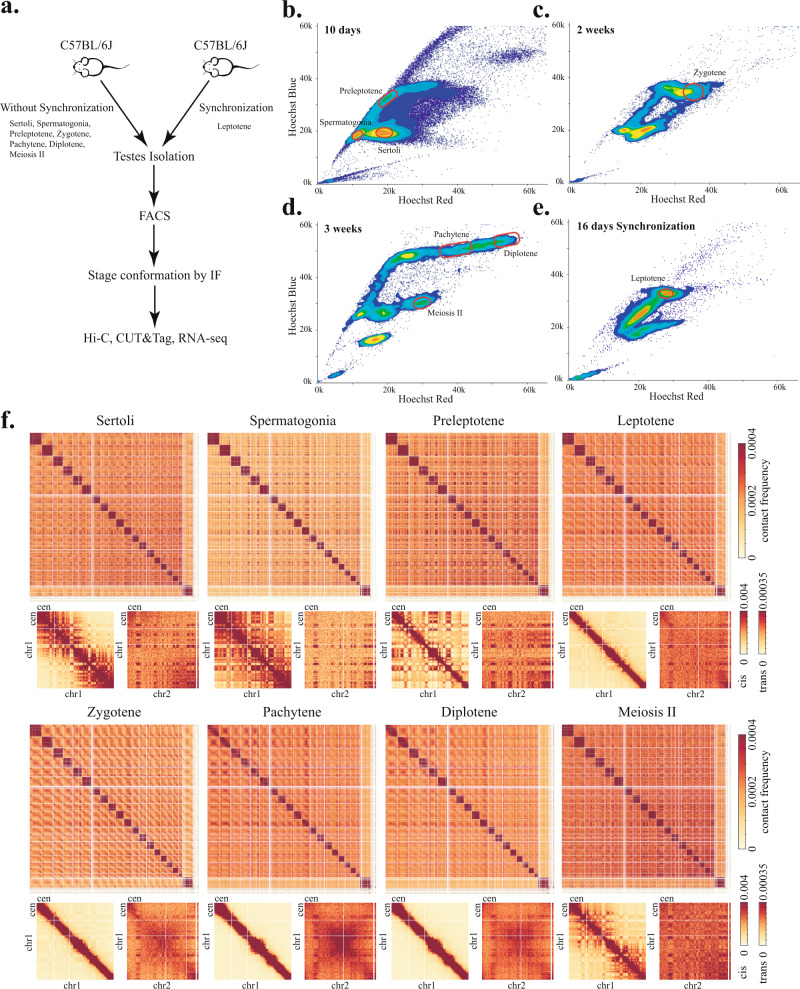
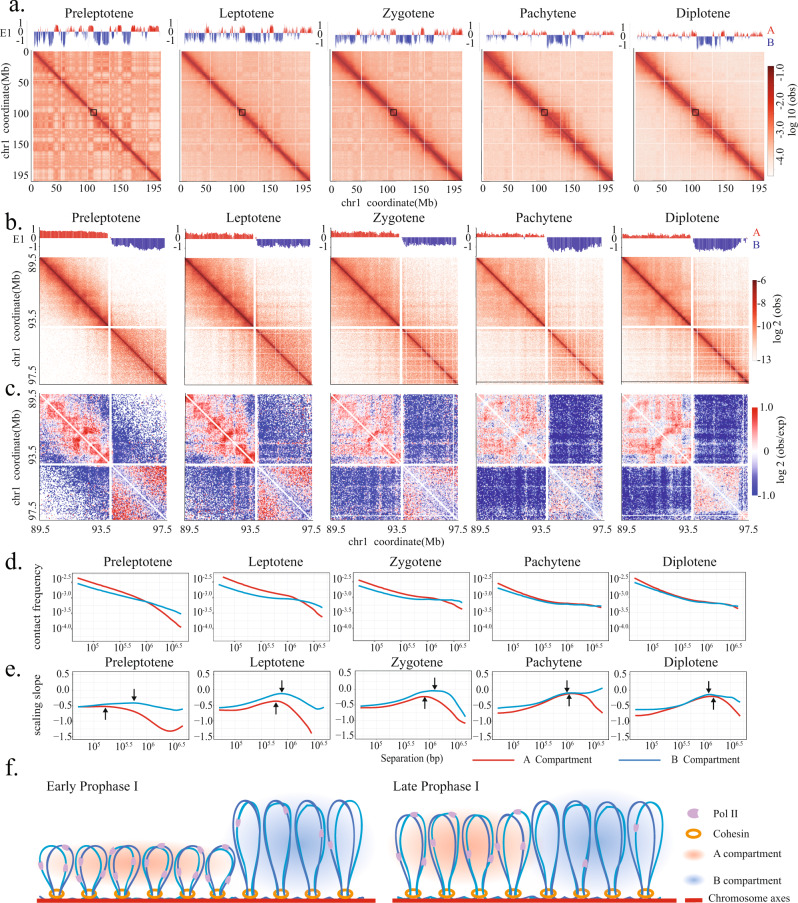
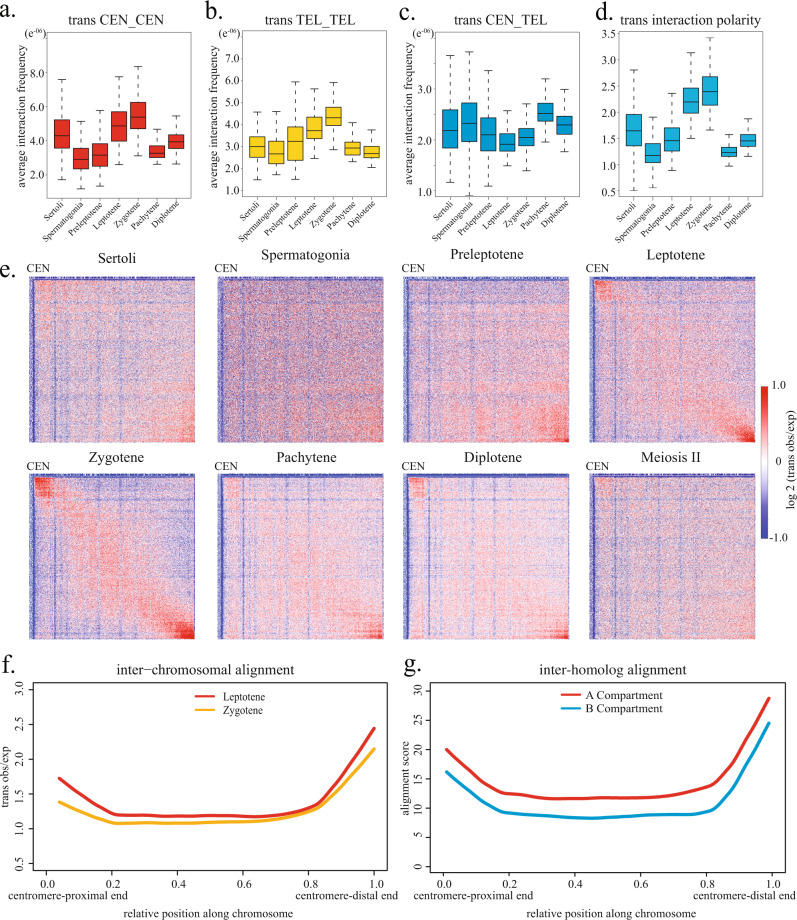
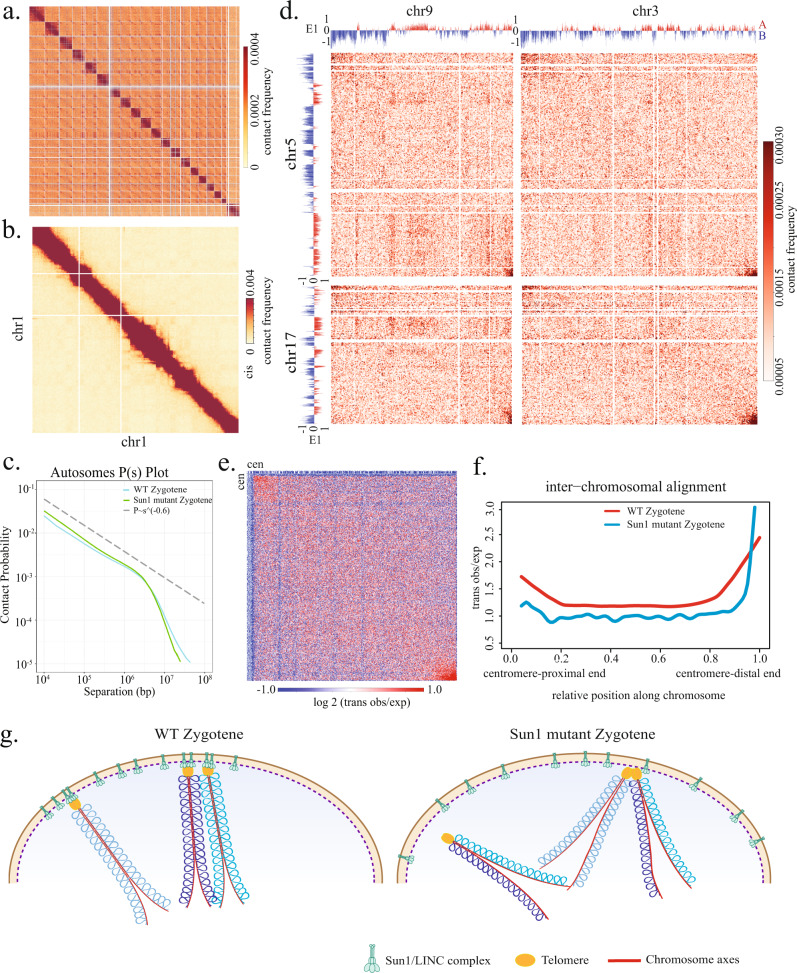
During meiosis, chromosomes exhibit dramatic changes in morphology and intranuclear positioning. How these changes influence homolog pairing, alignment, and recombination remain elusive. Using Hi-C, we systematically mapped 3D genome architecture throughout all meiotic prophase substages during mouse spermatogenesis. Our data uncover two major chromosome organizational features varying along the chromosome axis during early meiotic prophase, when homolog alignment occurs. First, transcriptionally active and inactive genomic regions form alternating domains consisting of shorter and longer chromatin loops, respectively. Second, the force-transmitting LINC complex promotes the alignment of ends of different chromosomes over a range of up to 20% of chromosome length. Both features correlate with the pattern of homolog interactions and the distribution of recombination events. Collectively, our data reveal the influences of transcription and force on meiotic chromosome structure and suggest chromosome organization may provide an infrastructure for the modulation of meiotic recombination in higher eukaryotes.


Conflict of interest statement

The authors declare no competing interests.

Figures

Fig. 1
Fig. 1. Mapping 3D genome architecture through mouse spermatogenesis by Hi-C.
a Experimental workflow for isolating somatic cells and spermatocytes of different stages. be Representative Hoechst profiles show the separation of different cell types by fluorescence intensity in mice of different ages: 10-day-old mice for isolating Sertoli, spermatogonia, and preleptotene cells (b), 2-week-old mice for zygotene cells (c), 3-week-old mice for pachytene, diplotene, and meiosis II cells (d), 16 days synchronized mice for isolation of leptotene cells (e). Red circles in each profile indicate gating windows used for cell isolation. f Genome-wide Hi-C interaction heatmaps binned at 1 Mb resolution show dynamic reorganization of 3D genome architecture during meiosis. Enlarged Chr1 and Chr1–Chr2 trans interaction heatmaps at 1 Mb resolution are shown below the genome-wide heatmaps. Cen indicates the centromere ends of chromosomes.
Fig. 2
Fig. 2. Progressive changes of chromatin loops during meiotic prophase I.
a, b P(s) curves indicate relationships between chromatin contact probability and genomic distances for chromatin interactions on autosomes in different cell types. Dotted lines corresponding to P(s) ~ s−0.6 and P(s) ~ s−1.2 are shown as references. Somatic and meiotic cells exhibit different power-law scaling behavior. c, d Slopes of P(s) curves at different genomic distances are used to infer the average chromatin loop size. Arrows indicate the average chromatin loop size in each meiotic prophase I substage. Chromatin loop sizes progressively increase from leptotene to diplotene stage. e ChIP-Seq profiles show CTCF and REC8 peaks and distribution during pachytene/diplotene stage in a representative genomic region. Bars underneath the ChIP-Seq tracks indicate locations of peaks called using MACS2. ChIP-Seq data analyzed in eg are from Vara et al.. f Venn diagram depicts the overlap between CTCF and REC8 peaks in pachytene/diplotene stage. g Boxplots indicate the distribution of ChIP-Seq peak signals for CTCF/REC8 co-occupied peaks versus REC8-only peaks in pachytene stage. The upper and lower bounds of boxes represent the third and the first quartiles of peak signal values, respectively. Centre bars represent the median peak values. The upper whisker extends from the hinge to the largest value no further than 1.5× IQR (inter-quartile range) from the hinge, and the lower whisker from the hinge to the lowest value within 1.5 × IQR of the hinge. The values beyond the whiskers are not shown in the boxplots. n number of REC8 ChIP-Seq peaks (n = 6130 for CTCF/REC8 co-occupied peaks and n = 13,561 for REC8-only peaks). p = 3.0 × 10−290, two-sided t test with the confidence level of the interval at 0.95. h Pileups of interactions between the 6118 CTCF/REC8 co-occupied sites and their surrounding regions within 500 kb. Bin size, 10 kb. Red arrows in pachytene and diplotene pileups indicate the cross-shaped patterns with the width of a single 10 kb bin, which represent the contacts between one CTCF/REC8 co-occupied site and one non-peak site. i The cartoons present a simplified view of how the chromatin loop extension is likely to occur during meiosis. In interphase cells, CTCF anchors the bases of loop domains. In preleptotene, REC8 starts to load onto chromosomes and the CTCF-anchored loops dissociate, though CTCF remain largely bound to the chromosomes. In leptotene/zygotene and pachytene/diplotene, cohesin-driven loop extrusion leads to the progressive increase of loop sizes. The REC8-binding sites do not constitute strong barriers for loop extension and can be skipped. Therefore, unlike in interphase, the meiotic chromatin loops are heterogeneously distributed and not anchored at fixed positions. Note that the binding of CTCF and REC8 depicted in these illustrations reflects the population-averaged protein occupancy, not individual binding events in single cells.
Fig. 3
Fig. 3. DSB hotspots exhibit distinct chromatin organization during meiosis prophase I.
a Pileup heatmaps of 2 Mb genomic regions centered at CO-DSBs (top row), NCO-DSBs (middle row), and non-DSB sites (bottom row) in different cell types. Red arrows indicate the cross-shaped pattern extending from the CO-DSBs in preleptotene and leptotene. The observed Hi-C interaction frequencies are normalized using expected interaction frequencies at each genomic distance (Obs/Exp). Bin size, 10 kb. b Box plots compare the total balanced Hi-C interactions in 2 Mb genomic regions centered at CO-DSBs (red), NCO-DSBs (orange), and non-DSB sites (blue) in different stages. c Box plots compare the total balanced Hi-C interactions between the single 10 kb genomic bins containing the CO-DSBs (red), NCO-DSBs (orange), and non-DSB sites (blue) and the 1 Mb flanking regions on each side in different stages (i.e., the total signals along the center line in the Hi-C heatmap for each 2 Mb genomic region in b). For boxplots in b, c, center line, median; box limits, upper and lower quartiles; whiskers, 1.5× interquartile range. The values beyond the whiskers are not shown in the boxplots. p values indicated in b, c are calculated from one-tailed Mann–Whitney U test. n, total number of the 10 kb bins containing CO-DSBs (n = 1089), NCO-DSBs (n = 9738), and non-DSB (n = 12492) sites.
Fig. 4
Fig. 4. Transcription-coupled variations in chromatin loop organization during early meiotic prophase.
a Chr1 heatmaps binned at 50 kb resolution show attenuation of compartmentalization during meiotic prophase I. Plots of eigenvector 1 values on top of heatmaps indicate positions of A (red) and B (blue) compartments. The compartment identity is largely preserved throughout meiotic prophase I. Arrowheads indicate segments of thickened signals along diagonals, which coincide with A compartment. Close-up views of boxed regions are shown in b, c. b, c Heatmaps of observed interaction frequency (b) and observed/expected interaction ratio (c) at 20 kb resolution for a representative Chr1 region. In preleptotene, leptotene, and zygotene stages, the A and B compartment regions enrich for interactions at shorter and higher genomic separation, respectively. d P(s) plots show relationships between chromatin contact frequency and genomic separation for A (red) and B (blue) compartment regions during different meiotic stages. Only A and B compartment regions >2 Mb were included in this analysis. e Plots of P(s) slopes show chromatin loop sizes for A and B compartment regions in each meiotic prophase I substage. Arrows indicate the peak positions in P(s) slope curves, which correspond to the average loop sizes. The A compartment regions consist of smaller loops than the B compartment regions in preleptotene, leptotene, and zygotene stages. f Schematic illustrations show that the transcriptionally active and inactive regions exhibit different chromatin loop sizes during early meiotic prophase I. The differences become less pronounced in late meiotic prophase I.
Fig. 5
Fig. 5. Variations in intra-chromosomal loop organization correlate with homolog alignment and crossover distribution.
a Z-stage inter-homolog interaction heatmap at 50 kb resolution for the same region shown in Fig. 4b, c. The inter-homolog interaction data are from Patel et al.. b Boxplots quantify distributions of inter-homolog alignment scores for 50 kb genomic intervals belonging to A (red) or B (blue) compartment. n, total number of 50 kb intervals for A (n = 17,688) and B (n = 27,016). p value is calculated from two-tailed Mann–Whitney U test. c The A compartment regions >1 Mb are ranked based on the averaged interaction frequencies at 500 kb and divided into three groups (A1, A2, A3). Boxplots depict distributions of inter-homolog alignment scores for 50 kb genomic intervals belonging to A1 (red), A2 (orange), A3 (orange), or B (blue) compartment. n, total number of 50 kb intervals for each category (A1, n = 2376; A2, n = 3948; A3, n = 6327; B, n = 20,090). p values are calculated from two-tailed Mann–Whitney U test. dh Boxplots quantify distributions of DSBs, COs, and the CO/DSB ratios in A1, A2, A3, and B compartment regions >1 Mb. The positions of DSBs and COs are from Davies et al., Smagulova et al., and Hinch et al.. d, e A1 regions do not exhibit significantly higher DSB density than A2 and A3 regions. f A1 regions do not exhibit significantly higher crossover densities than A2 and A3 regions. g, h A1 regions exhibit significantly higher crossover/DSB ratio than the A2 regions. n, total number of A1 (n = 76), A2 (n = 73), A3 (n = 74), and B (n = 377) regions. p values in dh are calculated from one-tailed Mann–Whitney U test. For boxplots in bh, center line, median; box limits, upper and lower quartiles; whiskers, 1.5× interquartile range. The values beyond the whiskers are not shown in the boxplots.
Fig. 6
Fig. 6. Extensive alignment of chromosome ends during early meiotic prophase.
ac Boxplots quantify interactions among the 5 Mb sub-telomeric regions on different chromosomes. Each box shows the distribution of average interaction frequency per genomic 50-kb bin in sub-telomeric regions for 171 pairwise combinations of autosomes. Leptotene and zygotene stages exhibit the highest interactions between sub-telomeric regions at the centromere-proximal ends of different chromosomes (CEN-CEN, a) and between the centromere-distal ends of different chromosomes (TEL-TEL, b), but the lowest interactions between sub-telomeric regions at different chromosome ends (CEN-TEL, c). Box limits, upper and lower quartiles. Centre bars, median. Whiskers, 1.5× interquartile range. d Boxplots quantify the polarity of interactions among the sub-telomeric regions by calculating (CEN-CEN + TEL-TEL)/(2 × CEN-TEL) for each of 171 pairwise combinations of autosomes. Leptotene and zygotene stages exhibit the highest polarity. For all boxplots in ad, n = 171 pairwise combinations of autosomes. e Averaged trans observed/expected heatmaps of all 171 pairwise combinations of autosomes. Interpolation was performed to normalize for different chromosome lengths. Matrices were scaled to 500 bins × 500 bins. f Plots quantifying the signals along the diagonals of the heatmaps in e indicate the extent of inter-chromosomal alignment along chromosomes. Regions of ~20% chromosome length from either chromosome end exhibit prominent inter-chromosomal alignment in leptotene and zygotene stages. g Plots quantify zygotene-stage inter-homolog alignment scores versus chromosome position for A and B compartment regions. Inter-homolog alignment patterns are similar to the inter-chromosomal alignment patterns in f.
Fig. 7
Fig. 7. Telomere–LINC complex association is required for chromosome end alignment over a substantial range.
a Genome-wide Hi-C interaction heatmaps binned at 1 Mb resolution for Sun1W151R/W151R mutant zygotene spermatocytes. b Chr1 interaction heatmaps binned at 1 Mb resolution for Sun1W151R/W151R mutant zygotene spermatocytes. c P(s) curve of Sun1W151R/W151R mutant zygotene spermatocytes exhibits a similar shape to wild-type zygotene spermatocytes. d Interaction heatmaps at 500 kb resolution showing trans observed interaction frequencies among chromosomes 3, 5, 9, and 17. Different chromosomes only exhibit association at the very tips of chromosomes. e Averaged trans observed/expected heatmaps of 171 pairwise combinations of autosomes in Sun1W151R/W151R mutant zygotene spermatocytes. f Plots compare signals along the diagonals of the averaged trans heatmaps for wild-type and Sun1W151R/W151R mutant zygotene spermatocytes. The inter-chromosomal alignment profile abruptly drops off at the telomere-distal end. g Cartoons illustrate the effects of telomere association with the force-transmitting LINC complex on the alignment of chromosome ends.

References

    1. Page SL. Chromosome choreography: the meiotic ballet. Science. 2003;301:785–789. doi: 10.1126/science.1086605. - DOI - PubMed
    1. Handel MA, Schimenti JC. Genetics of mammalian meiosis: regulation, dynamics and impact on fertility. Nat. Rev. Genet. 2010;11:124–136. doi: 10.1038/nrg2723. - DOI - PubMed
    1. Keeney S, Lange J, Mohibullah N. Self-organization of meiotic recombination initiation: general principles and molecular pathways. Annu. Rev. Genet. 2014;48:187–214. doi: 10.1146/annurev-genet-120213-092304. - DOI - PMC - PubMed
    1. Zickler D, Kleckner N. Meiotic chromosomes: integrating structure and function. Annu. Rev. Genet. 1999;33:603–754. doi: 10.1146/annurev.genet.33.1.603. - DOI - PubMed
    1. Gerton, J. L. & Hawley, R. S. Homologous chromosome interactions in meiosis: diversity amidst conservation. Nat. Rev. Genet. 10.1038/nrg1614 (2005). - PubMed

Publication types