

Detecting Selection in Multiple Populations by Modeling Ancestral Admixture Components
- PMID: 34626111
- PMCID: PMC8763095
- DOI: 10.1093/molbev/msab294
Detecting Selection in Multiple Populations by Modeling Ancestral Admixture Components
Abstract
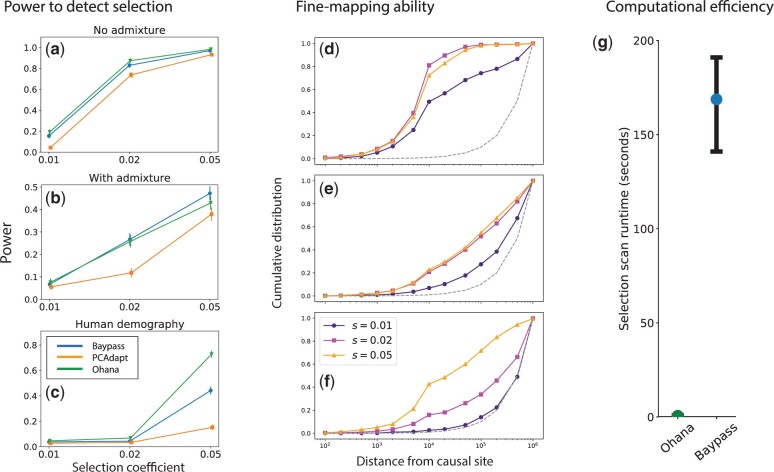
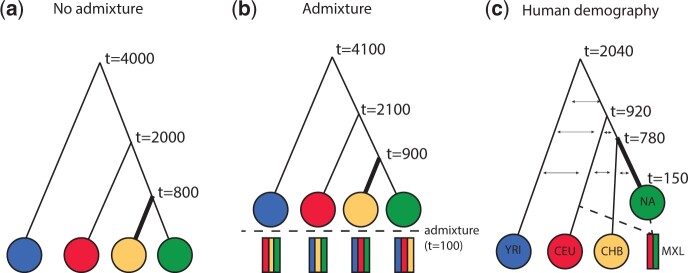
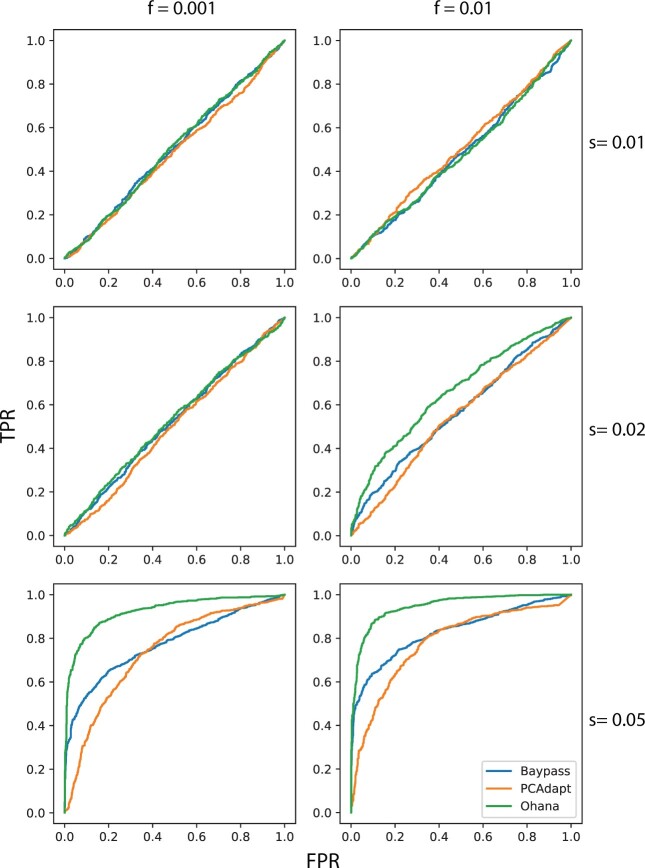
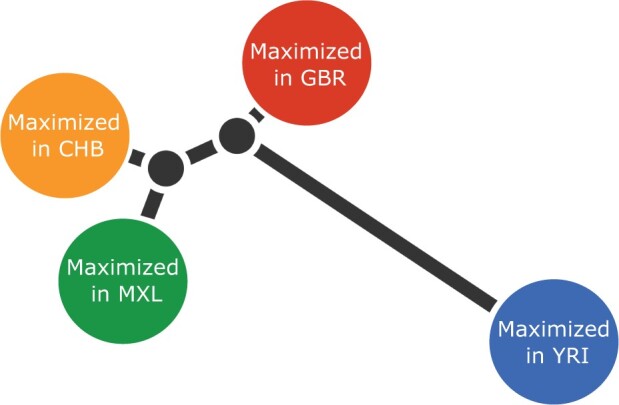
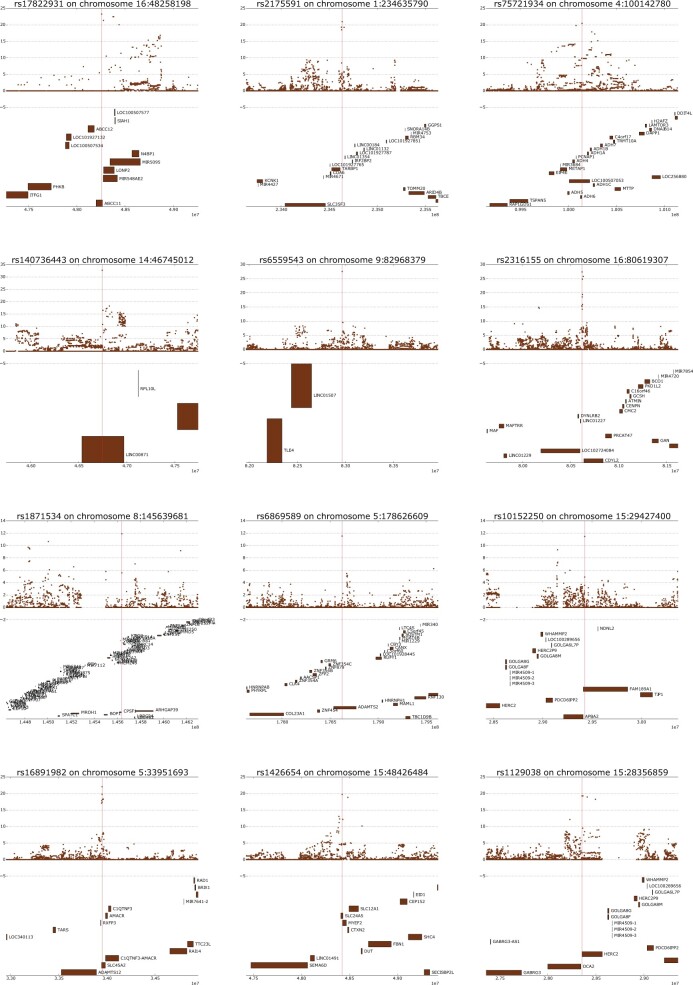
One of the most powerful and commonly used approaches for detecting local adaptation in the genome is the identification of extreme allele frequency differences between populations. In this article, we present a new maximum likelihood method for finding regions under positive selection. It is based on a Gaussian approximation to allele frequency changes and it incorporates admixture between populations. The method can analyze multiple populations simultaneously and retains power to detect selection signatures specific to ancestry components that are not representative of any extant populations. Using simulated data, we compare our method to related approaches, and show that it is orders of magnitude faster than the state-of-the-art, while retaining similar or higher power for most simulation scenarios. We also apply it to human genomic data and identify loci with extreme genetic differentiation between major geographic groups. Many of the genes identified are previously known selected loci relating to hair pigmentation and morphology, skin, and eye pigmentation. We also identify new candidate regions, including various selected loci in the Native American component of admixed Mexican-Americans. These involve diverse biological functions, such as immunity, fat distribution, food intake, vision, and hair development.
Keywords: admixture; human evolution; population structure; positive selection; selective sweeps.
© The Author(s) 2021. Published by Oxford University Press on behalf of the Society for Molecular Biology and Evolution.
Figures
Similar articles
-
Identifying outlier loci in admixed and in continuous populations using ancestral population differentiation statistics.Mol Ecol. 2016 Oct;25(20):5029-5042. doi: 10.1111/mec.13822. Epub 2016 Sep 14. Mol Ecol. 2016. PMID: 27565448
-
Disentangling Signatures of Selection Before and After European Colonization in Latin Americans.Mol Biol Evol. 2022 Apr 11;39(4):msac076. doi: 10.1093/molbev/msac076. Mol Biol Evol. 2022. PMID: 35460423 Free PMC article.
-
MI-MAAP: marker informativeness for multi-ancestry admixed populations.BMC Bioinformatics. 2020 Apr 3;21(1):131. doi: 10.1186/s12859-020-3462-5. BMC Bioinformatics. 2020. PMID: 32245404 Free PMC article.
-
Machine-Learning Prospects for Detecting Selection Signatures Using Population Genomics Data.J Comput Biol. 2022 Sep;29(9):943-960. doi: 10.1089/cmb.2021.0447. Epub 2022 May 30. J Comput Biol. 2022. PMID: 35639362 Review.
-
Signatures of positive selection: from selective sweeps at individual loci to subtle allele frequency changes in polygenic adaptation.Mol Ecol. 2016 Jan;25(1):79-88. doi: 10.1111/mec.13288. Epub 2015 Jul 27. Mol Ecol. 2016. PMID: 26108992 Review.
Cited by
-
Genetic characterization of a captive marmoset (Callithrix jacchus) colony using genotype-by-sequencing.Am J Primatol. 2024 Jul;86(7):e23630. doi: 10.1002/ajp.23630. Epub 2024 Apr 24. Am J Primatol. 2024. PMID: 38655843 Free PMC article.
-
The Legacy of Infectious Disease Exposure on the Genomic Diversity of Indigenous Southern Mexicans.Genome Biol Evol. 2023 Mar 3;15(3):evad015. doi: 10.1093/gbe/evad015. Genome Biol Evol. 2023. PMID: 36726304 Free PMC article.
-
Genome-Wide Selection Scan in an Arabian Peninsula Population Identifies a TNKS Haplotype Linked to Metabolic Traits and Hypertension.Genome Biol Evol. 2020 Mar 1;12(3):77-87. doi: 10.1093/gbe/evaa033. Genome Biol Evol. 2020. PMID: 32068798 Free PMC article.
-
Genomic Anomaly Detection with Functional Data Analysis.Genes (Basel). 2025 Jun 15;16(6):710. doi: 10.3390/genes16060710. Genes (Basel). 2025. PMID: 40565602 Free PMC article.
-
Postadmixture Selection on Chileans Targets Haplotype Involved in Pigmentation, Thermogenesis and Immune Defense against Pathogens.Genome Biol Evol. 2020 Aug 1;12(8):1459-1470. doi: 10.1093/gbe/evaa136. Genome Biol Evol. 2020. PMID: 32614437 Free PMC article.
References
-
- Beaumont MA, Balding DJ.. 2004. Identifying adaptive genetic divergence among populations from genome scans. Mol Ecol. 13(4):969–980. - PubMed
