. 2022 Mar;70(3):430-450.
doi: 10.1002/glia.24100. Epub 2021 Oct 9.

Blocking Kallikrein 6 promotes developmental myelination

Affiliations

Blocking Kallikrein 6 promotes developmental myelination

Hyesook Yoon et al. Glia. 2022 Mar.

Abstract

Kallikrein related peptidase 6 (Klk6) is a secreted serine protease highly expressed in oligodendrocytes and implicated in demyelinating conditions. To gain insights into the significance of Klk6 to oligodendrocyte biology, we investigated the impact of global Klk6 gene knockout on CNS developmental myelination using the spinal cord of male and female mice as a model. Results demonstrate that constitutive loss of Klk6 expression accelerates oligodendrocyte differentiation developmentally, including increases in the expression of myelin proteins such as MBP, PLP and CNPase, in the number of CC-1+ mature oligodendrocytes, and myelin thickness by the end of the first postnatal week. Co-ordinate elevations in the pro-myelinating signaling pathways ERK and AKT, expression of fatty acid 2-hydroxylase, and myelin regulatory transcription factor were also observed in the spinal cord of 7d Klk6 knockouts. LC/MS/MS quantification of spinal cord lipids showed sphingosine and sphingomyelins to be elevated in Klk6 knockouts at the peak of myelination. Oligodendrocyte progenitor cells (OPCs)-derived from Klk6 knockouts, or wild type OPCs-treated with a Klk6 inhibitor (DFKZ-251), also showed increased MBP and PLP. Moreover, inhibition of Klk6 in OPC cultures enhanced brain derived neurotrophic factor-driven differentiation. Altogether, these findings suggest that oligodendrocyte-derived Klk6 may operate as an autocrine or paracrine rheostat, or brake, on pro-myelinating signaling serving to regulate myelin homeostasis developmentally and in the adult. These findings document for the first time that inhibition of Klk6 globally, or specifically in oligodendrocyte progenitors, is a strategy to increase early stages of oligodendrocyte differentiation and myelin production in the CNS.

Keywords: brain derived neurotrophic factor; lipid; oligodendrocyte; spinal cord.


Conflict of interest statement

Competing Financial Interests: The authors declare no competing interests.

Figures

Figure 1.
Figure 1.. Klk6 gene knockout results in accelerated expression of myelin and lipid synthesis genes.
(a) Histogram shows developmental time course of Klk6 RNA expression detected by real time PCR in the murine spinal cord which is very low at birth and reaches a peak at P21. (b) Photomicrographs show in situ hybridization for Klk6 RNA in the spinal cord of Klk6+/+ and Klk6−/− mice (arrows point to a selection of Klk6-expressing cells, sections were counterstained with hematoxylin). Klk6 RNA expression was not detected (ND) in Klk6−/− knockouts. (c-i) Histograms show expression of myelin-associated (Mbp, Plp, Olig2, Myrf, CNPase) and lipid-related (Fa2h and Ugt8a) genes in the spinal cord of Klk6+/+ and Klk6−/− mice from P0 to P90, with higher levels in knockouts by P7 (P ≤ 0.001, n = 3, male and female mice per time point). Statistical evaluations in c-i were done by one-way ANOVA followed by NK post hoc test. Asterisks represent significant differences with *P < 0.05; **P < 0.01; ***P ≤ 0.001. Scale bar in (a) indicates 100 μm.
Figure 2
Figure 2. Klk6 gene knockout results in accelerated oligodendrocyte maturation.
Histograms and associated photomicrographs (a-d) show counts of Olig2+ and CC-1 positive oligodendrocytes in the spinal cord dorsal columns (a, b) or in the ventrolateral white matter (c, d) from P0 to P90. Counts of oligodendrocytes positive for CC-1, a marker of mature oligodendrocytes, were greater at P7 in Klk6−/− compared to Klk6+/+. After P7, numbers of Olig2 and CC-1 positive oligodendrocytes trended to being reduced in Klk6-/−. (*P < 0.05; **P < 0.01; ***P ≤ 0.001, n = 3–4, male and female mice per time point). Statistical evaluations in c-d were accomplished by One-way ANOVA followed by NK post hoc test. Scale bars indicate 50 μm.
Figure 3
Figure 3. Accelerated developmental expression of myelin basic protein in the spinal cord of Klk6 gene knockout mice.
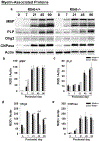
Western blots of whole spinal cord homogenates and associated histograms (a-e) illustrate that mice lacking Klk6 show significant increases in MBP at P7. No significant differences in PLP or CNPase were observed, but levels of Olig2 were reduced by P21 and at P90. (*P < 0.05; **P < 0.01; ***P ≤ 0.001, n = 3, male and female mice). Statistical evaluations in a-e were done by one-way ANOVA followed by NK post hoc test.
Figure 4
Figure 4. Accelerated developmental AKT and ERK1/2 signaling in the spinal cord of Klk6 gene knockout mice.
Western blots of whole spinal cord homogenates and associated histograms (a-g) illustrate that Klk6 gene knockout mice show significant increases in AKT and ERK1/2 signaling at P7, with overall ERK1/2 signaling reduced by P90. (*P < 0.05; **P < 0.01; ***P ≤ 0.001, n = 3, male and female mice). Statistical evaluations in b-g were done by one-way ANOVA followed by NK post hoc test.
Figure 5.
Figure 5.. Klk6 gene knockout results in increases in myelin thickness in the P7 spinal cord.
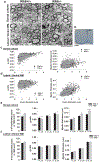
(a) Representative electron micrographs taken from the spinal cord dorsal columns or ventral lateral white matter of P7 Klk6+/+ or Klk6−/− mice (areas sampled are boxed in (b)). Micrographs were used to enumerate the number of myelinated axons and to calculate g-ratios and myelin thickness. G-ratios are plotted relative to axon diameter at P7 (c and d). Histograms show the mean g-ratios and myelin thickness for axons across a range of diameters (e and f). In dorsal column white matter (e), mean g-ratios across all axons were significantly lower in Klk6−/− mice compared with Klk6+/+ (< 1 μm, P = 0.02, 1–2 μm, P = 0.046 and 2–3 μm, P = 0.03). Mean myelin thickness was significantly greater in Klk6−/− in association with axon diameters < 1 μm (1–2 μm, P = 0.05 and 2–3 μm, P < 0.001). (f) The number of myelinated axons was not significantly increased in mice lacking Klk6. P < 0.05; **P < 0.01; ***P ≤ 0.001). Statistical evaluations were done by two-way ANOVA followed by NK post hoc test or Student’s t-test, n = 3 female and 4 male mice per genotype. Scale bars in a indicate 5 μm.
Figure 6
Figure 6. Overview of primary CNS lipid synthesis intermediates and experimental procedure for quantification of lipid species.
(a) Schematic shows sequential lipid species in the synthesis pathways, starting with addition of a fatty acid side chain (“R”) to a sphingosine backbone to form ceramides. Ceramides can be modified by addition of choline phosphate, galactose, and glucose head groups to form the major classes of sphingomyelins, sulfatides, and gangliosides, respectively. (b) Lipids in whole spinal cord or in purified myelin were quantified by LC-MS/MS (see Tables 2 and 3). (c) Cartoon shows key lipid and protein constituents of the myelin membrane, with galactosylceramides and sulfatides found almost exclusively on the extracellular membrane layer and frequently forming lipid raft microdomains along with cholesterol in which key structural proteins, including PLP, are clustered (Dyer and Benjamins 1989).
Figure 7
Figure 7. Oligodendrocyte progenitors with Klk6 gene knockout express higher levels of PLP at early stages of differentiation in vitro.
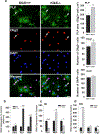
(a) Photomicrographs and associated histograms demonstrate Klk6−/− OPC cultures show greater PLP area /Olig2+ cells and greater numbers of Olig2+ cells after a 72 h period of differentiation. (b) Histogram shows real time PCR quantification of Klk6, Plp and Mbp RNA expression in wild type primary OPCs at 0 and 72 h after switching to oligodendrocyte differentiation media. The expected large increases in Plp and Mbp were observed in addition to smaller increases in Klk6 RNA expression, over the same period. (c, d) Histograms show expression of Plp, Mbp and Olig2 in OPCs differentiated in vitro for 0 or 72 h, with significantly higher levels of Plp and Mbp and lower Olig2 in Klk6−/− OPCs at 72 h compared to Klk6+/+. Statistical evaluation was done by Student’s t test. Asterisks represent significant differences with *P < 0.05; **P < 0.01; ***P ≤ 0.001. Scale bar indicates 20 μm.
Figure 8
Figure 8. Pharmacologic inhibition of Klk6 increases MBP expression by oligodendrocyte progenitors in vitro.
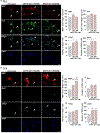
Fluorescent images and associated histograms show changes in expression of myelin markers at (a) 24 or (b) 72 h after plating OPCs under differentiation conditions with the addition of a Klk6 small molecule inhibitor, DKFZ-251 (100 or 500 nM) or vehicle alone (DMSO). Inhibition of Klk6 during the early stages of OPC differentiation increased total MBP area/Olig2+ oligodendrocytes and the number of Olig2+ cells at 24 h. Inhibition of Klk6 resulted in a dose-dependent increase in MBP area/Olig2+ cells at 72 h. (*P < 0.05; **P < 0.01; ***P ≤ 0.001). Statistical evaluations were done by One-way ANOVA followed by NK post hoc test. Scale bars in a and b indicate 50 μm.
Figure 9
Figure 9. Interplay between Klk6 and brain derived neurotrophic factor regulate myelin protein production in vitro.
Fluorescent images and associated histograms show changes in expression of myelin markers at 72 h after plating OPCs under differentiation conditions with the addition of the Klk6 small molecule inhibitor, DKFZ-251 (500 nM), suboptimal levels of BDNF (1 ng/ml), a combination of DKFZ-251 + BDNF, or vehicle alone (DMSO, designated as C). Inhibition of Klk6 during the early period of OPC differentiation increased total MBP and PLP area/Olig2+ oligodendrocytes, and the number of Olig2+ cells to levels comparable to that of 1 ng/ml BDNF. The combination of Klk6 inhibition plus BDNF supplementation promoted even greater increases in PLP area/Olig2+ oligodendrocytes and Olig2+ cell counts, compared to BDNF alone. (*P < 0.05; **P < 0.01; ***P ≤ 0.001). Statistical evaluations in b-g were done by one-way ANOVA followed by NK post hoc test. Scale bar indicates 100 μm.
Figure 10
Figure 10. Working model depicting mechanism by which the level of Klk6 signaling regulates expression of MBP and PLP.
When CNS Klk6 levels are low, such as at birth, growth factors (for example BDNF) promote signaling in the AKT and ERK pathways, driving myelin production. As development proceeds, Klk6 expression progressively increases and this in turn activates PAR1 and PAR2 to suppress expression of myelin genes, for example MBP and PLP. In this model, the progressive increases in Klk6 expression that occurs until the P21 peak of myelination ultimately serve as a “brake” to limit additional myelin formation and therefore promote myelin homeostasis in adulthood.

References

    1. Angelo PF, Lima AR, Alves FM, Blaber SI, Scarisbrick IA, Blaber M, Juliano L, Juliano MA. 2006. Substrate specificity of human kallikrein 6: salt and glycosaminoglycan activation effects. J Biol Chem 281:3116–26. - PubMed
    1. Anisowicz A, Sotiropoulou G, Stenman G, Mok SC, Sager R. 1996. A novel protease homolog differentially expressed in breast and ovarian cancer. Mol Med 2:624–36. - PMC - PubMed
    1. Bando Y, Hagiwara Y, Suzuki Y, Yoshida K, Aburakawa Y, Kimura T, Murakami C, Ono M, Tanaka T, Jiang YP and others. 2018. Kallikrein 6 secreted by oligodendrocytes regulates the progression of experimental autoimmune encephalomyelitis. Glia 66:359–378. - PubMed
    1. Bando Y, Ito S, Nagai Y, Terayama R, Kishibe M, Jiang YP, Mitrovic B, Takahashi T, Yoshida S. 2006. Implications of protease M/neurosin in myelination during experimental demyelination and remyelination. Neurosci Lett 405:175–80. - PubMed
    1. Bergles DE, Richardson WD. 2015. Oligodendrocyte Development and Plasticity. Cold Spring Harb Perspect Biol 8:a020453. - PMC - PubMed

Publication types