. 2021 Dec;95(12):3745-3775.
doi: 10.1007/s00204-021-03141-w. Epub 2021 Oct 9.

The human hepatocyte TXG-MAPr: gene co-expression network modules to support mechanism-based risk assessment

Affiliations

The human hepatocyte TXG-MAPr: gene co-expression network modules to support mechanism-based risk assessment

Giulia Callegaro et al. Arch Toxicol. 2021 Dec.

Abstract

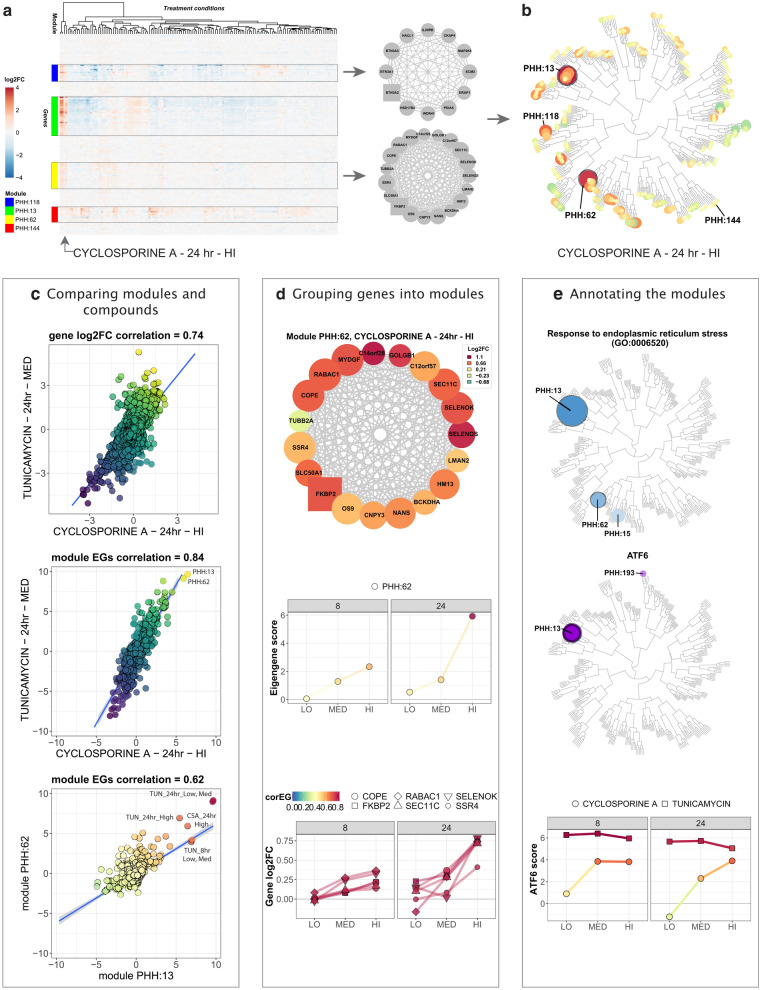
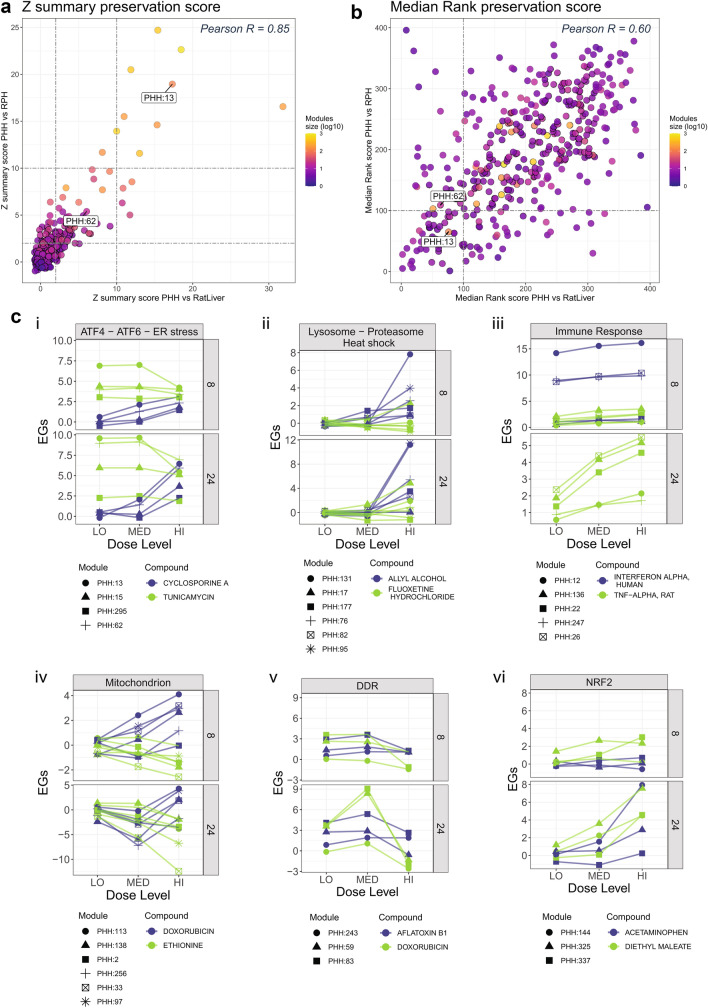
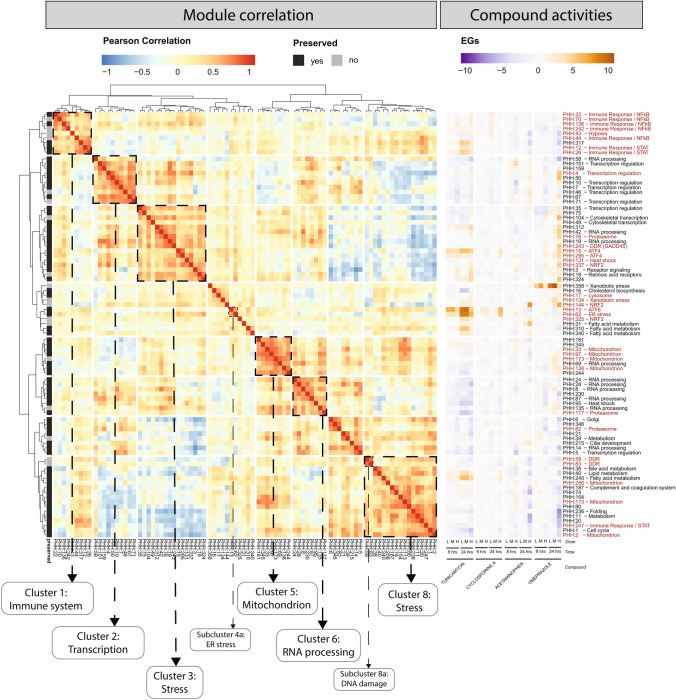
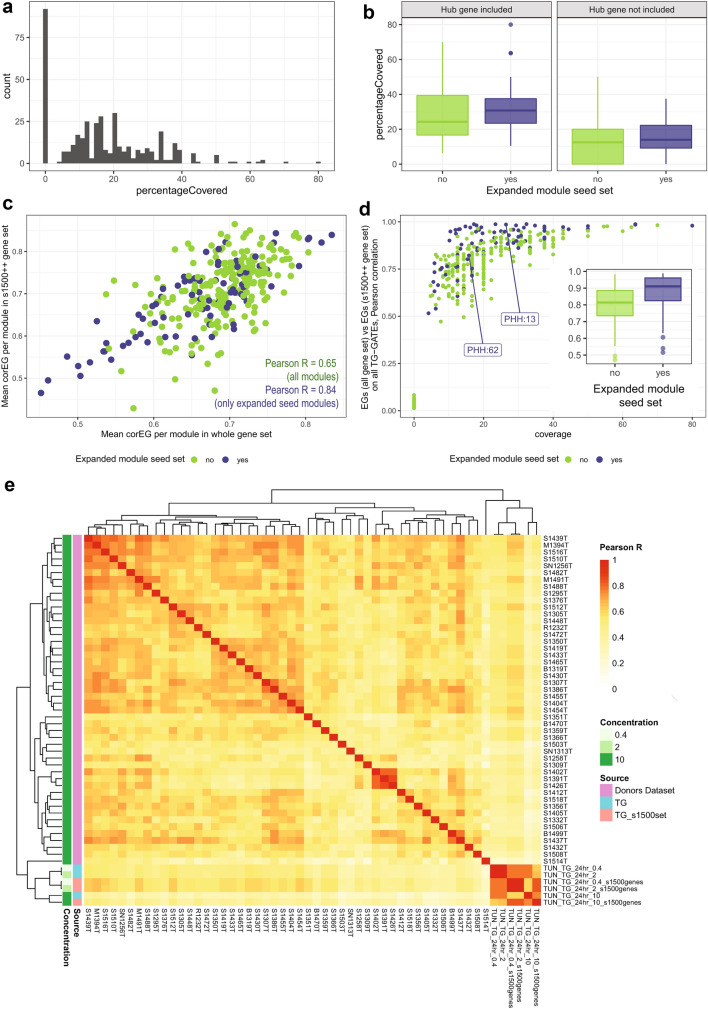
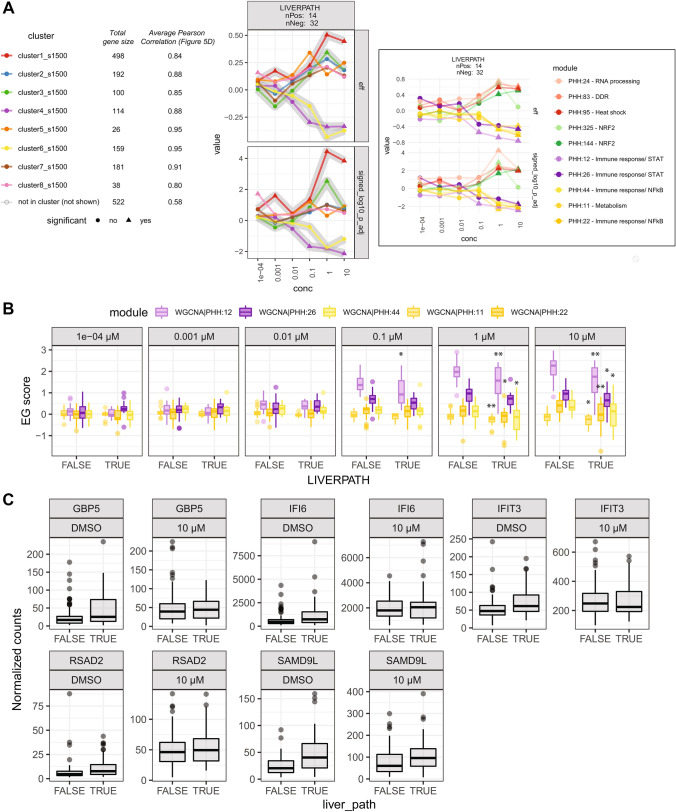
Mechanism-based risk assessment is urged to advance and fully permeate into current safety assessment practices, possibly at early phases of drug safety testing. Toxicogenomics is a promising source of mechanisms-revealing data, but interpretative analysis tools specific for the testing systems (e.g. hepatocytes) are lacking. In this study, we present the TXG-MAPr webtool (available at https://txg-mapr.eu/WGCNA_PHH/TGGATEs_PHH/ ), an R-Shiny-based implementation of weighted gene co-expression network analysis (WGCNA) obtained from the Primary Human Hepatocytes (PHH) TG-GATEs dataset. The 398 gene co-expression networks (modules) were annotated with functional information (pathway enrichment, transcription factor) to reveal their mechanistic interpretation. Several well-known stress response pathways were captured in the modules, were perturbed by specific stressors and showed preservation in rat systems (rat primary hepatocytes and rat in vivo liver), with the exception of DNA damage and oxidative stress responses. A subset of 87 well-annotated and preserved modules was used to evaluate mechanisms of toxicity of endoplasmic reticulum (ER) stress and oxidative stress inducers, including cyclosporine A, tunicamycin and acetaminophen. In addition, module responses can be calculated from external datasets obtained with different hepatocyte cells and platforms, including targeted RNA-seq data, therefore, imputing biological responses from a limited gene set. As another application, donors' sensitivity towards tunicamycin was investigated with the TXG-MAPr, identifying higher basal level of intrinsic immune response in donors with pre-existing liver pathology. In conclusion, we demonstrated that gene co-expression analysis coupled to an interactive visualization environment, the TXG-MAPr, is a promising approach to achieve mechanistic relevant, cross-species and cross-platform evaluation of toxicogenomic data.

Keywords: DILI; ER stress; Mechanism-based risk assessment; PHH; WGCNA.


Conflict of interest statement

JSR received funding from GSK and Sanofi and consultant fees from Travere Therapeutics.

Figures

Fig. 1
Fig. 1
The PHH TXG-MAPr: an innovative tool to visualize and understand PHH toxicogenomic data. a Example gene expression data matrix. Log2FC values of genes (rows) are shown for multiple treatment conditions (columns). Four groups of co-expressed genes (modules PHH:13, 62, 118 and 144), highlighted with boxes and color, show consistent patterns across the experimental conditions and are exemplified with the gene networks on the right side. Treatments are clustered using Euclidean distance to group conditions that regulate the same groups of co-expressed genes. b Hierarchical tree view (dendrogram) of module scores at 24 h cyclosporine A exposure at HI dose level (6 µM). Highlighted modules are PHH:13, PHH:62 and PHH:118 which are strongly induced by CSA (orange/red circles), while module PHH:144 is unchanged (yellow circles). c Comparing modules and compounds. Top: gene log2 fold change (log2FC) for cyclosporine A (HI dose = 6 µM, 24 h) are plotted against gene log2FC for tunicamycin (MED dose = 2 µg/mL, 24 h), showing a Pearson correlation of 0.74. Center: module EGs for cyclosporine A are plotted against module EGs for tunicamycin, showing a Pearson correlation of 0.84. Bottom: EGs for module PHH:62 are plotted against EGs for module PHH:13 (all compounds, concentrations and time points) and show a Pearson correlation of 0.62. Straight blue line represents a fitted linear model. Gray shades represent confidence interval. d Grouping genes into modules. Top: gene network for module 62. Colors qualitatively represent log2FC upon treatment with cyclosporine A at HI dose (6 µM) for 24 h. Edges thickness is proportional to the adjacency value among the genes. The squared gene is the hub-genes. Center: module EGs profile for module PHH:62 at different cyclosporine A concentrations and time points (LO = 0.24 µM, MED = 1.2 µM, HI = 6 µM). Bottom: gene log2FC profile for hub-like genes belonging to module 62 at different cyclosporine A concentrations and time points. Color code of points and edges represents the correlation eigengene (corEG). e Annotating the modules. Top: Hierarchical tree view with module color and size proportional to the − log10 p value for the enrichment for the GO term “response to endoplasmic reticulum stress” (GO:0006520). Significantly enriched modules PHH:13, 15 and 62 with p values (< 0.01) are highlighted in blue. Center: Hierarchical tree view with module color and size proportional to the − log10 p value for the enrichment for the transcription factor ATF6. ATF6 enriched modules PHH:13 and 193 with significant p values (< 0.01) are highlighted in purple. Bottom: ATF6 activation score considering all its targets for cyclosporine A (LO = 0.24 µM, MED = 1.2 µM, HI = 6 µM) and tunicamycin (LO = 0.4 µg/mL, MED = 2 µg/mL, HI = 10 µg/mL) (color figure online)
Fig. 2
Fig. 2
Some PHH WGCNA modules are preserved in rat systems and connect to stress response pathways. a Z summary preservation score plot. Z summary preservation values of PHH modules in Rat in vivo Liver data (x-axis) are plotted against Z summary preservation values of PHH modules in Rat Primary Hepatocytes data (y-axis). Modules are colored based on their size (log10 transformed) and modules PHH:13 and PHH:62 are labeled. Higher scores imply better preservations. The dashed lines correspond to Z summary = 2 and Z summary = 10, above which a module can be considered, respectively, moderate and high preserved. b Median Rank preservation score plot. Median Rank preservation values of PHH modules in Rat in vivo Liver data (x-axis) are plotted against Median Rank preservation values of PHH modules in Rat Primary Hepatocytes data (y-axis). Modules are colored based on their size (log10 transformed) and modules PHH:13 and PHH:62 are labeled. Lower scores imply a higher rank and greater preservation. c Dose- and time-response EGs plots of modules representing stress response pathways. Modules are grouped by stress processes (roman letters) and their responses upon treatment with representative compounds is shown in dose–response (x axis), faceted by time. Modules are represented by different symbols, while compounds by different colors (color figure online)
Fig. 3
Fig. 3
PHH stress modules interaction map. Cluster correlation matrix of the 87 modules correlating with well-annotated modules. On the left, modules are hierarchically clustered with Ward D2 algorithm using Pearson correlation (red–blue color scale) as distance. On the far left, the preservation status of each module is indicated with gray color scale (black—preserved, gray—not preserved). Clusters of modules with concordant annotation are highlighted with dashed squares. On the left, EGs (purple–orange color scale) for the exemplar compounds tunicamycin, cyclosporine A, Acetaminophen, Omeprazole are shown for the 87 modules, in dose– and time–responses. On the far right, modules names are shown together with their main annotation (available for the seed modules), in red highlighted the modules show in Table 1 (color figure online)
Fig. 4
Fig. 4
Upload external data into the PHH TXG-MAPr. a Hierarchical tree view of module EGs upon 30 µM cyclosporine A exposure at 3 day (left), 5 day (middle) and 5 day + 3 day recovery (right). b Heatmap of all modules that have at least one condition with absolute EG score > 2 for cyclosporine A treatment. All concentrations and time points from TG-GATEs (0.24, 1.2 and 6 µM) and uploaded GEO: GSE83958 dataset (30 µM) are shown. Modules are clustered by Euclidean distance, Ward.D2 method. The purple color scale indicates to which cluster of Fig. 3 each module belongs, and gray color scale indicates the preservation status. c Zoom in for the third cluster obtained from the heatmap in B. Modules that have a strong annotation for ER stress (PHH:13 and PHH:62) or ISR (PHH:15) are in this module cluster and are strongly induced by 6–30 µM cyclosporine A. d Compound correlation plot comparing the module EG scores of the uploaded 30 µM CSA data at 5 day + 3 day recovery (y-axis), with CSA_24hr_6µM (x-axis) available in the PHH TXG-MAPr (Pearson R = 0.67). e Cluster correlation heatmap showing the Pearson R correlation between the conditions in TG-GATEs data (CSA, TUN, APAP) and the uploaded datasets with CSA and APAP exposures in PHH, HepG2 and HepaRG cells at various time points (see labels). Compounds cluster by mode-of-action, because ER stress inducers TUN and CSA are clustering together and show low correlation with the oxidative stress inducer APAP (color figure online)
Fig. 5
Fig. 5
Upload of 50 donors PHH study S1500 + TempO-Seq set. a Histogram of modules coverage when uploading the targeted TempO-Seq gene set. Frequency (y axis) of modules percentage covered by the uploaded targeted gene set (x axis). b Percentage covered (y axis) for PHH modules, grouped on the x axis by whether they are part of the correlation matrix in Fig. 3 (blue) or not (green). The plot is divided into two sections, the first one showing modules where the hub gene was included in the uploaded gene set, the second one showing modules where the hub gene was not included in the uploaded gene set. c Mean correlation Eigengene for each module, whole genes set (x axis) versus after upload with the targeted TempO-Seq gene set (y axis). Points are colored based on whether they are part of the correlation matrix in Fig. 3 (blue) or not (green). d Pearson R correlation for each module between EGs calculated with the complete gene set, and EGs calculated with the S1500 + gene set, for all TG-GATEs experiments. Points are plotted against module coverage (x-axis) and are colored based on whether they are part of the correlation matrix in Fig. 3 (blue) or not (green). Inside: Pearson correlation calculated as previously grouped by whether they are part of the correlation matrix in Fig. 3 (blue) or not (green). Modules with coverage = 0% had been excluded. e Cluster correlation heatmap (complete clustering, Euclidean distance) showing the Pearson R correlation between modules EGs of the 50 donors dataset samples (10 µM, 24 h, pink color code on the left), TG-GATEs tunicamycin data obtained with the complete gene set (aquamarine color code on the left), and TG-GATEs tunicamycin data using only the S1500 + gene space (salmon color code on the left) (color figure online)
Fig. 6
Fig. 6
Some PHH modules are associated with donor’s traits. a Dose–response plot of effect size and adjusted p value (log10 transformation, keeping the sign) resulting from the association of modules clusters to donors’ presence of liver pathologies. Modules clusters indicated by different color, number of donors showing (positive) and not showing (negative) the indicated trait are shown in the plot label. On the right, effect size and adjusted p value (log10 transformation, keeping the sign) of individual modules to trait associations most prominently contributing to the overall cluster associations highlighted with gray shadows. Modules are colored in different saturation level of the same hue of the cluster they belong to. b Boxplot of modules’ EGs negatively associated with liverpath, grouped by increasing concentrations and presence/absence of liver pathologies. **Adjusted p value < 0.01, *adjusted p value < 0.05 in logistic regression of individual modules. c Boxplot of normalized counts of genes belonging to module PHH:12 and significantly different between donors with or without liver pathologies with only DMSO treatment (Wilcoxon test, BH adj. p value < 0.05)

Similar articles

Cited by

References

    1. Alexa A, Rahnenführer J (2007) topGO: Enrichment Analysis for Gene Ontology. R package
    1. Alvarez MJ, Shen Y, Giorgi FM, Lachmann A, Ding BB, Hilda Ye B, Califano A. Functional characterization of somatic mutations in cancer using network-based inference of protein activity. Nat Genet. 2016;48(8):838–847. doi: 10.1038/ng.3593. - DOI - PMC - PubMed
    1. Bailey J, Balls M. Recent efforts to elucidate the scientific validity of animal-based drug tests by the pharmaceutical industry, pro-testing lobby groups, and animal welfare organisations. BMC Med Ethics. 2019;20(1):16. doi: 10.1186/s12910-019-0352-3. - DOI - PMC - PubMed
    1. Barel G, Herwig R. Network and pathway analysis of toxicogenomics data. Front Genet. 2018;9:484. doi: 10.3389/fgene.2018.00484. - DOI - PMC - PubMed
    1. Björnsson ES. Global epidemiology of drug-induced liver injury (DILI) Curr Hepatol Rep. 2019;18(3):274–279. doi: 10.1007/s11901-019-00475-z. - DOI