. 2021 Nov 18;81(22):4722-4735.e5.
doi: 10.1016/j.molcel.2021.09.015. Epub 2021 Oct 8.

Proteome-wide mapping of short-lived proteins in human cells

Affiliations

Proteome-wide mapping of short-lived proteins in human cells

Jiaming Li et al. Mol Cell. .

Abstract

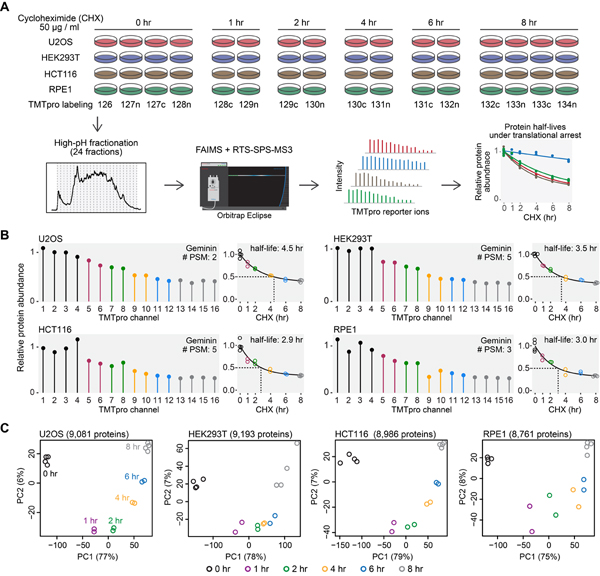
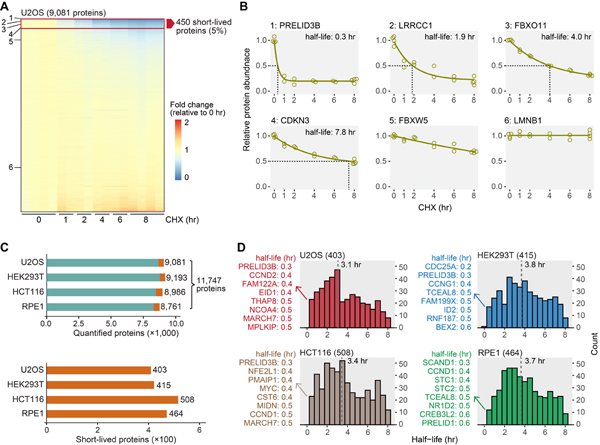
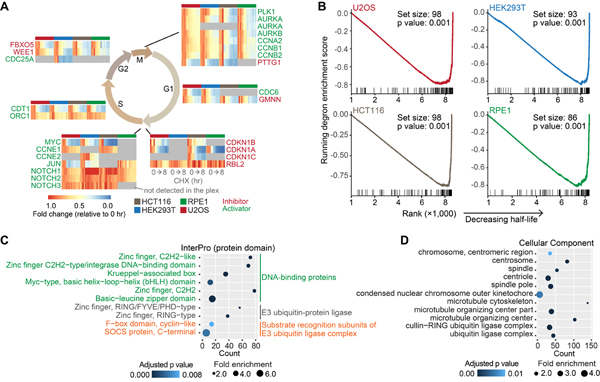
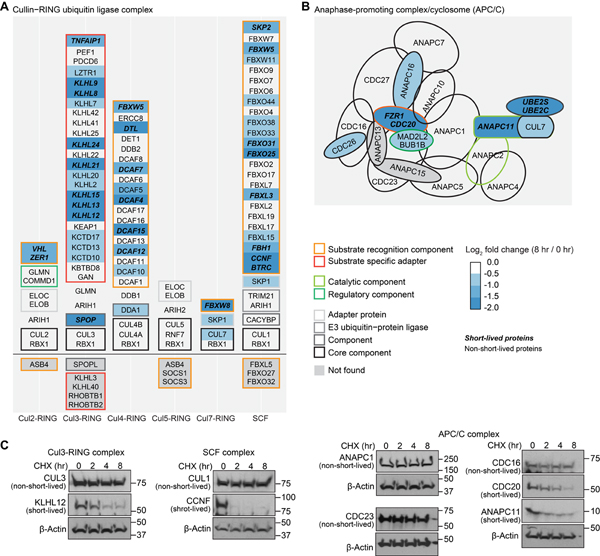
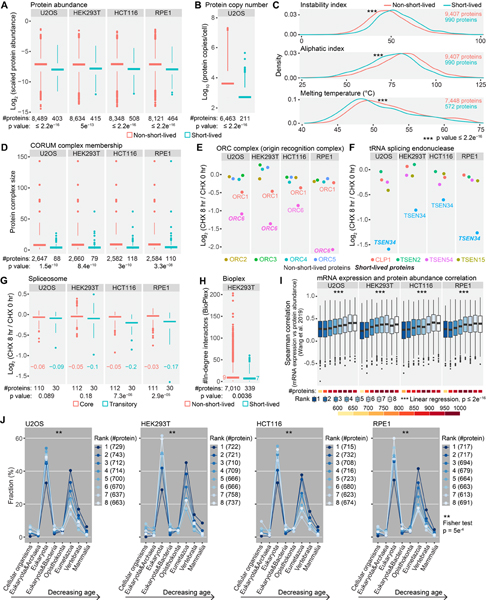
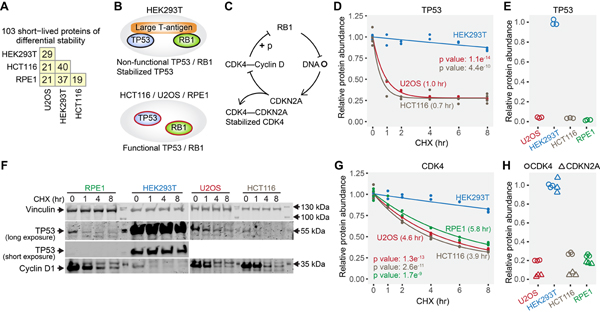
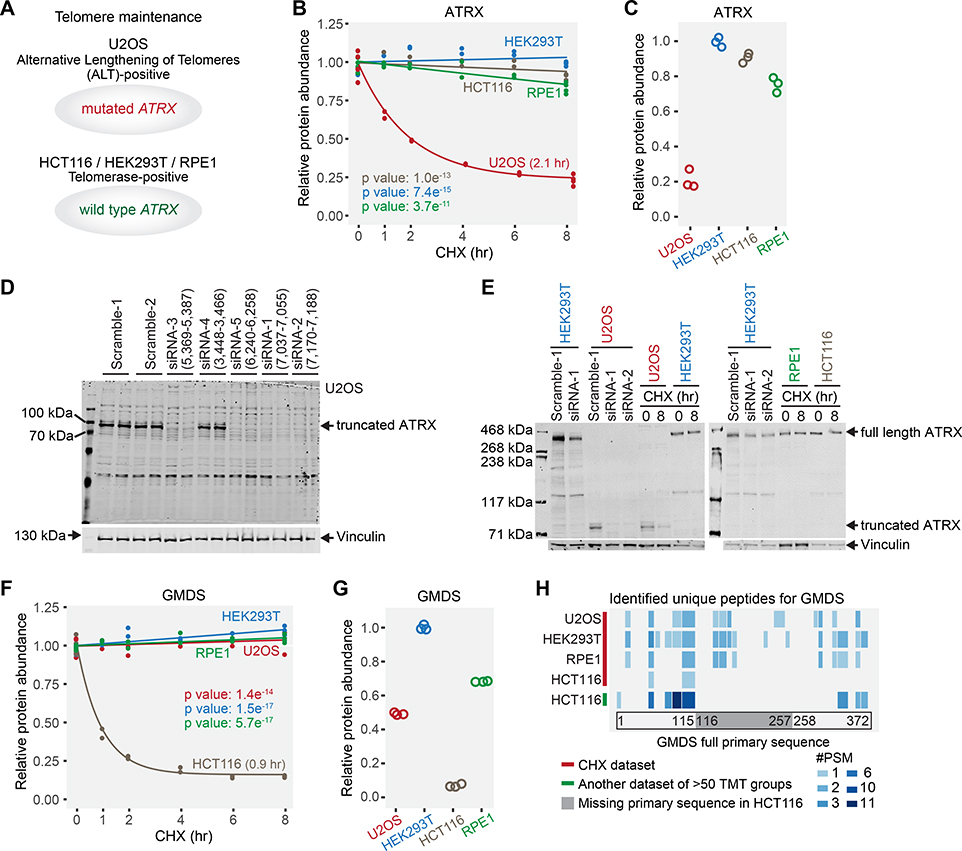
Rapid protein degradation enables cells to quickly modulate protein abundance. Dysregulation of short-lived proteins plays essential roles in disease pathogenesis. A focused map of short-lived proteins remains understudied. Cycloheximide, a translational inhibitor, is widely used in targeted studies to measure degradation kinetics for short-lived proteins. Here, we combined cycloheximide chase assays with advanced quantitative proteomics to map short-lived proteins under translational inhibition in four human cell lines. Among 11,747 quantified proteins, we identified 1,017 short-lived proteins (half-lives ≤ 8 h). These short-lived proteins are less abundant, evolutionarily younger, and less thermally stable than other proteins. We quantified 103 proteins with different stabilities among cell lines. We showed that U2OS and HCT116 cells express truncated forms of ATRX and GMDS, respectively, which have lower stability than their full-length counterparts. This study provides a large-scale resource of human short-lived proteins under translational arrest, leading to untapped avenues of protein regulation for therapeutic interventions.

Keywords: TMTpro tags; multiplexed quantitative proteomics; protein degradation; protein half-lives; short-lived proteins.


Conflict of interest statement

Declaration of interests The authors declare no competing interests.

Figures

Figure 1.
Figure 1.. An overview of the experimental design.
(A) Cells were treated with cycloheximide, and samples were digested and then labeled with TMTpro 16-plex reagents. Labeled samples were fractionated and concatenated into 24 fractions. Samples were analyzed on an Orbitrap Eclipse mass spectrometer with high-field asymmetric-waveform ion mobility spectrometry (FAIMS) and real-time-search (RTS)-synchronous-precursor-selection (SPS)-MS3. Relative protein abundance was used to calculate protein half-lives under translational inhibition. (B) Relative protein abundance and half-lives of Geminin. Geminin is a known short-lived protein. #PSM is the number of peptide-spectrum-matches. A protein with a PSM count of three means that the protein’s quantification is based on a weighted average of three quantified peptides. (C) Replicate samples grouped together in principal component analysis. Samples collected at different time points were separated mainly on the first principal component (PC1). Relative protein abundance is TMTpro signal-to-noise normalized to the mean of the first time point in panel A and B. See also Figure S1 and Table S1.
Figure 2.
Figure 2.. Overview of short-lived proteins under translational arrest.
(A) A representative view of quantified proteins and short-lived proteins. Deep proteome coverage was achieved (>9,000 proteins) and only a small fraction of the quantified proteome (~5%) was short-lived in U2OS cells. Six proteins with diverse half-lives are highlighted in panel B. (B) Example degradation curves showing proteins with variable stability. Relative protein abundance is TMTpro signal-to-noise normalized to the mean of the first time point. (C) The number of quantified proteins (upper panel) and short-lived proteins (lower panel). About 4.4%−5.3% of the quantified proteome was short-lived (orange blocks in the upper panel). (D) Distributions of short-lived protein half-lives. Values in parentheses are numbers of short-lived proteins. The eight most short-lived proteins and their half-lives are shown on the left. Bin size is 0.5 hr. The dashed lines indicate medians. See also Figure S2 and Table S2.
Figure 3.
Figure 3.. Known short-lived proteins were captured, and E3 ligases and substrate recognition subunits of E3 ligase complexes were enriched in short-lived proteins under translational inhibition.
(A) Known short-lived cell cycle inhibitors and activators were recapitulated. Replicates are shown individually in the heatmaps. Gray indicates no detection in the plex in the heatmaps. (B) Gene set enrichment analysis (GSEA). Degron-containing proteins were significantly enriched in proteins deemed short-lived. The gene set contains proteins that have at least one known degrons. Log2 fold changes (8 hr vs 0 hr) were used in GSEA. Higher ranks indicate shorter half-lives. (C) InterPro categories enriched among short-lived proteins. DNA-binding proteins, E3 ubiquitin-protein ligases, and substrate recognition subunits of E3 ubiquitin ligase complexes were significantly enriched. (D) Subcellular components enriched among short-lived proteins. See also Figure S3.
Figure 4.
Figure 4.. Substrate recognition subunits of E3 ubiquitin ligase complexes displayed faster degradation than core components under translational inhibition.
About 90% of the E3 ubiquitin ligase complex subunits were found in this work. Core components of cullin-RING ubiquitin ligase complexes (A) and anaphase-promoting complex/cyclosome (B) were stable, and substrate recognition subunits were quickly degraded under 8 hr of translational arrest. The list of E3 ubiquitin ligase complex subunits was from Gene Ontology. Western blotting (C) shows that four adaptor or catalytic proteins (KLHL12, CCNF, CDC20, and ANAPC11) were short-lived, and five core component proteins (CUL3, CUL1, ANAPC1, CDC23, and CDC16) were stable in U2OS cells. See also Figure S4.
Figure 5.
Figure 5.. Evaluating the properties of short-lived proteins under translational arrest.
(A) Short-lived proteins were less abundant than other proteins. Scaled protein abundance is TMTpro signal-to-noise (SN) normalized by protein length and the fraction of TMTpro SN at 0 hr among summed TMTpro SN. (B) Short-lived proteins displayed lower protein copies/cell than other proteins in U2OS cells. (C) Short-lived proteins showed higher instability indices, higher aliphatic indices and lower melting temperatures than non-short-lived proteins. The list of short-lived proteins contains proteins that were short-lived in at least one cell line. (D) Short-lived proteins tended to reside in smaller protein complexes. (E) ORC1 and ORC6 are loosely attached subunits of the origin recognition complex with shorter half-lives than other subunits. (F) TSEN34 of tRNA splicing endonuclease showed a higher degradation rate than other subunits. (G) Spliceosome components that are assembled or disassembled dynamically between different spliceosome conformational states (transitory subunits) presented greater losses at 8 hr, especially in HCT116 and RPE1 cells. Numbers in the plot are median log2 fold changes. (H) Short-lived proteins had fewer interacting proteins than other proteins in HEK293T cells. Numbers in the plot are median in-degree interactions. (I) Rapidly degraded proteins showed lower mRNA expression and protein abundance correlation across human tissues compared to stable proteins. (J) Short-lived proteins were evolutionarily younger than stable proteins. Numbers in parentheses are bin size. Rank 1 and 8 represent the least and the most stable proteins, respectively in panel I and J. Statistical significance was determined by unpaired Wilcoxon test (two-sided) in panel A-D, G and H. Data are presented as box plots (center line: median; box limits: the first and third quartiles; whiskers: 1.5x interquartile range) in panel A, B, D and G-I. See also Figure S5.
Figure 6.
Figure 6.. Cell line specific differences in the stability of short-lived proteins.
(A) Numbers of short-lived proteins with differential stability between any two cell lines. (B) HEK293T expresses large T-antigen, which binds TP53 and RB1 proteins and renders them non-functional. TP53 is stabilized by its interaction with large T-antigen. (C) Non-functional RB1 results in higher expression of CDKN2A, which competitively binds and stabilizes CDK4. (D) The fast degradation of TP53 in U2OS and HCT116, and the stabilization of TP53 by interaction with large T-antigen in HEK293T were captured by the mass spectrometry data. Values in parentheses are half-lives. TP53 was not identified in RPE1 cells, presumably due to its very low abundance. (E) TP53 showed higher protein abundance in HEK293T due to stabilization by large T-antigen. (F) Western blotting shows that TP53 was long-lived only in HEK293T cells. Cyclin D1 is a known short-lived protein (positive control). (G) The stabilization of CDK4 uniquely in HEK293T cells. (H) CDKN2A and CDK4 have higher overall protein expression levels in HEK293T cells. Relative protein abundance is TMTpro signal-to-noise normalized to the mean of the first time point in panel D and G. Relative protein abundance is TMTpro signal-to-noise normalized to the maximum in panel E and H. Note that relative protein abundance is comparable for the same protein across different cell lines, and not comparable for different proteins in the same cell line in panel H. See also Figure S6 and Table S3.
Figure 7.
Figure 7.. Examples of truncated protein forms unique to one cell line with concomitant short half-lives.
(A) U2OS is an alternative lengthening of telomeres-positive cell line with a mutated ATRX gene. The other three are telomerase-positive cell lines carrying the wild type ATRX gene. (B) ATRX in U2OS cells displayed a significantly shorter half-life than other cell lines. (C) ATRX expression levels in U2OS cells are lower than other cell lines. Only ATRX peptides that were identified in U2OS cells were used for quantification. (D) siRNA experiments verified that U2OS cells expressed a truncated form of ATRX protein. siRNAs (siRNA-1, siRNA-2, siRNA-3, and siRNA-5) targeting the remaining exons abolished the detection of the truncated ATRX, while scramble siRNAs and siRNA (siRNA-4) targeting a deleted exon did not. (E) Western blotting results showed that the truncated form of ATRX was short-lived in U2OS cells, while full length ATRX was not in other cell lines. (F) GMDS has a significantly shorter half-life (0.9 hr) in HCT116 cells. (G) GMDS is expressed at a much lower level in HCT116 cells. Only GMDS peptides that were identified in HCT116 cells were used for quantification. (H) Evidence of GMDS truncation based on peptide sequencing. No GMDS peptides were identified in the deletion region in HCT116 cells in this study or in another large unpublished HCT116 dataset from our lab. However, GMDS peptides were identified throughout the full primary sequence at an equivalent frequency in other cell lines. #PSM means the number of peptide-spectrum-matches (how many times the peptide was detected). Blue blocks indicate the identified peptides and their positions in the full primary sequence. Light gray in the same row indicates no peptide detected in the corresponding position. Relative protein abundance is TMTpro signal-to-noise normalized to the mean of the first time point in panel B and F. Relative protein abundance is TMTpro signal-to-noise normalized to the maximum in panel C and G. See also Figure S7.

References

    1. Beck M, Schmidt A, Malmstroem J, Claassen M, Ori A, Szymborska A, Herzog F, Rinner O, Ellenberg J, and Aebersold R (2011). The quantitative proteome of a human cell line. Mol Syst Biol 7, 549. 10.1038/msb.2011.82. - DOI - PMC - PubMed
    1. Belle A, Tanay A, Bitincka L, Shamir R, and O’Shea EK (2006). Quantification of protein half-lives in the budding yeast proteome. Proc Natl Acad Sci U S A 103, 13004–13009. 10.1073/pnas.0605420103. - DOI - PMC - PubMed
    1. Bodnar AG, Ouellette M, Frolkis M, Holt SE, Chiu CP, Morin GB, Harley CB, Shay JW, Lichtsteiner S, and Wright WE (1998). Extension of life-span by introduction of telomerase into normal human cells. Science 279, 349–352. 10.1126/science.279.5349.349. - DOI - PubMed
    1. Boisvert FM, Ahmad Y, Gierlinski M, Charriere F, Lamont D, Scott M, Barton G, and Lamond AI (2012). A quantitative spatial proteomics analysis of proteome turnover in human cells. Mol Cell Proteomics 11, M111 011429. 10.1074/mcp.M111.011429. - DOI - PMC - PubMed
    1. Bray SJ (2016). Notch signalling in context. Nat Rev Mol Cell Biol 17, 722–735. 10.1038/nrm.2016.94. - DOI - PubMed

Publication types

MeSH terms

LinkOut - more resources