

Reproducibility of global electrical heterogeneity measurements on 12-lead ECG: The Multi-Ethnic Study of Atherosclerosis
- PMID: 34626835
- PMCID: PMC8627471
- DOI: 10.1016/j.jelectrocard.2021.09.014
Reproducibility of global electrical heterogeneity measurements on 12-lead ECG: The Multi-Ethnic Study of Atherosclerosis
Abstract
Objective: Vectorcardiographic (VCG) global electrical heterogeneity (GEH) metrics showed clinical usefulness. We aimed to assess the reproducibility of GEH metrics.
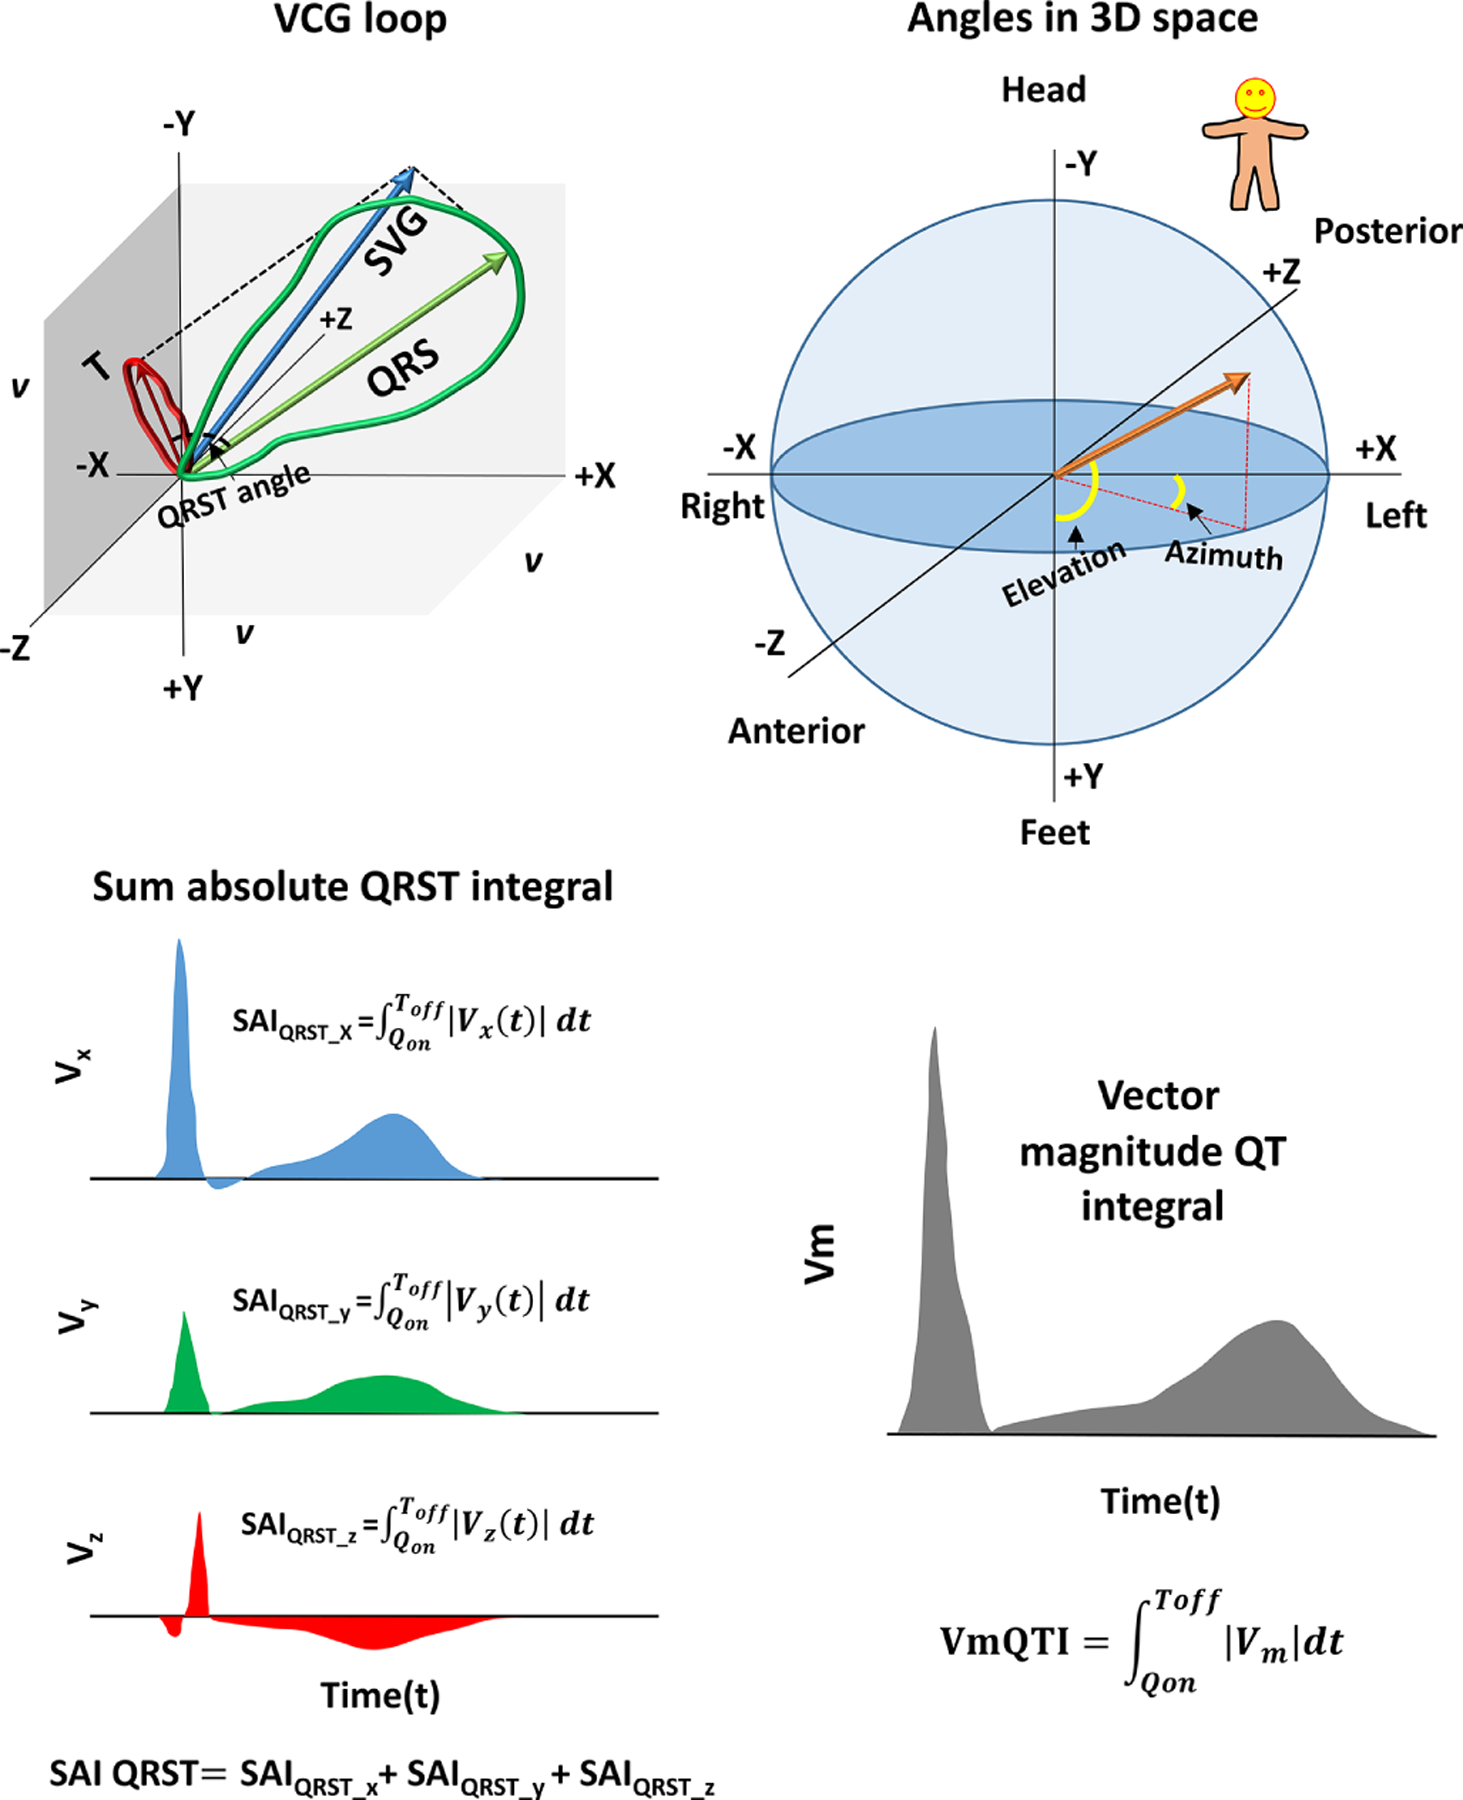
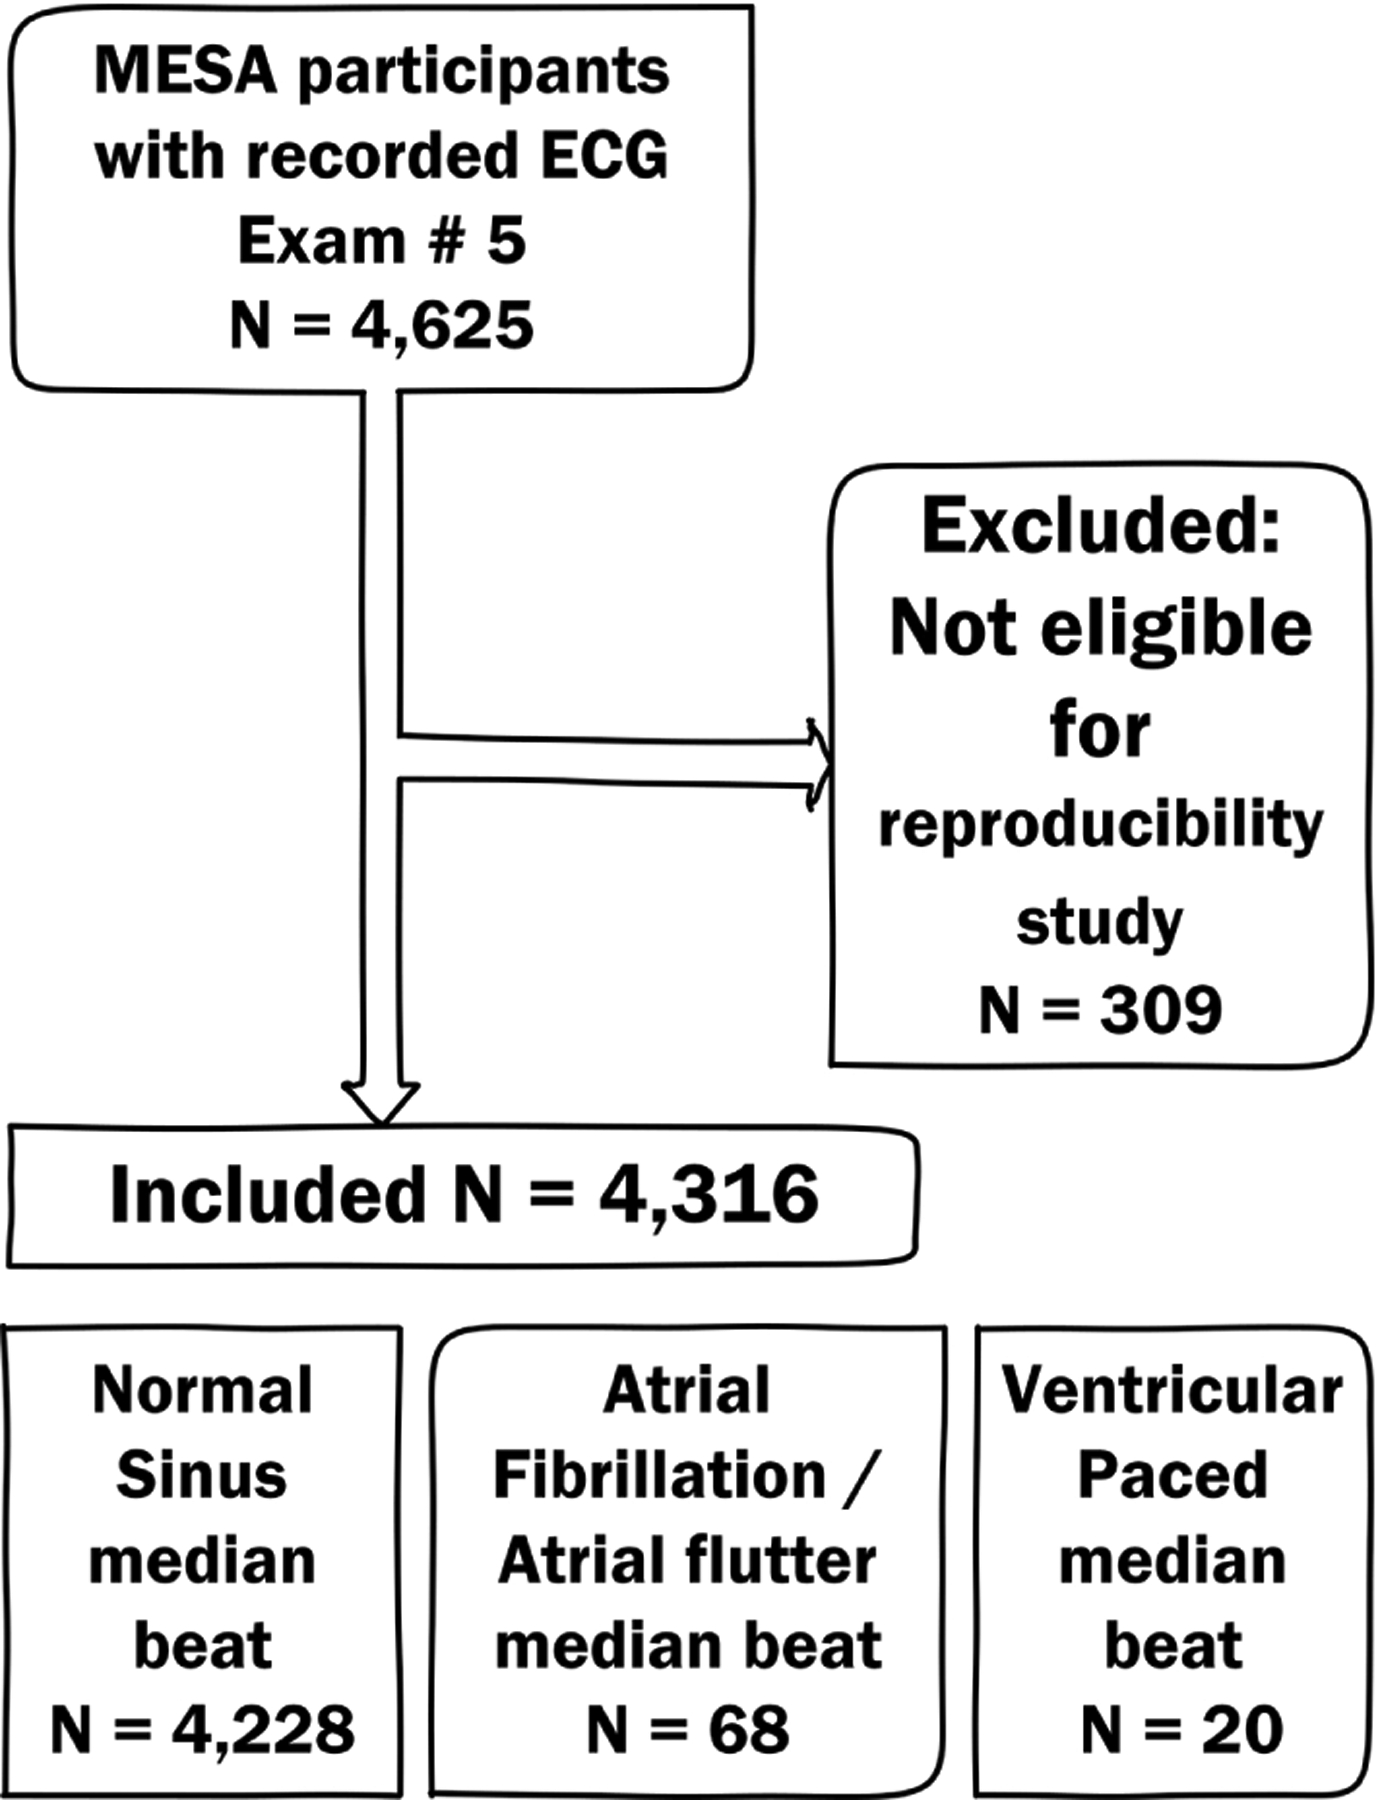
Methods: GEH was measured on two 10-s 12‑lead ECGs recorded on the same day in 4316 participants of the Multi-Ethnic Study of Atherosclerosis (age 69.4 ± 9.4 y; 2317(54%) female, 1728 (40%) white, 1138(26%) African-American, 519(12%) Asian-American, 931(22%) Hispanic-American). GEH was measured on a median beat, comprised of the normal sinus (N), atrial fibrillation/flutter (S), and ventricular-paced (VP) beats. Spatial ventricular gradient's (SVG's) scalar was measured as sum absolute QRST integral (SAIQRST) and vector magnitude QT integral (VMQTi).
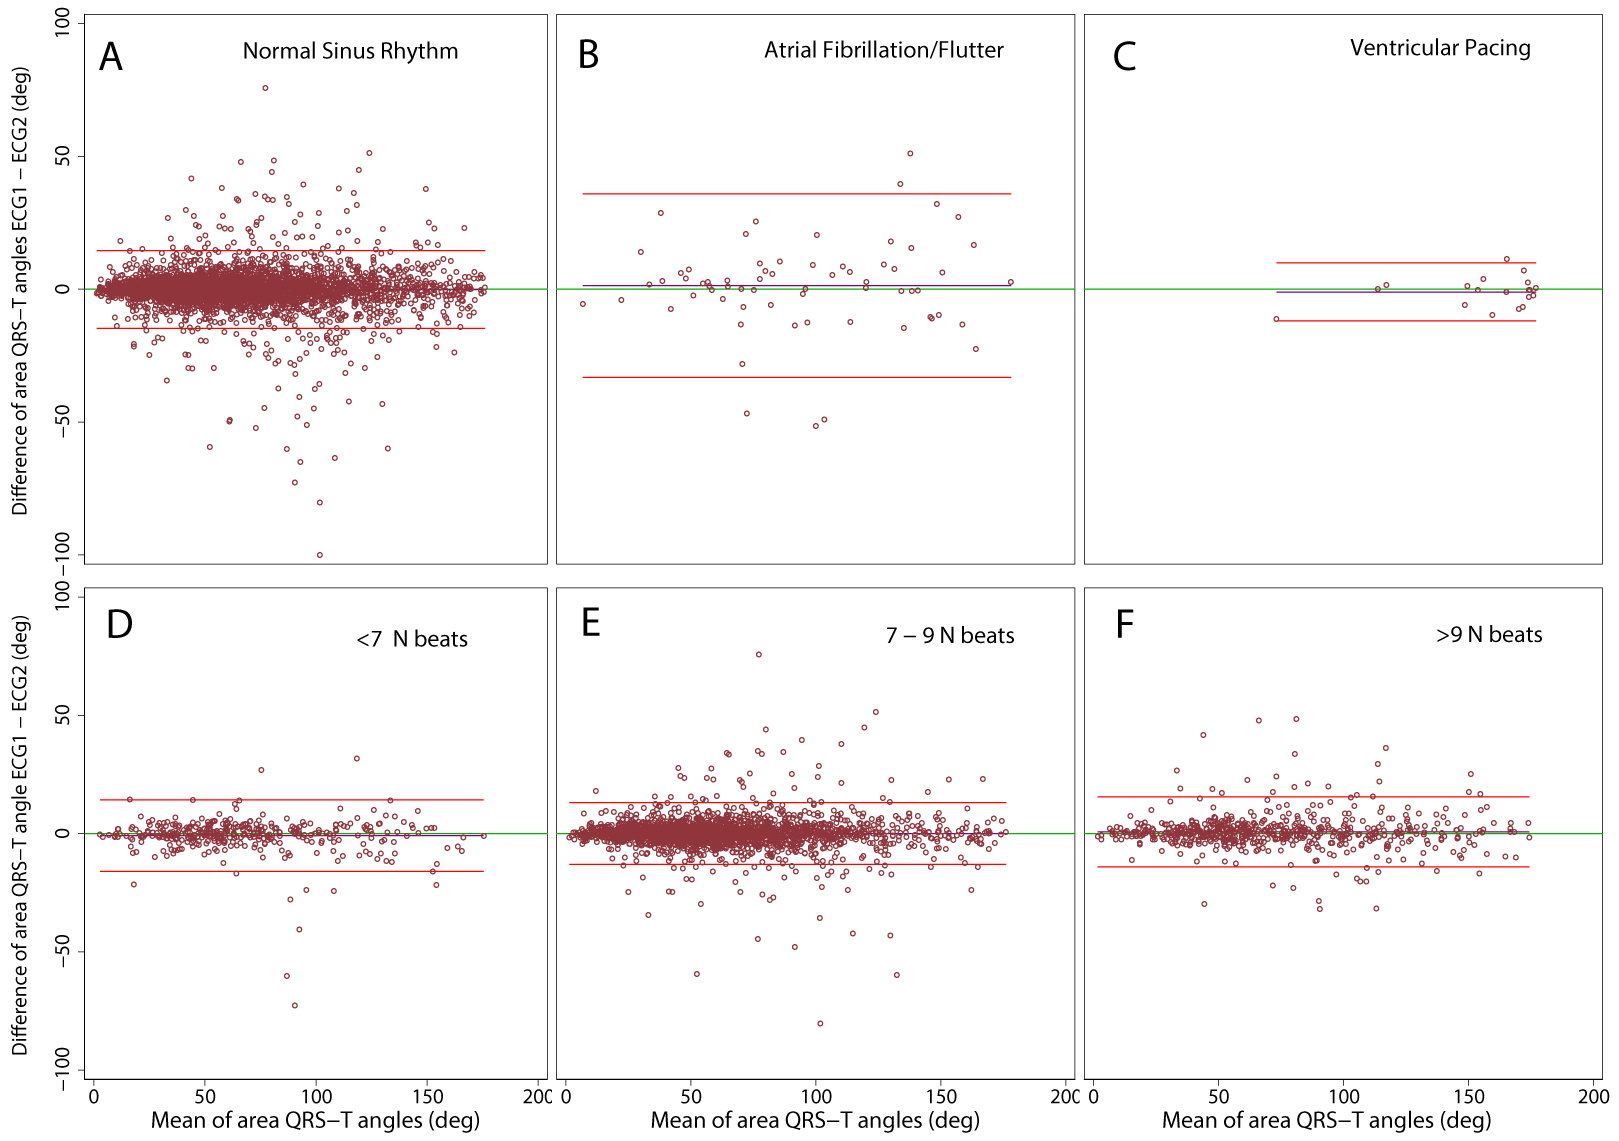
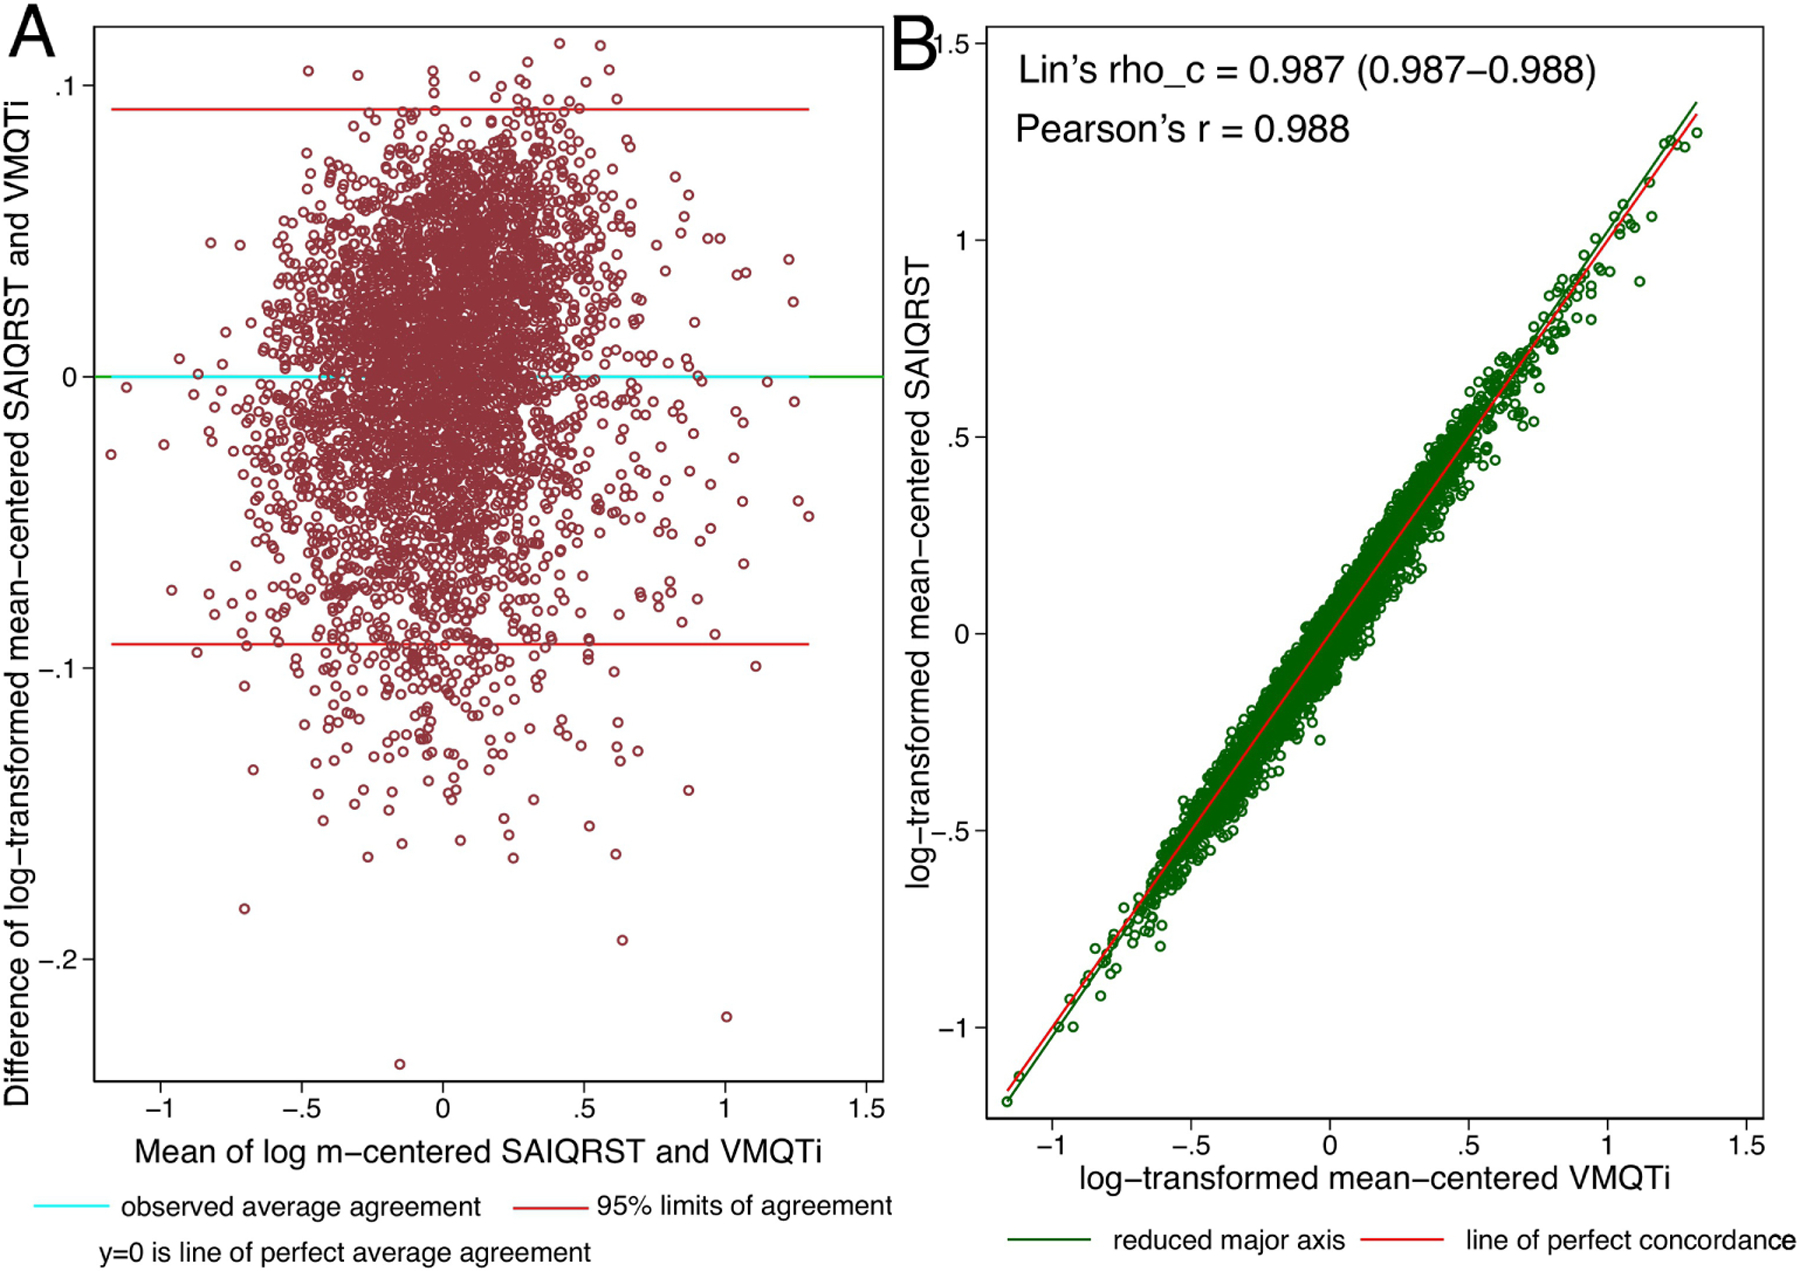
Results: Two N ECGs with heart rate (HR) bias of -0.64 (95% limits of agreement [LOA] -5.68 to 5.21) showed spatial area QRS-T angle (aQRST) bias of -0.12 (95%LOA -14.8 to 14.5). Two S ECGs with HR bias of 0.20 (95%LOA -15.8 to 16.2) showed aQRST bias of 1.37 (95%LOA -33.2 to 35.9). Two VP ECGs with HR bias of 0.25 (95%LOA -3.0 to 3.5) showed aQRST bias of -1.03 (95%LOA -11.9 to 9.9). After excluding premature atrial or ventricular beat and two additional beats (before and after extrasystole), the number of cardiac beats included in a median beat did not affect the GEH reproducibility. Mean-centered log-transformed values of SAIQRST and VMQTi demonstrated perfect agreement (Bias 0; 95%LOA -0.092 to 0.092).
Conclusion: GEH measurements on N, S, and VP median beats are reproducible. SVG's scalar can be measured as either SAIQRST or VMQTi.
Significance: Satisfactory reproducibility of GEH metrics supports their implementation.
Keywords: Global electrical heterogeneity; QRS-T angle; Reproducibility; Spatial ventricular gradient; Vectorcardiogram.
Copyright © 2021 Elsevier Inc. All rights reserved.
Conflict of interest statement
Declaration of Competing Interest None.
Figures
Similar articles
-
The Reproducibility of Global Electrical Heterogeneity ECG Measurements.Comput Cardiol (2010). 2018 Sep;45:10.22489/cinc.2018.162. doi: 10.22489/cinc.2018.162. Epub 2019 Jun 24. Comput Cardiol (2010). 2018. PMID: 32296724 Free PMC article.
-
Global ECG Measures and Cardiac Structure and Function: The ARIC Study (Atherosclerosis Risk in Communities).Circ Arrhythm Electrophysiol. 2018 Mar;11(3):e005961. doi: 10.1161/CIRCEP.117.005961. Circ Arrhythm Electrophysiol. 2018. PMID: 29496680 Free PMC article.
-
Changes in global electrical heterogeneity associated with dofetilide, quinidine, ranolazine, and verapamil.Heart Rhythm. 2020 Mar;17(3):460-467. doi: 10.1016/j.hrthm.2019.09.017. Epub 2019 Sep 17. Heart Rhythm. 2020. PMID: 31539628 Free PMC article.
-
A review of beat-to-beat vectorcardiographic (VCG) parameters for analyzing repolarization variability in ECG signals.Biomed Tech (Berl). 2016 Feb;61(1):3-17. doi: 10.1515/bmt-2015-0005. Biomed Tech (Berl). 2016. PMID: 25992510 Review.
-
Global electrical heterogeneity: A review of the spatial ventricular gradient.J Electrocardiol. 2016 Nov-Dec;49(6):824-830. doi: 10.1016/j.jelectrocard.2016.07.025. Epub 2016 Jul 28. J Electrocardiol. 2016. PMID: 27539162 Free PMC article. Review.
Cited by
-
The Importance of Frontal QRS-T Angle in Predicting the Effectiveness and Success of Thrombolytic Therapy in Patients With Acute Pulmonary Embolism.Cureus. 2023 Jan 2;15(1):e33268. doi: 10.7759/cureus.33268. eCollection 2023 Jan. Cureus. 2023. PMID: 36741663 Free PMC article.
-
The Significance of Frontal Plane QRS-T Angle for Estimating Non-Dipper Hypertension.Cureus. 2022 Dec 23;14(12):e32890. doi: 10.7759/cureus.32890. eCollection 2022 Dec. Cureus. 2022. PMID: 36699797 Free PMC article.
-
Genetic architecture of spatial electrical biomarkers for cardiac arrhythmia and relationship with cardiovascular disease.Nat Commun. 2023 Mar 14;14(1):1411. doi: 10.1038/s41467-023-36997-w. Nat Commun. 2023. PMID: 36918541 Free PMC article.
-
Relationship Between Atrial Fibrillation Recurrence and Frontal QRS-T Angle After Effective Cardioversion.Cureus. 2023 Jan 9;15(1):e33541. doi: 10.7759/cureus.33541. eCollection 2023 Jan. Cureus. 2023. PMID: 36779136 Free PMC article.
-
Demographic and Methodological Heterogeneity in Electrocardiogram Signals From Guinea Pigs.Front Physiol. 2022 Jun 2;13:925042. doi: 10.3389/fphys.2022.925042. eCollection 2022. Front Physiol. 2022. PMID: 35721548 Free PMC article.
References
-
- Waks JW, Sitlani CM, Soliman EZ, Kabir M, Ghafoori E, Biggs ML, et al. Global Electric Heterogeneity Risk Score for Prediction of Sudden Cardiac Death in the General Population: The Atherosclerosis Risk in Communities (ARIC) and Cardiovascular Health (CHS) Studies. Circulation 2016; 133: 2222–2234. - PMC - PubMed
Publication types
MeSH terms
Grants and funding
- N01 HC095168/HL/NHLBI NIH HHS/United States
- 75N92020D00001/HL/NHLBI NIH HHS/United States
- N01 HC095167/HL/NHLBI NIH HHS/United States
- R56 HL118277/HL/NHLBI NIH HHS/United States
- R01 HL118277/HL/NHLBI NIH HHS/United States
- HHSN268201500003I/HL/NHLBI NIH HHS/United States
- UL1 TR000040/TR/NCATS NIH HHS/United States
- N01 HC095166/HL/NHLBI NIH HHS/United States
- N01 HC095160/HL/NHLBI NIH HHS/United States
- 75N92020D00002/HL/NHLBI NIH HHS/United States
- HHSN268201500003C/HL/NHLBI NIH HHS/United States
- N01 HC095161/HL/NHLBI NIH HHS/United States
- 75N92020D00005/HL/NHLBI NIH HHS/United States
- UL1 TR001079/TR/NCATS NIH HHS/United States
- N01 HC095169/HL/NHLBI NIH HHS/United States
- N01 HC095159/HL/NHLBI NIH HHS/United States
- 75N92020D00003/HL/NHLBI NIH HHS/United States
- UL1 TR001420/TR/NCATS NIH HHS/United States
- 75N92020D00004/HL/NHLBI NIH HHS/United States
- N01 HC095163/HL/NHLBI NIH HHS/United States
- 75N92020D00007/HL/NHLBI NIH HHS/United States
- N01 HC095162/HL/NHLBI NIH HHS/United States
- 75N92020D00006/HL/NHLBI NIH HHS/United States
- N01 HC095165/HL/NHLBI NIH HHS/United States
- N01 HC095164/HL/NHLBI NIH HHS/United States
LinkOut - more resources
Full Text Sources
Medical
