. 2021 Dec:54:101352.
doi: 10.1016/j.molmet.2021.101352. Epub 2021 Oct 6.

Time and metabolic state-dependent effects of GLP-1R agonists on NPY/AgRP and POMC neuronal activity in vivo

Affiliations

Time and metabolic state-dependent effects of GLP-1R agonists on NPY/AgRP and POMC neuronal activity in vivo

Yanbin Dong et al. Mol Metab. 2021 Dec.

Abstract

Objective: Long-acting glucagon-like peptide-1 receptor agonists (GLP-1RAs), like liraglutide and semaglutide, are viable treatments for diabetes and obesity. Liraglutide directly activates hypothalamic proopiomelanocortin (POMC) neurons while indirectly inhibiting Neuropeptide Y/Agouti-related peptide (NPY/AgRP) neurons ex vivo. While temporal control of GLP-1R agonist concentration as well as accessibility to tissues/cells can be achieved with relative ease ex vivo, in vivo this is dependent upon the pharmacokinetics of these agonists and relative penetration into structures of interest. Thus, whether liraglutide or semaglutide modifies the activity of POMC and NPY/AgRP neurons in vivo as well as mechanisms required for any changes in cellular activity remains undefined.

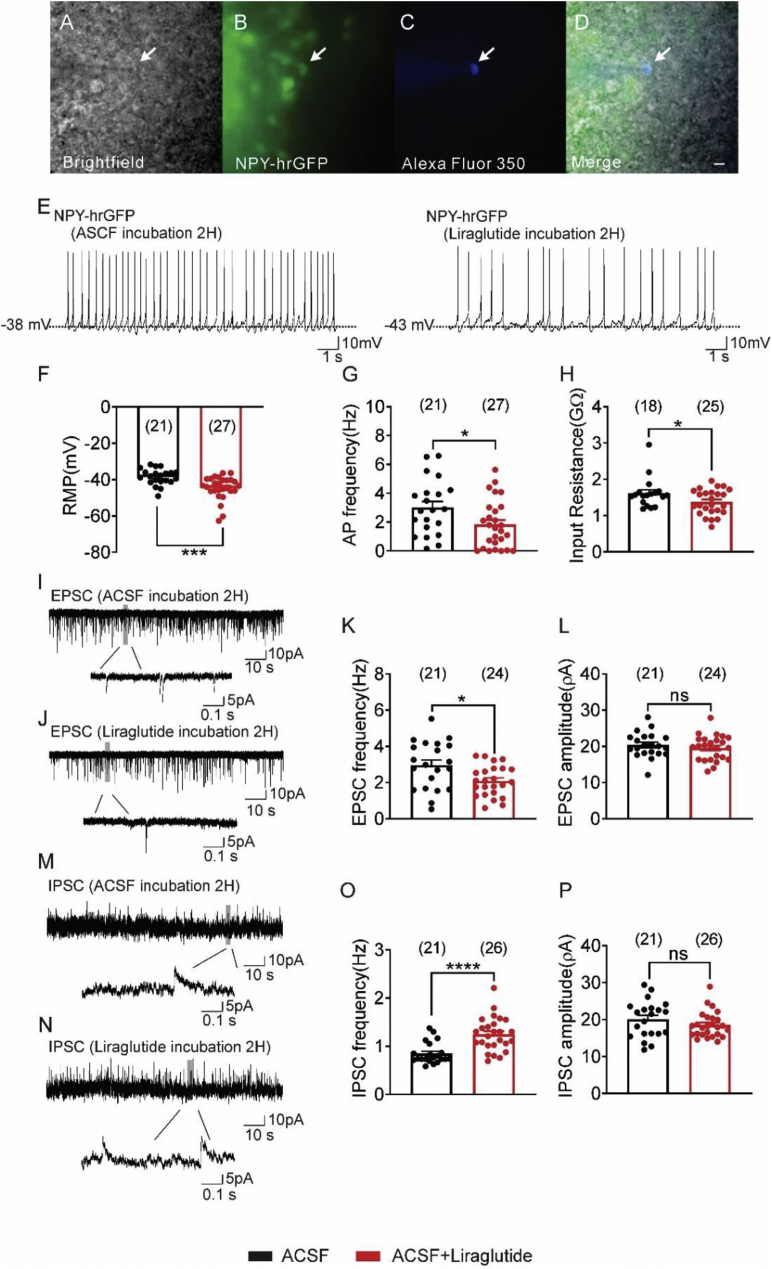
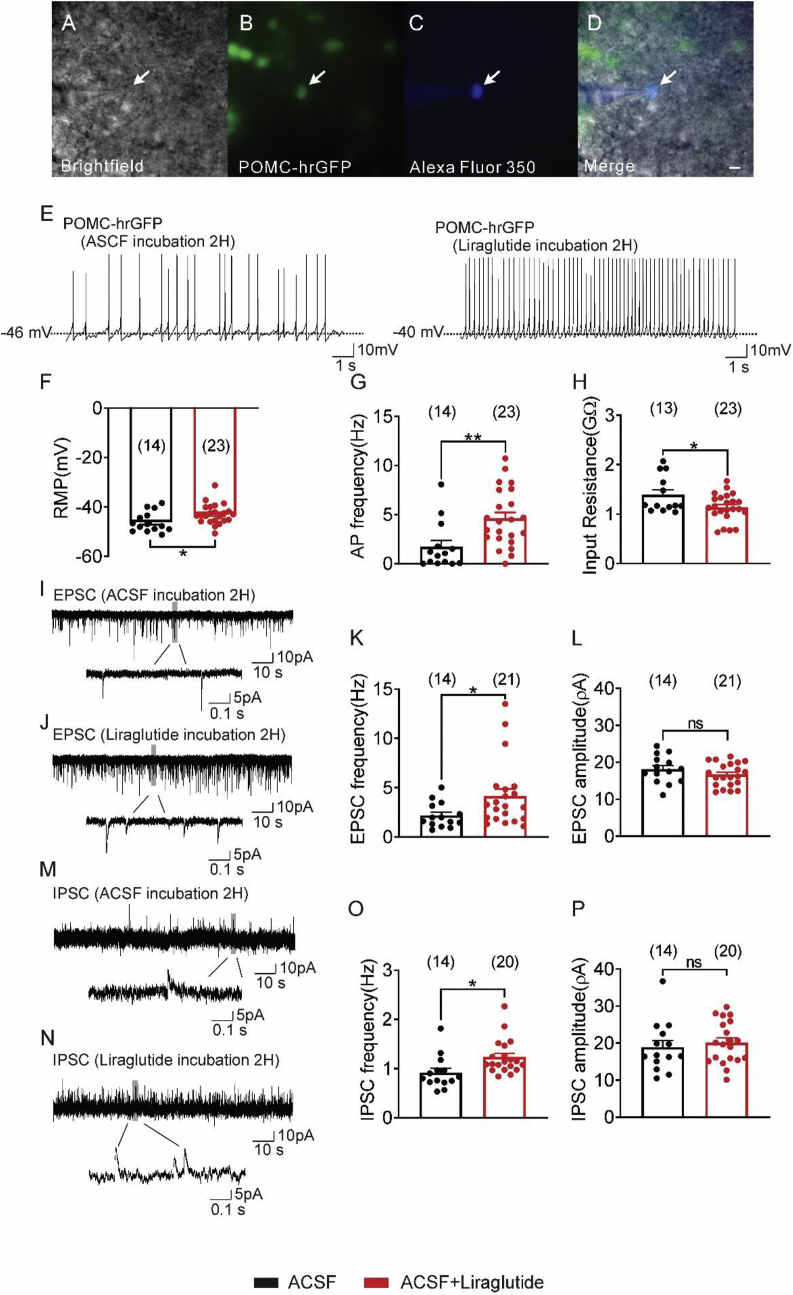
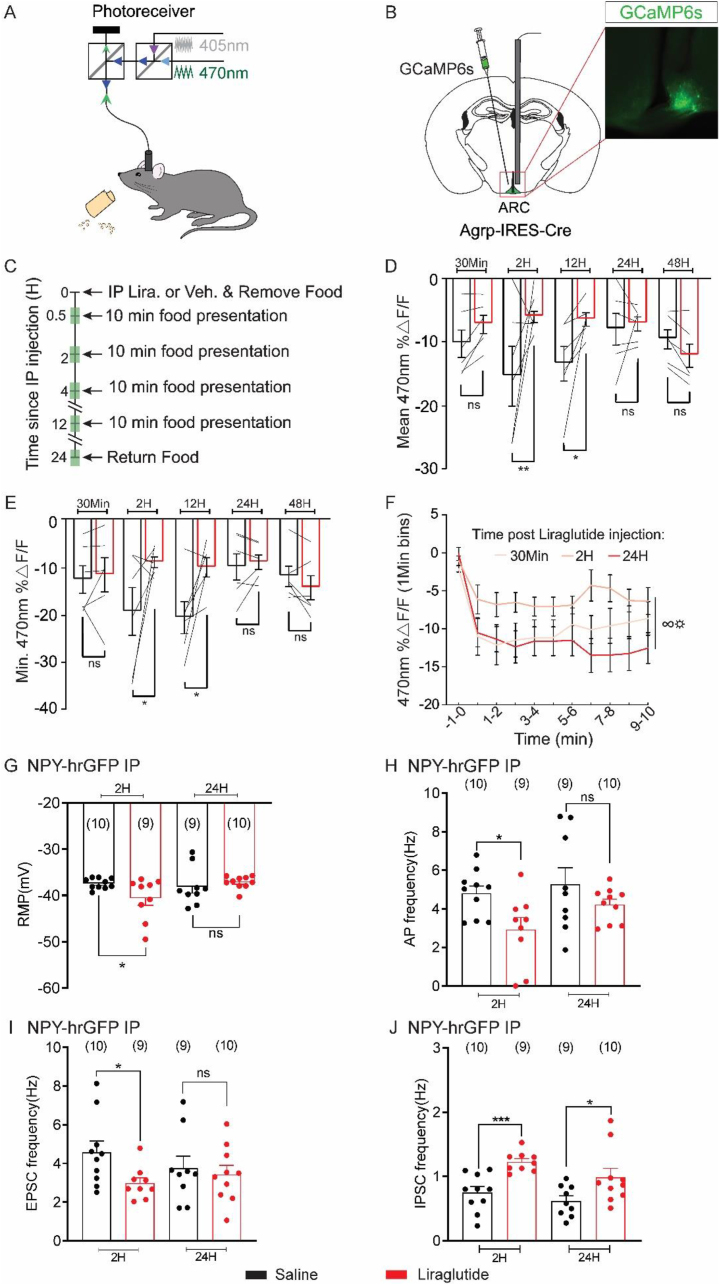
Methods: In order to resolve this issue, we utilized neuron-specific transgenic mouse models to examine changes in the activity of POMC and NPY/AgRP neurons after injection of either liraglutide or semaglutide (intraperitoneal - I.P. and subcutaneous - S·C.). POMC and NPY/AgRP neurons were targeted for patch-clamp electrophysiology as well as in vivo fiber photometry.

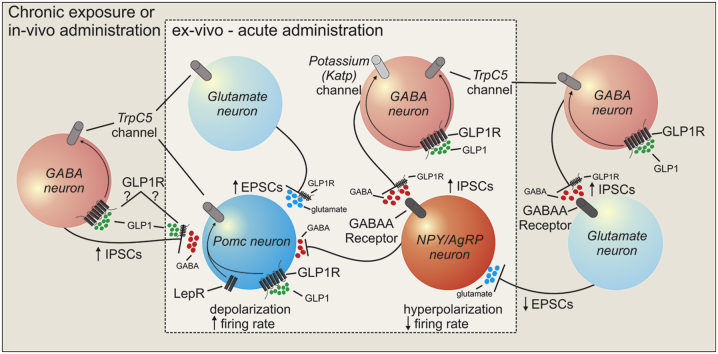
Results: We found that liraglutide and semaglutide directly activate and increase excitatory tone to POMC neurons in a time-dependent manner. This increased activity of POMC neurons required GLP-1Rs in POMC neurons as well as a downstream mixed cation channel comprised of TRPC5 subunits. We also observed an indirect upregulation of excitatory input to POMC neurons originating from glutamatergic cells that also required TRPC5 subunits. Conversely, GLP-1Ra's decreased excitatory input to and indirectly inhibited NPY/AgRP neurons through activation of K-ATP and TRPC5 channels in GABAergic neurons. Notably, the temporal activation of POMC and inhibition of NPY/AgRP neuronal activity after liraglutide or semaglutide was injected [either intraperitoneal (I.P.) or subcutaneous (S·C.)] was dependent upon the nutritional state of the animals (fed vs food-deprived).

Conclusions: Our results support a mechanism of liraglutide and semaglutide in vivo to activate POMC while inhibiting NPY/AgRP neurons, which depends upon metabolic state and mirrors the pharmacokinetic profile of these compounds in vivo.

Keywords: GLP-1R Agonists on NPY/AgRP neuron; Liraglutide and semaglutide; Long-acting glucagon-like peptide-1 receptor agonists (GLP-1RAs); Metabolic state-dependent effects; POMC Neuronal activity; TRPC5 subunit.


Figures

Image 1
Graphical abstract
Figure 1
Figure 1
Incubation (2 h) of hypothalamic slices containing the arcuate with liraglutide inhibits arcuate NPY neurons from ad libitum fed animals. (A–D) NPY-hrGFP neuron: (A) Brightfield illumination of an NPY-hrGFP neuron. (B) Same neuron under FITC (hrGFP). (C) The image shows the complete dialysis of Alexa Fluor 350 from the intracellular pipette. (D) Merged image of targeted NPY-hrGFP neuron. Arrow indicates the targeted cell, Scale bar = 50 μm. (E) Current-clamp recording of an NPY-hrGFP neuron shows the resting membrane potential 2H after incubation with either ACSF or ACSF + liraglutide (1 μM). (F–H) Histogram demonstrating the average resting membrane potential of NPY-hrGFP neurons (F), action potential frequency (G), and input resistance (H) 2 h after incubation with either ACSF or ACSF + liraglutide. (I–J) Voltage clamp recording (Vm = −70 mV) of sEPSCs from NPY-hrGFP neurons 2H after incubation with ACSF (I) or ACSF + liraglutide (J). (K–L) Plots indicating the decreased sEPSCs frequency (Hz) and independent of changes in amplitude (pA) in NPY-hrGFP neurons 2H after incubation with liraglutide compared with control ACSF group. (M–N) Voltage clamp recording (Vm = −15 mV) of sIPSCs from NPY-hrGFP neurons 2H after incubation with ACSF (M) or ACSF + liraglutide (N). (O–P) Plots showing an increased sIPSCs frequency (Hz) and no change in amplitude (pA) in arcuate NPY-hrGFP neurons 2 h after incubation with liraglutide compared with the control group (black bar: ACSF; red bar: ACSF + liraglutide). Data are taken from male mice and are expressed as mean ± SEM. ∗p < 0.05, ∗∗∗p < 0.001, ∗∗∗∗p < 0.0001, unpaired t-test compared to controls. The number of neurons studied for each group is in parentheses.
Figure 2
Figure 2
Incubation (2 h) of hypothalamic slices containing the arcuate with liraglutide activates arcuate POMC neurons from ad libitum fed animals. (A–D) POMC-hrGFP neuron: (A) Brightfield illumination of POMC-hrGFP neuron. (B) Same neuron under FITC (hrGFP). (C) The image shows the complete dialysis of Alexa Fluor 350 from the intracellular pipette. (D) Merged image of targeted POMC-hrGFP neuron. Arrow indicates the targeted cell, Scale bar = 50 μm. (E) Current-clamp recording of a POMC-hrGFP neuron shows the resting membrane potential 2 h after incubation with ACSF or ACSF + liraglutide (1 μM). (F–H) Histogram demonstrating the average resting membrane potential of POMC-hrGFP neurons (F), action potential frequency (G), and input resistance (H) 2 h after incubation with ACSF or ACSF + liraglutide. (I–J) Voltage clamp recording (Vm = −70 mV) of sEPSCs from POMC-hrGFP neurons 2 h after incubation with ACSF (I) or ACSF + liraglutide (J). (K–L) Plots demonstrating an increased sEPSCs frequency (Hz) and independent of changes in amplitude (pA) in arcuate POMC-hrGFP neurons 2 h after incubation with liraglutide compared with the control group. (M–N) Voltage clamp recording (Vm = −15 mV) of sIPSCs in POMC-hrGFP neurons 2 h after incubation with ACSF (M) or ACSF + liraglutide (N). (O–P) Plots indicating an increased sIPSCs frequency (Hz) and no change in amplitude (pA) in arcuate POMC-hrGFP neurons 2 h after incubation with liraglutide compared with the control group (black bar: ACSF; red bar: ACSF + liraglutide). Data are from male mice and are expressed as mean ± SEM. ∗p < 0.05, ∗∗p < 0.01, unpaired t-test compared to controls. The number of neurons studied for each group is in parentheses.
Figure 3
Figure 3
Intraperitoneal (I.P.) injection of liraglutide inhibits arcuate NPY neurons from ad libitum fed mice. (A–G) Histogram demonstrating the average resting membrane potential (A), action potential frequency (B), input resistance (C), sEPSCs frequency (D), sEPSCs amplitude (E), sIPSCs frequency (F), and sIPSCs amplitude (G) of NPY-hrGFP neurons 30 min, 2 h, 12 h, 24 h or 48 h after injection saline or liraglutide (black bar: saline; red bar: liraglutide, 300 μg/kg, I.P.). Data are from male mice and are expressed as mean ± SEM. ∗p < 0.05, ∗∗p < 0.01, ∗∗∗p < 0.001, ∗∗∗∗p < 0.0001, unpaired t test compared to controls. The number of neurons studied for each group is in parentheses.
Figure 4
Figure 4
Intraperitoneal (i.p.) injection of liraglutide activates arcuate POMC neurons from ad libitum fed mice. (A–G) Histogram demonstrating the average resting membrane potential (A), action potential frequency (B), input resistance (C), sEPSCs frequency (D), sEPSCs amplitude (E), sIPSCs frequency (F), and sIPSCs amplitude (G) of POMC-hrGFP neurons 30 Min, 2 h, 12 h, 24 h or 48 h after injection saline or liraglutide (black bar: saline; red bar: liraglutide, 300 μg/kg, I.P.). Data are from male mice and are expressed as mean ± SEM. ∗p < 0.05, ∗∗p < 0.01, ∗∗∗p < 0.001, ∗∗∗∗p < 0.0001, unpaired t test compared to controls. The number of neurons studied for each group is in parentheses.
Figure 5
Figure 5
Liraglutide-induced activation of arcuate POMC neurons in vivo requires GLP-1 receptors and TRPC5 subunits in arcuate POMC neurons. (A–G) Histogram demonstrating the average resting membrane potential of POMC-hrGFP neurons (A), action potential frequency (B), input resistance (C), sEPSCs frequency (D), sEPSCs amplitude (E), sIPSCs frequency (F), sIPSCs amplitude (G) 24 h after injection of saline or liraglutide (300 μg/kg, I.P.) from mice deficient for GLP-1Rs in POMC neruons (POMC-CreERT2:GLP-1Rlox/lox:tdTomato mice). (H–N) Histogram demonstrating the average resting membrane potential of POMC-hrGFP neurons (H), action potential frequency (I), input resistance (J), sEPSCs frequency (K), sEPSCs amplitude (L), sIPSCs frequency (M), sIPSCs amplitude (N) 24 h after injection of saline or liraglutide (300 μg/kg, I.P.) from mice globally deficient for TRPC5 subunits (POMC-hrGFP:TRPC5 KO mice). (O–U) Histogram demonstrating the average resting membrane potential of POMC-hrGFP neurons (O), action potential frequency (P), input resistance (Q), sEPSCs frequency (R), sEPSCs amplitude (S), sIPSCs frequency (T), sIPSCs amplitude (U) 24 h after injection of saline or liraglutide (300 μg/kg, I.P.) from mice deficient for TRPC5 subunits in POMC neurons (POMC-CreERT2:TRPC5lox/lox:tdTomato mice). Data are from male mice and are expressed as mean ± SEM. ∗p < 0.05, unpaired t test compared to controls (black bar: saline; red bar: liraglutide). The number of neurons studied for each group is in parentheses.
Figure 6
Figure 6
The Liraglutide-induced increase in inhibitory synaptic input to arcuate NPY neurons in vivo requires ATP-sensitive potassium channels (K-ATP) and TRPC5 subunits. (A–B) Histogram demonstrating the sIPSCs frequency (A) sIPSCs amplitude (B), sEPSC frequency (C), and sEPSC amplitude (D) of NPY neurons from of NPY-hrGFP:TRPC5 KO mice 24 h after injection of saline or liraglutide (300 μg/kg, I.P.). The Katp channel activator, diazoxide, or the GABA-A receptor antagonist, picrotoxin, was added to the recording chamber for some experiments (black bar: saline; red bar: liraglutide; green bar: liraglutide + diazoxide; blue bar: liraglutide + picrotoxin). Data are from male mice and are expressed as mean ± SEM and analyzed by two-way ANOVA with Tukey's post hoc test compared to controls, ∗∗∗∗p < 0.0001. The number of neurons studied for each group is in parentheses.
Figure 7
Figure 7
Liraglutide attenuates AgRP neuron activity changes in response to food in 24H food-deprived animals. (A) Schema depicting the fiber photometry system used to record calcium-dependent (470 nm) and independent (405 nm) fluorescence in awake, behaving mice. (B) Schematic and representative image showing GCaMP6s expression and fiber placement over AgRP neurons in the arcuate nucleus. Scale bar, 200 μm. (C) Timeline depicting experimental procedures. Shaded green areas represent fiber photometry recordings. (D) Mean ΔF/F of the 470 nm GCaMP6s signal following food presentation at various timepoints after vehicle or Liraglutide injection (see C). Thin black lines represent individual mice. Black, vehicle; red, Liraglutide (n = 6, two-way repeated-measures ANOVA, ∗p < 0.05) (E) Minimum ΔF/F of the GCaMP6s signal following food presentation at various timepoints after vehicle or Liraglutide injection. Black, vehicle; red, Liraglutide (n = 6, two-way repeated-measures ANOVA, ∗p < 0.05) (F) Mean ΔF/F (1 min bins) of the GCaMP6s signal following food presentation at various timepoints after Liraglutide injection (n = 6, two-way repeated-measures ANOVA, p < 0.05). (G-J) Histogram demonstrating the average resting membrane potential (G), action potential frequency (H), sEPSCs frequency (I), and sIPSCs frequency (J) of NPY-hrGFP neurons at 2 h and 24 h after injection with saline or liraglutide (black bar: saline; red bar: liraglutide, 300 μg/kg, I.P.). Data are expressed as mean ± SEM, ns p > 0.05, t-tests and post-hoc comparisons: ∗p < 0.05, ∗∗p < 0.01, ∗∗∗p < 0.001. ANOVA interaction: ∞p < 0.05, ANOVA main effect of group: ☼p < 0.05.
Figure 8
Figure 8
Long-term effects of Liraglutide on AgRP neurons during mild food deprivation. (A) Timeline depicting experimental procedure. The shaded green area represents fiber photometry recording. (B) Average ΔF/F of GCaMP6s signals during food presentation 24 h after I.P. injection of vehicle or liraglutide. Signals are aligned to food presentation (red dashed line). Green, 470 nm; grey, 405 nm. Dark lines represent means and lighter, shaded areas represent SEM. (C) Mean ΔF/F of the 470 nm GCaMP6s signals shown in (B). Thin black lines represent individual mice. Black, vehicle; red, Liraglutide (n = 6, paired t-test, ∗p < 0.05). (D) Minimum ΔF/F of the 470 nm GCaMP6s signals shown in (B). Black, vehicle; red, Liraglutide (n = 6, paired t-test, ∗p < 0.05). Data are expressed as mean ± SEM, t-tests: ∗p < 0.05.

References

    1. Kreymann B., Williams G., Ghatei M.A., Bloom S.R. Glucagon-like peptide-1 7-36: a physiological incretin in man. Lancet. 1987;2:1300–1304. - PubMed
    1. Larsen P.J., Tang-Christensen M., Holst J.J., Orskov C. Distribution of glucagon-like peptide-1 and other preproglucagon-derived peptides in the rat hypothalamus and brainstem. Neuroscience. 1997;77:257–270. - PubMed
    1. Mojsov S., Weir G.C., Habener J.F. Insulinotropin: glucagon-like peptide I (7-37) co-encoded in the glucagon gene is a potent stimulator of insulin release in the perfused rat pancreas. Journal of Clinical Investigation. 1987;79:616–619. - PMC - PubMed
    1. Drucker D.J. Mechanisms of action and therapeutic application of glucagon-like peptide-1. Cell Metabolism. 2018;27:740–756. - PubMed
    1. Holst J.J. From the incretin concept and the discovery of GLP-1 to today's diabetes therapy. Frontiers in Endocrinology. 2019;10:260. - PMC - PubMed

Publication types