. 2021 Oct 9;9(1):36.
doi: 10.1186/s40170-021-00274-5.

Breast cancer growth and proliferation is suppressed by the mitochondrial targeted furazano[3,4-b]pyrazine BAM15

Affiliations

Breast cancer growth and proliferation is suppressed by the mitochondrial targeted furazano[3,4-b]pyrazine BAM15

Elizabeth R M Zunica et al. Cancer Metab. .

Abstract

Background: Enhanced metabolic plasticity and diversification of energy production is a hallmark of highly proliferative breast cancers. This contributes to poor pharmacotherapy efficacy, recurrence, and metastases. We have previously identified a mitochondrial-targeted furazano[3,4-b]pyrazine named BAM15 that selectively reduces bioenergetic coupling efficiency and is orally available. Here, we evaluated the antineoplastic properties of uncoupling oxidative phosphorylation from ATP production in breast cancer using BAM15.

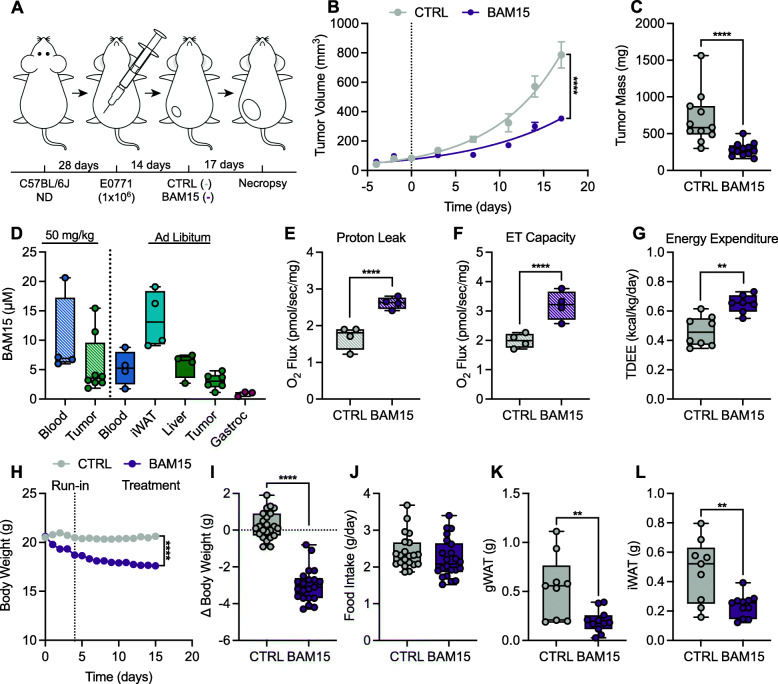
Methods: The anticancer effects of BAM15 were evaluated in human triple-negative MDA-MB-231 and murine luminal B, ERα-negative EO771 cells as well as in an orthotopic allograft model of highly proliferative mammary cancer in mice fed a standard or high fat diet (HFD). Untargeted transcriptomic profiling of MDA-MB-231 cells was conducted after 16-h exposure to BAM15. Additionally, oxidative phosphorylation and electron transfer capacity was determined in permeabilized cells and excised tumor homogenates after treatment with BAM15.

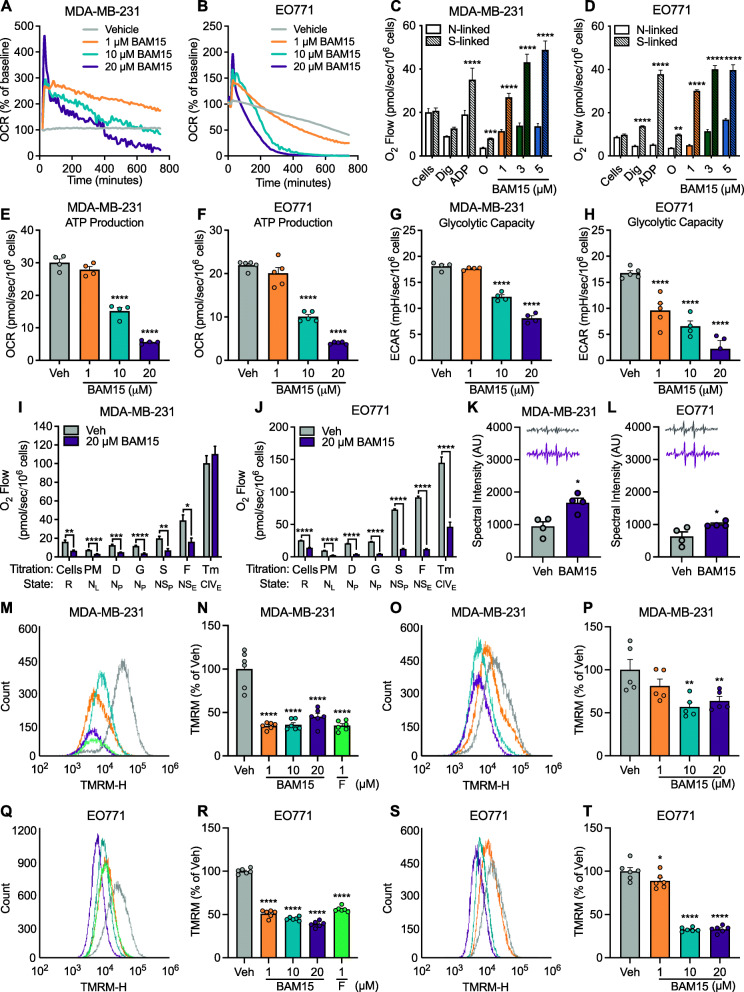
Results: BAM15 increased proton leak and over time, diminished cell proliferation, migration, and ATP production in both MDA-MB-231 and EO771 cells. Additionally, BAM15 decreased mitochondrial membrane potential, while inducing apoptosis and reactive oxygen species accumulation in MDA-MB-231 and EO771 cells. Untargeted transcriptomic profiling of MDA-MB-231 cells further revealed inhibition of signatures associated with cell survival and energy production by BAM15. In lean mice, BAM15 lowered body weight independent of food intake and slowed tumor progression compared to vehicle-treated controls. In HFD mice, BAM15 reduced tumor growth relative to vehicle and calorie-restricted weight-matched controls mediated in part by impaired cell proliferation, mitochondrial respiratory function, and ATP production. LC-MS/MS profiling of plasma and tissues from BAM15-treated animals revealed distribution of BAM15 in adipose, liver, and tumor tissue with low abundance in skeletal muscle.

Conclusions: Collectively, these data indicate that mitochondrial uncoupling may be an effective strategy to limit proliferation of aggressive forms of breast cancer. More broadly, these findings highlight the metabolic vulnerabilities of highly proliferative breast cancers which may be leveraged in overcoming poor responsiveness to existing therapies.

Keywords: BAM15; Breast cancer; Cell proliferation; Mitochondrial function; Tumor metabolism.


Conflict of interest statement

K.L.H. is an equity holder in Life Biosciences, a company that has commercial interest in mitochondrial uncouplers as therapeutics. All other authors declare no competing financial interests.

Figures

Fig. 1
Fig. 1
BAM15 mediated mitochondrial uncoupling reduces cell viability, proliferation, and migration in MDA-MB-231 and EO771 cells. Change in cellular proliferation over 4.5 days of continuous exposure to varying concentrations of BAM15 in A MDA-MB-231 (N=10 for Veh, 2.5, 5, and 10 1 μM BAM15, N=11 for 0.5 and 1 μM BAM15, N=12 for 15 and 20 μM BAM15) and B EO771 cells (N=10 per condition). Wound healing rate after continuous exposure to varying concentrations of BAM15 in C MDA-MB-231 (N=3 per condition) and D EO771 cells (N=6 per condition). Caspase 3/7 activity after 16-h exposure to varying concentrations of BAM15 in E MDA-MB-231 cells and F EO771 cells (N=12 per condition). Inhibition of cell viability (IC50,) after 24-h continuous exposure to varying concentrations of BAM15, doxorubicin, or cyclophosphamide in G MDA-MB-231 cells and H EO771 cells (N=12 per condition). Panels A, B, C, D, E, and F are shown as the mean ± SEM and were assessed by one-way ANOVA with Tukey’s multiple comparisons. **p<0.01, ***p<0.001,****p<0.0001. Abbreviations: IC50, half maximal inhibitory concentration
Fig. 2
Fig. 2
BAM15 reduces the expression of genes required for cellular proliferation and energy production in MDA-MB-231 cells. A Principal component analysis of cells exposed to 16 h vehicle or 20 μM BAM15. B Volcano plot illustration of genes differentially expressed by BAM15. C Heat map visualization of top 30 differentially regulated genes. Differentially regulated transcripts were filtered based on the following criteria: q<0.05, base mean>30, and fold change>1.5. DG Enrichment analysis of canonical signaling pathways differentially regulated by BAM15. Circles (top x-axis) represent the ratio of differentially expressed genes relative to the total number of genes in a given signaling pathway. Bars (bottom x-axis) represent the probability of pathway activation or inactivation based upon differential gene expression patterns. Bar colors represent the directional Z-score generated from pathway enrichment analysis
Fig. 3
Fig. 3
BAM15 reduces OXPHOS and glycolytic capacity via ΔΨm destabilization in MDA-MB-231 and EO771 cells. Oxygen consumption rates following acute injection of varying concentrations of BAM15 in A MDA-MB-231 (Veh N=5, 1 μM BAM15 N=5, 10 μM BAM15 N=3, 20 μM BAM15 N=4) and B EO771 cells (Veh N=6 per condition). Respiration supported by malate, pyruvate, and glutamate (N-linked), or succinate (S-linked) in the presence of ADP, oligomycin, and varying concentrations of BAM15 in digitonin-permeabilized cells in C MDA-MB-231 (N=6 per condition) and D EO771 cells (N=4 per condition). ATP-linked respiration in E MDA-MB-231 and F EO771 cells (N=4 per condition). Maximal glycolytic rate in G MDA-MB-231 and H EO771 cells the presence of glucose and oligomycin (N=4 per condition for MDA-MB-231; N=5 per condition for EO771 cells) following 16-h exposure to vehicle or varying concentrations of BAM15. Respiration supported by malate, pyruvate, glutamate, and succinate in the presence of ADP, FCCP, and ascorbate/TMPD after 16-h exposure to vehicle or 20 μM BAM15 in digitonin-permeabilized I MDA-MB-231 (N=8 per condition) and J EO771 cells (N=4 per condition). Superoxide production following 16-h exposure to vehicle or 20 μM BAM15 in K MDA-MB-231 (N=4 per condition) and L EO771 cells (N =4 per condition). M Representative flow cytometry plot, and N quantification of TMRM florescence after acute exposure to varying concentrations of BAM15 or FCCP (N=6 per condition) and O, P chronic exposure to varying concentrations of BAM15 (N=5 per condition) in MDA-MB-231 cells. Q Representative flow cytometry plot, and R quantification of TMRM florescence after acute exposure to varying concentrations of BAM15 or FCCP (N=6 per condition) and S, T chronic exposure to varying concentrations of BAM15 (N=6 per condition) in EO771 cells. Data are shown as the mean ± SEM. *p<0.05, **p<0.01, ***p<0.001, ****p<0.0001. Panels C, D, E, F, G, H, K, L, N, P, R, and T were assessed by one-way ANOVA with Tukey’s multiple comparisons. Panels A, B, I, and J were assessed by two-way repeated measures ANOVA with Sidak’s multiple comparisons. Abbreviations: OCR, oxygen consumption rate; ECAR, extra-cellular acidification rate; Dig, digitonin; ADP, adenosine 5′-diphosphate; O, oligomycin; PM, pyruvate and malate; G, glutamate; S, succinate; FCCP, Carbonyl cyanide-4-(trifluoromethoxy)phenylhydrazone; TMPD, tetramethyl-p-phenylene diamine; TMRM, tetramethylrhodamine methyl ester
Fig. 4
Fig. 4
BAM15 suppresses tumor growth in lean C57BL/6J mice. A Schematic illustration of the experimental design. B Tumor volumes over the treatment period and C terminal tumor mass (CTRL N=11, BAM15 N=12). D BAM15 concentrations in plasma (N=4) and tumor (N=8) 1 h after an acute gavage of 50 mg/kg of BAM15 at time of necropsy and plasma and tissue after ad libitum access to BAM15 diet (plasma, iWAT, and liver N=4, tumor N=6, and gastrocnemius N=3). E Proton leak and F ET capacity in tumors 1 h after an acute gavage of 50 mg/kg of BAM15 (N=4 per condition). G Total daily energy expenditure in mice over the last 7 days of treatment (CTRL N=8, BAM15 N=7). H Body weight over the treatment period and I change in body weight from treatment start (CTRL N=23 and BAM15 N=21). J Food intake averaged over the treatment period (CTRL N=21 and BAM15 N=22). K Terminal gWAT weight and L iWAT weight (CTRL N=9, BAM15 N=11). Data are shown as a box (mean ± 5–95% CI) and whiskers (minimum to maximum) except for B and H which are displayed as the mean ± SEM. *p<0.05, **p<0.01, ***p<0.001, ****p<0.0001. Panels B and H were assessed by two-way repeated measures ANOVA with Tukey’s multiple comparisons. Panels C, D, E, F, G, I, J, K, and L were assessed by one-way ANOVA with Tukey’s multiple comparisons. Panel H was assessed by extra sum-of-squares F test. Abbreviations: CTRL, control; TDEE, total daily energy expenditure; gWAT, gonadal white adipose tissue; iWAT, inguinal white adipose tissue; gastroc, gastrocnemius
Fig. 5
Fig. 5
BAM15 suppresses tumor growth in C57BL/6J mice fed a high fat diet. A Schematic illustration of the experimental design. B Tumor volumes over the treatment period and C terminal tumor mass (CTRL N=5, BAM15 N=7, and CR N=5). D BAM15 distribution in tissue and plasma at time of necropsy (N=6 for plasma, N=7 for tissues). E Body weight over the treatment period and F change in body weight from treatment start (CTRL N=5, BAM15 N=7, and CR N=5). G Food intake averaged over the treatment period (CTRL N=5, BAM15 N=7, and CR N=5). H Total fat mass (CTRL N=5, BAM15 N=7, and CR N=5). I Terminal gWAT weight (CTRL N=5, BAM15 N=7, and CR N=5). J Plasma glucose and K lactate concentrations at time of necropsy (N=4 per group). Data are shown as box (mean ± 5-95% CI) and whiskers (minimum to maximum) with exception to panels B and E which are displayed as mean ± SEM. *p<0.05, **p<0.01, ***p<0.001, ****p<0.0001. Panels B and E were assessed by two-way repeated measures ANOVA with Tukey’s multiple comparisons. Panels C, D, F, G, H, I, J, and K were assessed by one-way ANOVA with Tukey’s multiple comparisons. Abbreviations: CTRL, control; CR, calorie restriction; gWAT, gonadal white adipose tissue; gastroc, gastrocnemius
Fig. 6
Fig. 6
BAM15 reduces tumor growth in vivo by limiting proliferation and mitochondrial function. A Representative H&E (scale = 100 μm), Ki67+ (scale = 100 μm), and TUNEL (scale = 100 μm) staining and quantification of B Ki67+ and C TUNEL staining in tumor sections (CTRL N=4, BAM15 N=5, CR N=5). D ADP stimulated respiration (OXPHOS) and FCCP stimulated respiration (ET) supported by pyruvate, malate, glutamate (N-linked), and E succinate (NS-linked), (CTRL N=5, BAM15 N=7, CR N=5). F FCCP stimulated respiration in the presence of ascorbate/TMPD (Complex IV ET) (CTRL N=5, BAM15 N=7, CR N=5). G Enzymatic activity of citrate synthase (CTRL N=5, BAM15 N=6, CR N=5). H ATP content (CTRL N=5, BAM15 N=6, CR N=5) and I ATP production derived from NS-linked OXPHOS (CTRL N=5, BAM15 N=6, CR N=5). J Hydrogen peroxide (H2O2) activity in tumor homogenates (CTRL N=3, BAM15 N=4, CR N=4). Data are shown as the mean ± SEM. *p<0.05, **p<0.01, ***p<0.001. Panels B, C, D, E, F, G, H, I, and J were assessed by one-way ANOVA with Tukey’s multiple comparisons. Abbreviations: CTRL, control; CR, calorie restriction; H&E, Hematoxylin and Eosin; Hm, homogenate; PM, pyruvate and malate; D, ADP; G, glutamate; c, cytochrome c; S, succinate; U, uncoupler (FCCP); Rot, rotenone; AmA, antimycin A; As, ascorbate; TMPD, tetramethyl-p-phenylenediamine dihydrochloride; Azd, sodium azide; H2O2, hydrogen peroxide

References

    1. Siegel RL, Miller KD, Jemal A. Cancer statistics, 2020. CA: A Cancer Journal for Clinicians. 2020;70(1):7–30. doi: 10.3322/caac.21590. - DOI - PubMed
    1. Brown M, Tsodikov A, Bauer KR, Parise CA, Caggiano V. The role of human epidermal growth factor receptor 2 in the survival of women with estrogen and progesterone receptor-negative, invasive breast cancer: the California Cancer Registry, 1999-2004. Cancer. 2008;112(4):737–747. doi: 10.1002/cncr.23243. - DOI - PubMed
    1. Dent R, Trudeau M, Pritchard KI, Hanna WM, Kahn HK, Sawka CA, Lickley LA, Rawlinson E, Sun P, Narod SA. Triple-negative breast cancer: clinical features and patterns of recurrence. Clin Cancer Res. 2007;13(15 Pt 1):4429–4434. doi: 10.1158/1078-0432.CCR-06-3045. - DOI - PubMed
    1. Foulkes WD, Smith IE, Reis-Filho JS. Triple-negative breast cancer. N Engl J Med. 2010;363(20):1938–1948. doi: 10.1056/NEJMra1001389. - DOI - PubMed
    1. Carey LA, Perou CM, Livasy CA, Dressler LG, Cowan D, Conway K, Karaca G, Troester MA, Tse CK, Edmiston S, Deming SL, Geradts J, Cheang MCU, Nielsen TO, Moorman PG, Earp HS, Millikan RC. Race, breast cancer subtypes, and survival in the Carolina Breast Cancer Study. Jama. 2006;295(21):2492–2502. doi: 10.1001/jama.295.21.2492. - DOI - PubMed