

Relating SARS-CoV-2 shedding rate in wastewater to daily positive tests data: A consistent model based approach
- PMID: 34627900
- PMCID: PMC8497956
- DOI: 10.1016/j.scitotenv.2021.150838
Relating SARS-CoV-2 shedding rate in wastewater to daily positive tests data: A consistent model based approach
Abstract
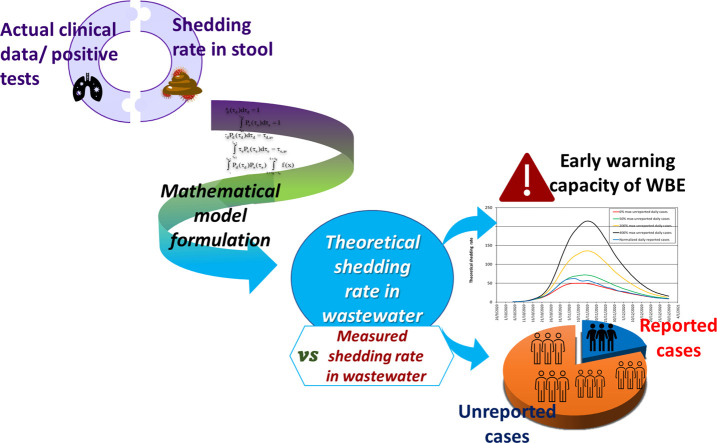
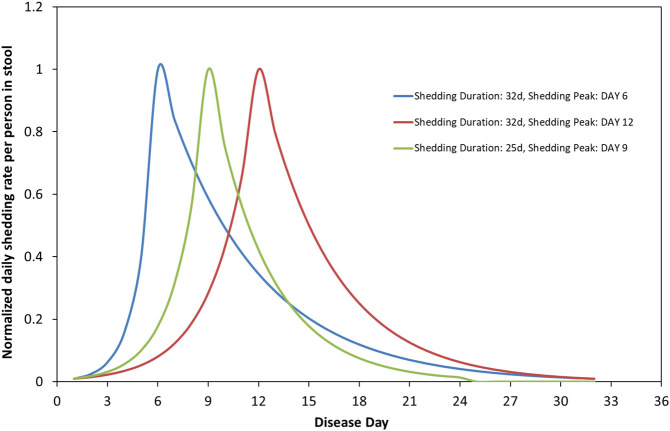
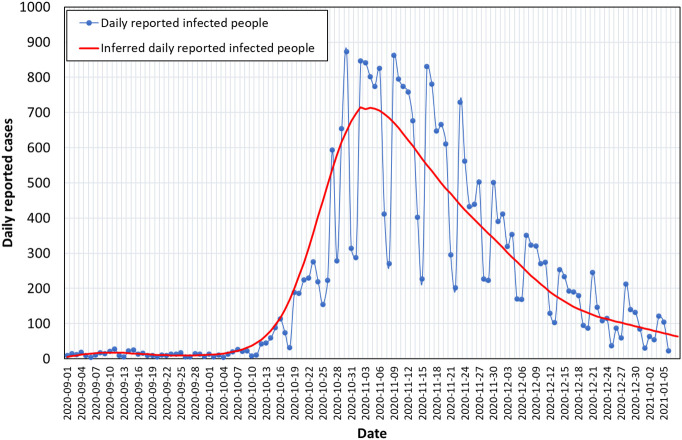
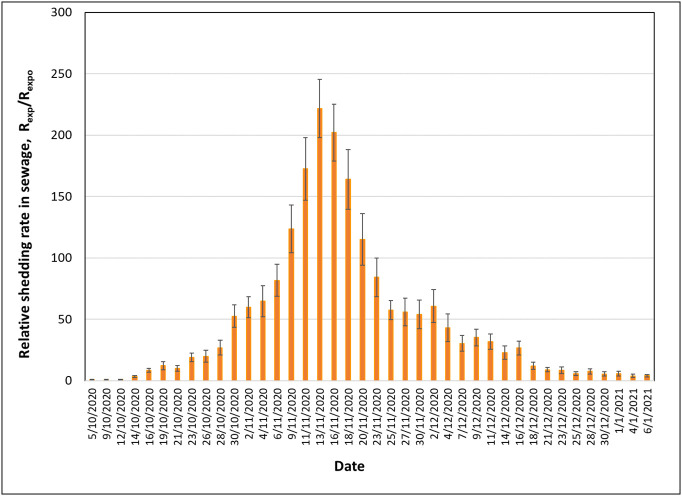
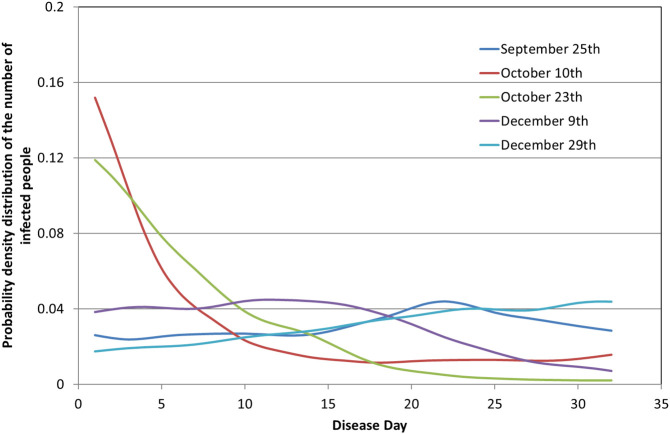
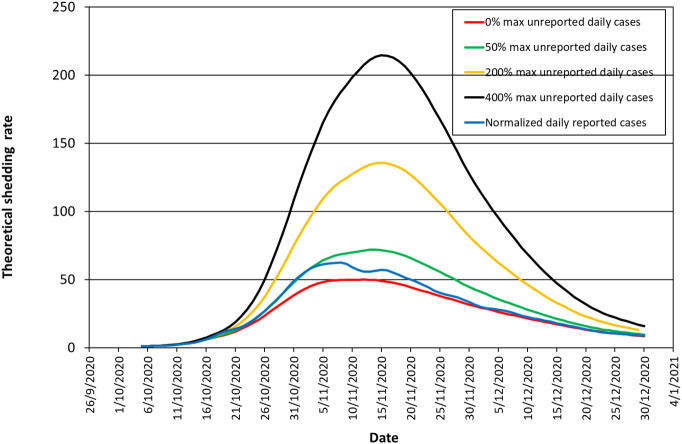
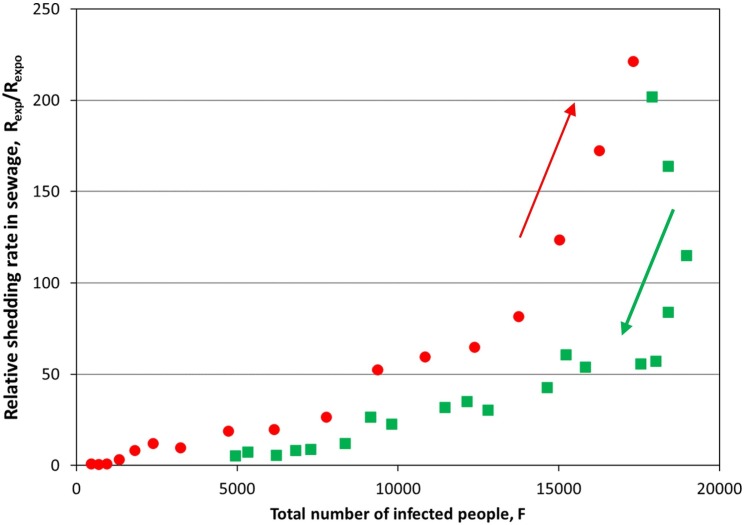
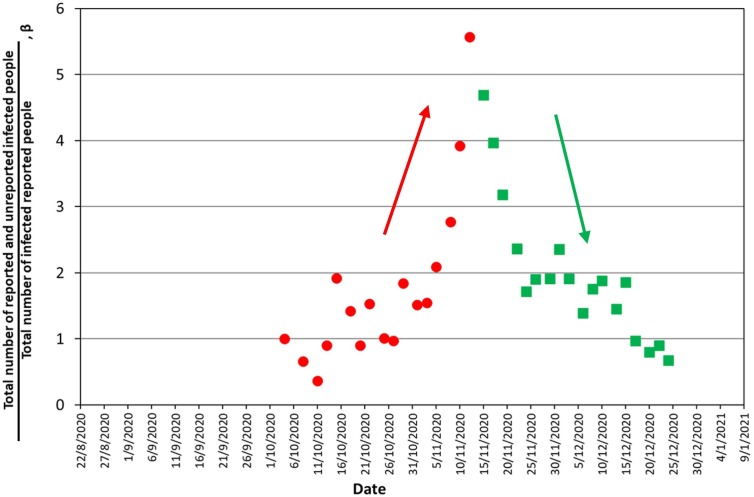
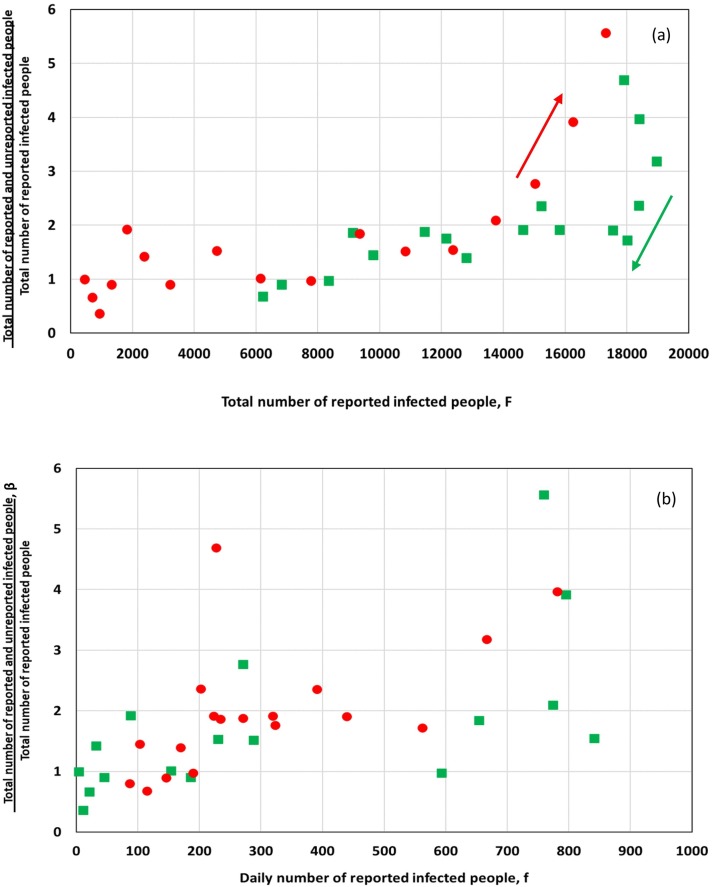
During the COVID-19 pandemic, wastewater-based epidemiology (WBE) has been engaged to complement medical surveillance and in some cases to also act as an early diagnosis indicator of viral spreading in the community. Most efforts worldwide by the scientific community and commercial companies focus on the formulation of protocols for SARS-CoV-2 analysis in wastewater and approaches addressing the quantitative relationship between WBE and medical surveillance are lacking. In the present study, a mathematical model is developed which uses as input the number of daily positive medical tests together with the highly non-linear shedding rate curve of individuals to estimate the evolution of global virus shedding rate in wastewater along calendar days. A comprehensive parametric study by the model using as input actual medical surveillance and WBE data for the city of Thessaloniki (~700,000 inhabitants, North Greece) during the outbreak of November 2020 reveals the conditions under which WBE can be used as an early warning tool for predicting pandemic outbreaks. It is shown that early warning capacity is different along the days of an outbreak and depends strongly on the number of days apart between the day of maximum shedding rate of infected individuals in their disease cycle and the day of their medical testing. The present data indicate for Thessaloniki an average early warning capacity of around 2 days. Moreover, the data imply that there exists a proportion between unreported cases (asymptomatic persons with mild symptoms that do not seek medical advice) and reported cases. The proportion increases with the number of reported cases. The early detection capacity of WBE improves substantially in the presence of an increasing number of unreported cases. For Thessaloniki at the peak of the pandemic in mid-November 2020, the number of unreported cases reached a maximum around 4 times the number of reported cases.
Copyright © 2021 The Authors. Published by Elsevier B.V. All rights reserved.
Conflict of interest statement
Declaration of competing interest The authors declare that they have no known competing financial interests or personal relationships that could have appeared to influence the work reported in this paper.
Figures

References
-
- Ahmed W., Angel N., Edson J., Bibby K., Bivins A., O’Brien J.W., Choi P.M., Kitajima M., Simpson S.L., Li J., Tscharke B., Verhagen R., Smith W.J.M., Zaugg J., Dierens L., Hugenholtz P., Thomas K.V., Mueller J.F. First confirmed detection of SARS-CoV-2 in untreated wastewater in Australia: a proof of concept for the wastewater surveillance of COVID-19 in the community. Sci. Total Environ. 2020;728 doi: 10.1016/j.scitotenv.2020.138764. - DOI - PMC - PubMed
-
- CDC . Center for Disease Control and Prevention, CDC; 2021. CDC [WWW document]https://www.cdc.gov/coronavirus/2019-ncov/cases-updates/wastewater-surve... URL. (accessed 3.10.21)
-
- Corman V.M., Landt O., Kaiser M., Molenkamp R., Meijer A., Chu D.K.W., Bleicker T., Brünink S., Schneider J., Schmidt M.L., Mulders D.G.J.C., Haagmans B.L., van der Veer B., van den Brink S., Wijsman L., Goderski G., Romette J.L., Ellis J., Zambon M., Peiris M., Goossens H., Reusken C., Koopmans M.P.G., Drosten C. Detection of 2019 novel coronavirus (2019-nCoV) by real-time RT-PCR. Eurosurveillance. 2020;25 doi: 10.2807/1560-7917.ES.2020.25.3.2000045. - DOI - PMC - PubMed
MeSH terms
Substances
LinkOut - more resources
Full Text Sources
Medical
Miscellaneous
