. 2021 Oct:72:103618.
doi: 10.1016/j.ebiom.2021.103618. Epub 2021 Oct 7.

Synovial tissue from sites of joint pain in knee osteoarthritis patients exhibits a differential phenotype with distinct fibroblast subsets

Affiliations

Synovial tissue from sites of joint pain in knee osteoarthritis patients exhibits a differential phenotype with distinct fibroblast subsets

Dominika E Nanus et al. EBioMedicine. 2021 Oct.

Abstract

Background: Synovial inflammation is associated with pain severity in patients with knee osteoarthritis (OA). The aim here was to determine in a population with knee OA, whether synovial tissue from areas associated with pain exhibited different synovial fibroblast subsets, compared to synovial tissue from sites not associated with pain. A further aim was to compare differences between early and end-stage disease synovial fibroblast subsets.

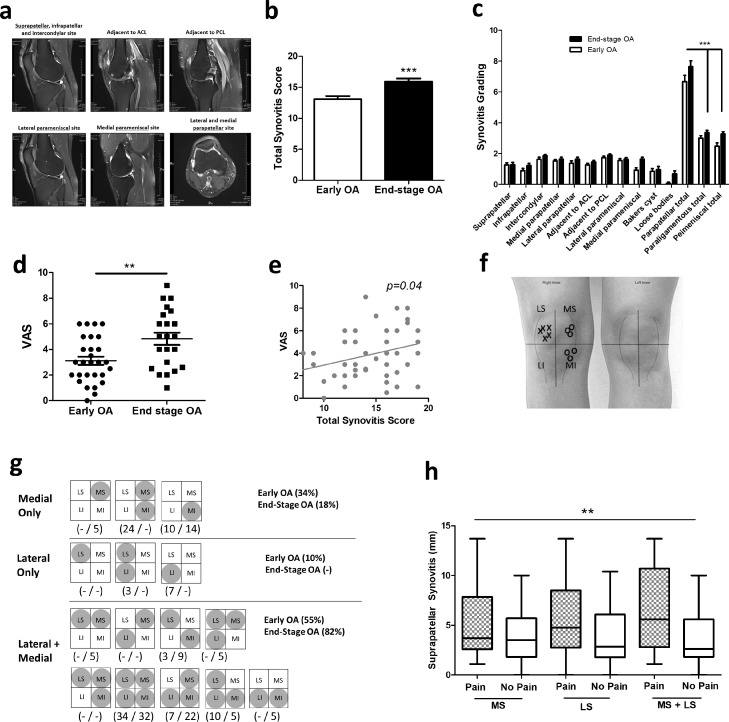
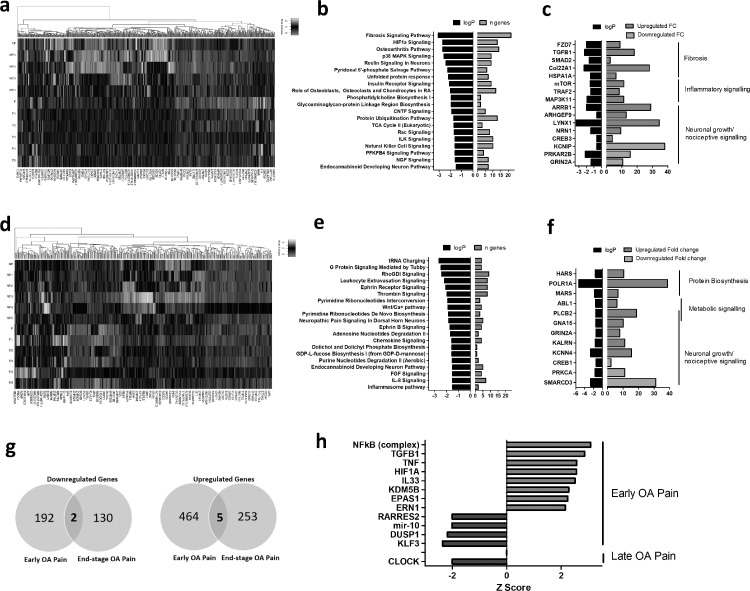
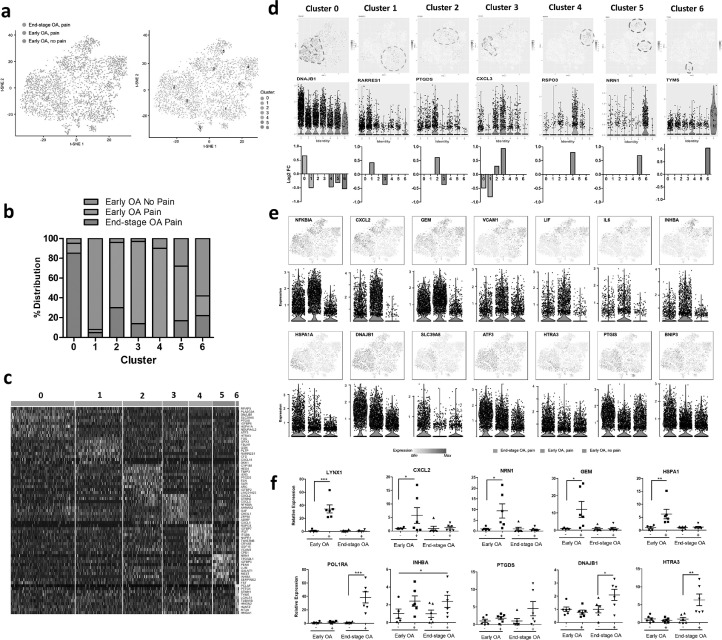
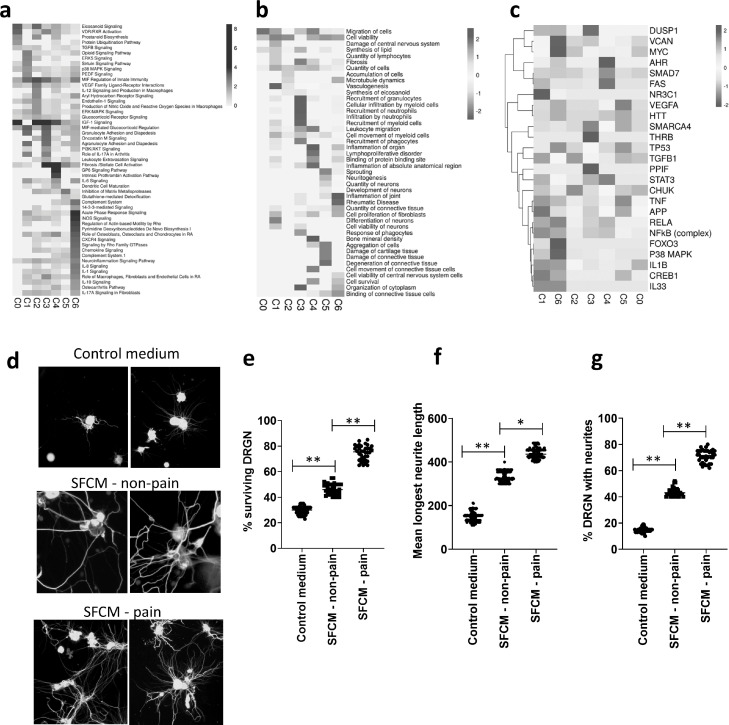
Methods: Patients with early knee OA (n = 29) and end-stage knee OA (n = 22) were recruited. Patient reported pain was recorded by questionnaire and using an anatomical knee pain map. Proton density fat suppressed MRI axial and sagittal sequences were analysed and scored for synovitis. Synovial tissue was obtained from the medial and lateral parapatellar and suprapatellar sites. Fibroblast single cell RNA sequencing was performed using Chromium 10X and analysed using Seurat. Transcriptomes were functionally characterised using Ingenuity Pathway Analysis and the effect of fibroblast secretome on neuronal growth assessed using rat DRGN.

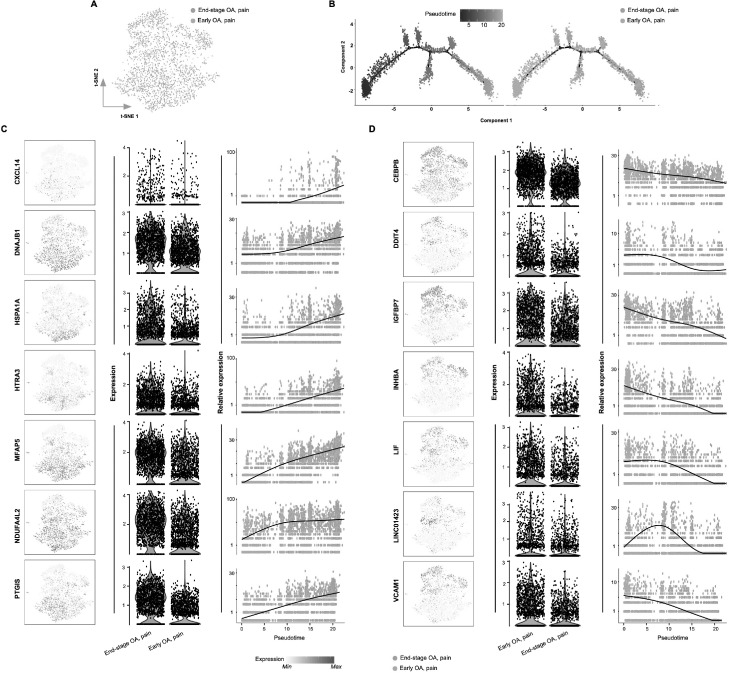
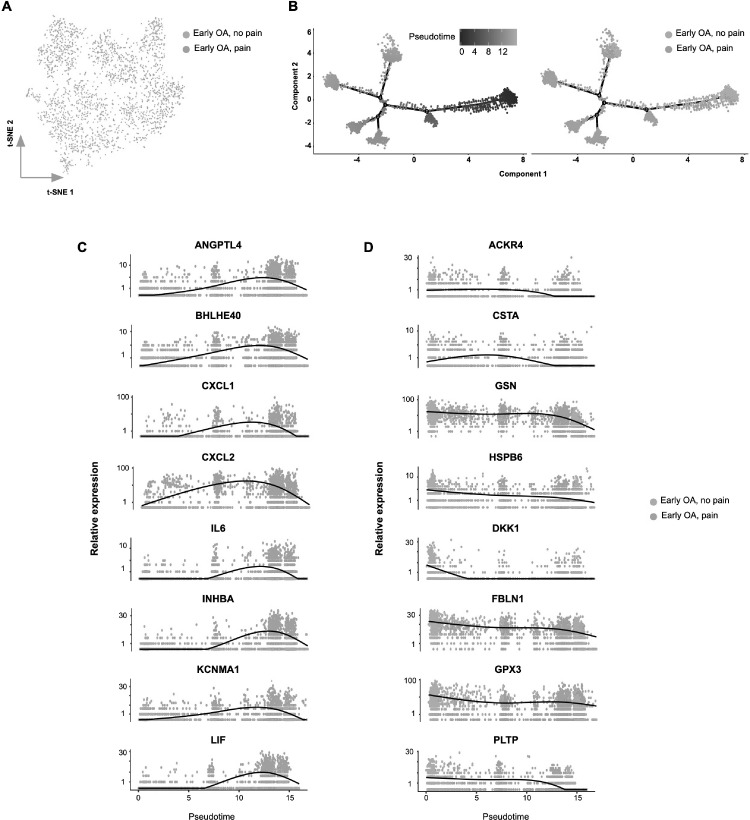
Findings: Parapatellar synovitis was significantly associated with the pattern of patient-reported pain in knee OA patients. Synovial tissue from sites of patient-reported pain exhibited a differential transcriptomic phenotype, with distinct synovial fibroblast subsets in early OA and end-stage OA. Functional pathway analysis revealed that synovial tissue and fibroblast subsets from painful sites promoted fibrosis, inflammation and the growth and activity of neurons. The secretome of fibroblasts from early OA painful sites induced greater survival and neurite outgrowth in dissociated adult rodent dorsal root ganglion neurons.

Interpretation: Sites of patient-reported pain in knee OA exhibit a different synovial tissue phenotype and distinct synovial fibroblast subsets. Further interrogation of these fibroblast pathotypes will increase our understanding of the role of synovitis in OA joint pain and provide a rationale for the therapeutic targeting of fibroblast subsets to alleviate pain in patients.

Funding: This study was funded by Versus Arthritis, UK (21530; 21812).

Keywords: Inflammation; Obesity; Osteoarthritis; Synovial fibroblasts; scRNAseq.


Conflict of interest statement

Declaration of Competing Interest SWJ declares grant funding from Versus Arthritis during the course of this study.

Figures

Fig 1
Fig. 1
The relationship between synovitis and patient-reported knee pain in early knee OA and end-stage knee OA (a) Representative proton-density MRI scans of OA patient knee joint (axial, coronal and sagittal scans), showing effusive synovitis (white/greying regions) across different anatomical sites. (b) Total synovitis score in early OA patients (n = 29) and end-stage OA patients (n = 22). ***= p < 0.001 (unpaired t-test), significantly different between early and end-stage OA. (c) Synovitis grading at each of 11 anatomical sites in early OA patients (n = 29) and end-stage OA patients (n = 22). ***= p < 0.001 (1-way ANOVA with Tukey's multiple comparison post-hoc test), significantly different between parapatellar compared to either paraligamentous or parameniscal. (d) Patient reported pain severity by VAS in early OA and end-stage OA patients. **= p < 0.01 (Mann Whitney test), significantly different between early and end-stage OA. (e) Correlation between OA patient reported pain severity (VAS) and total synovitis score. (f) Representative example of a completed patient-reported knee pain map. Crosses (x) represent sites of patient-reported pain, circles (o) represent sites of patient-reported no pain. LS and MS refer to lateral and medial supraparapatellar respectively. LI and MI refer to lateral and medial infraparapatellar respectively. (g) Different patterns of knee pain reported in early OA (n = 29 patients) and end-stage OA patients (n = 22). Greyed circles within either LS, MS, LI or MI represent sites of patient reported pain. (h) Supraparapatellar synovitis (mm) in patients who report pain in suprapatellar compartments (medial vs lateral vs medial+lateral), compared to those who report no pain. **=p < 0.01 (2-way ANOVA), significantly different between pain and no pain.
Fig 2
Fig. 2
RNA-sequencing of synovial tissue from painful and non-painful sites in early OA and end-stage knee OA patients (a) Heatmap of differentially expressed genes (FC > 1.5) in synovial tissue from painful sites, compared to non-painful sites in patients with early OA (n = 6). (b) Most significant canonical signalling pathways associated with the differential transcriptome of early OA painful synovial tissue. (c) LogP and fold-change values of upregulated and downregulated genes in early OA painful synovial tissue grouped into functional categories. (d) Heatmap of differentially expressed genes (FC> 1.5, p < 0.05) in synovial tissue from painful sites, compared to non-painful sites in patients with end-stage OA (n = 6). (e) Most significant canonical signalling pathways associated with the differential transcriptome of end-stage OA painful synovial tissue, as identified using IPA software. (f) LogP and fold-change values of upregulated and downregulated genes in end-stage OA painful synovial tissue grouped into functional categories. (g) Venn diagram showing the overlap and total numbers of significantly upregulated (> 1.5 FC) and down-regulated (< 1.5 FC) in painful synovial tissue in early OA and end-stage OA. (h) Z-scores of the identified upstream regulators of the transcriptome of painful synovial tissue in early OA and in end-stage OA. Positive z-scores (red bars) represent a predicted “activated” upstream regulator, negative z-scores (blue bars) represent a predicted “inhibited” upstream regulator.
Fig 3
Fig. 3
Single cell RNA-sequencing identifies distinct synovial fibroblasts subsets in the synovium from painful and non-painful sites in early OA and in end stage OA patients. (a) T-distributed stochastic neighbour embedding (t-SNE) plots of scRNAseq of synovial fibroblasts showing the separation between fibroblasts from painful and non-painful synovial sites in early OA patients, and between early and end-stage OA painful sites, with identification of 7 fibroblast subsets based on transcript profile. In total, scRNAseq was performed on synovial fibroblasts from painful and non-painful synovial patient-matched sites of n=4 early OA patients, and on synovial fibroblasts from painful sites of n = 4 end-stage OA patients. (b) Percentage distribution of the 7 different subsets according to either early OA pain, early OA no pain or end-stage OA pain. (c) Heatmap showing the z-score average gene signature expression of the top 10 most differentially expressed genes within each of the 7 synovial fibroblast clusters. (d) FeaturePlots displaying expression of subset specific markers for each of the 7 subsets (clusters 0-6) on the t-SNE map with violin plots below showing the expression levels of these markers (y-axis) across the different subsets (x-axis). (e) FeaturePlots displaying expression of sample specific markers (identified by performing differential expression analysis on the non-parametric Wilcoxon rank sum test) on the t-SNE map with violin plots below showing the expression levels of these markers (y-axis) across the different sample cohorts, early OA pain, early OA no-pain or end-stage OA pain (x-axis). (f) Bulk expression of specific synovial fibroblast genes in OA synovial tissue from either early OA patient matched painful (+) and non-painful (-) sites (n = 6) or end-stage OA patient-matched painful (+) and non-painful (-) sites (n = 6). *= p < 0.05, **= p < 0.01, ***= p < 0.001 significantly different between painful and non-painful synovial sites as determined by ANOVA with Tukey post-hoc test.
Fig 4
Fig. 4
Functional characteristics of OA synovial fibroblasts clusters. (a) Heatmap of canonical signalling pathways significantly associated with the transcriptome of each of the 7 synovial fibroblast subsets (C0-C6) as identified using IPA software, and coloured by logp value. (b) Heatmap of significant cellular functions for each of the 7 synovial fibroblast subsets (C0-C6) as identified using IPA software, and coloured by activation z-score with a positive z-score representing activation and a negative z-score representing inhibition. (c) Heatmap of identified upstream regulators for each of the 7 synovial fibroblast subsets (C0-C6) as identified using IPA software, and coloured by activation z-score with a positive z-score representing activation and a negative z-score representing inhibition. (d) Immunofluorescent images of rat DRGN stained with anti-βIII tubulin antibody (Sigma Aldrich; green) and after 4’,6-diamidino-2-phenylindole (DAPI; blue) nuclear stain after 24 h treatment with either fibroblast culture media diluted 1:4 in NBA-supplemented media (Control medium) or with synovial fibroblast conditioned media diluted 1:4 in NBA-supplemented media (SFCM) from either non-painful SFCM – non-pain) or painful (SFCM – pain). Stained DRGN (n = 4 per treatment group) were imaged using Axiovision Software (Carl Zeiss). (e) Quantification of the % surviving βIII-tubulin+ DRGN (36 images/condition) in control and SFCM – non pain and SFCM - pain treated DRGN 24 h after treatment. Quantification of neurite outgrowth in terms of (f) the longest DRGN neurite length (n = 144 DRGN/condition) and (g) % DRGN with neurites (36 images/condition) in control and SFCM – non-pain and SFCM – pain treated DRGN after 24 h treatment. *** = p < 0.001 and * = p < 0.05, one-way ANOVA with Dunnett's post hoc test.
Fig 5
Fig. 5
Transcriptional switch in fibroblast phenotype associated with OA disease progression. (a) t-SNE analysis of synovial fibroblast scRNAseq data showing the differential between fibroblasts from early OA painful sites and end-stage OA painful synovial sites. (b) Monocle pseudotime trajectory of the transition from early OA painful to end-stage OA painful synovial fibroblast transcriptome phenotype (left panel). The trajectory is overlaid with sample distribution (right panel). Cells are ordered in pseudotime based on differentially expressed genes (q-value < 0.01). Expression dynamics of upregulated genes (c) and downregulated genes (d) upon progression of synovial fibroblast phenotype towards end-stage OA overlaid with sample distribution. T-SNE map together with violin plots and featureplots showing the expression levels (y-axis) of the upregulated/downregulated genes for each sample (x-axis).
Fig 6
Fig. 6
Transcriptional switch in fibroblast phenotype associated with development of pain in early OA. (a) t-SNE analysis of synovial fibroblast scRNAseq data showing the differential between fibroblasts from early OA non-painful sites and painful synovial samples. (b) Monocle pseudotime trajectory of the transition from early OA non-painful to early OA painful synovial fibroblast transcriptome phenotype (left panel). The trajectory is overlaid with sample distribution (right panel). Cells are ordered in pseudotime based on differentially expressed genes (q-value < 0.01). Expression dynamics of upregulated genes (c) and downregulated genes (d) upon progression of synovial fibroblast phenotype towards early OA pain overlaid with sample distribution.

References

    1. Neogi T. The epidemiology and impact of pain in osteoarthritis. Osteoarthr Cartil. 2013;21:1145–1153. - PMC - PubMed
    1. Tonge D.P., Pearson M.J., Jones SW. The hallmarks of osteoarthritis and the potential to develop personalised disease-modifying pharmacological therapeutics. Osteoarthr Cartil. 2014;22:609–621. - PubMed
    1. Baker K., Grainger A., Niu J. Relation of synovitis to knee pain using contrast-enhanced MRIs. Ann Rheum Dis. 2010;69:1779–1783. - PMC - PubMed
    1. Pearson M.J., Herndler-Brandstetter D., Tariq M.A. IL-6 secretion in osteoarthritis patients is mediated by chondrocyte-synovial fibroblast cross-talk and is enhanced by obesity. Sci Rep. 2017;7:3451. - PMC - PubMed
    1. Nanus D.E., Wijesinghe S.N., Pearson M.J. Regulation of the inflammatory synovial fibroblast phenotype by metastasis-associated lung adenocarcinoma transcript 1 long noncoding RNA in obese patients with osteoarthritis. Arthritis Rheumatol. 2020;72:609–619. - PubMed