. 2021 Oct 9;12(10):925.
doi: 10.1038/s41419-021-04184-8.

AMPK agonist alleviate renal tubulointerstitial fibrosis via activating mitophagy in high fat and streptozotocin induced diabetic mice

Affiliations

AMPK agonist alleviate renal tubulointerstitial fibrosis via activating mitophagy in high fat and streptozotocin induced diabetic mice

Ya-Chun Han et al. Cell Death Dis. .

Abstract

Renal tubulointerstitial fibrosis was a crucial pathological feature of diabetic nephropathy (DN), and renal tubular injury might associate with abnormal mitophagy. In this study, we investigated the effects and molecular mechanisms of AMPK agonist metformin on mitophagy and cellular injury in renal tubular cell under diabetic condition. The high fat diet (HFD) and streptozotocin (STZ)-induced type 2 diabetic mice model and HK-2 cells were used in this study. Metformin was administered in the drinking water (200 mg/kg/d) for 24 weeks. Renal tubulointerstitial lesions, oxidative stress and some indicators of mitophagy (e.g., LC3II, Pink1, and Parkin) were examined both in renal tissue and HK-2 cells. Additionally, compound C (an AMPK inhibitor) and Pink1 siRNA were applied to explore the molecular regulation mechanism of metformin on mitophagy. We found that the expression of p-AMPK, Pink1, Parkin, LC3II, and Atg5 in renal tissue of diabetic mice was decreased obviously. Metformin reduced the levels of serum creatinine, urine protein, and attenuated renal oxidative injury and fibrosis in HFD/STZ induced diabetic mice. In addition, Metformin reversed mitophagy dysfunction and the over-expression of NLRP3. In vitro pretreatment of HK-2 cells with AMPK inhibitor compound C or Pink1 siRNA negated the beneficial effects of metformin. Furthermore, we noted that metformin activated p-AMPK and promoted the translocation of Pink1 from the cytoplasm to mitochondria, then promoted the occurrence of mitophagy in HK-2 cells under HG/HFA ambience. Our results suggested for the first time that AMPK agonist metformin ameliorated renal oxidative stress and tubulointerstitial fibrosis in HFD/STZ-induced diabetic mice via activating mitophagy through a p-AMPK-Pink1-Parkin pathway.


Conflict of interest statement

The authors report no conflicts of interest. The authors are responsible for the content and writing of the paper.

The animal experiments was approved by the Ethics Review Committee of The Third Xiangya Hospital, Central South University. The authors declare that they have no conflict of interest

Figures
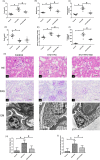
Fig. 1
Fig. 1. Effects of metformin treatment on biochemical index and renal pathological changes in the kidney of HFD/STZ induced diabetic mice.
AC Serum Cr, BUN and blood glucose levels of three groups mice at 24 weeks after STZ injection. D Body weight of three groups mice at 24 weeks after STZ injection. E The kidney weight/body weight of three groups mice at 24 weeks after STZ injection. F Twenty-four hours proteinuria content of three groups mice at 24 weeks. Values are presented as the mean ± SD, *P < 0.05 vs. control group, #P < 0.05 vs. STZ + HFD group, n = 8. G Renal tissue sections stained with H&E (ac) and PAS (df) (magnification ×400). Electron microscopy (EM) analysis showed that significant ultrastructural changes in diabetic mice including the fusion of the foot processes and the thickening of the glomerular basement membrane. While these injuries were obviously alleviated by metformin treatment. (gi magnification ×10,000), n = 3. H Glomerular damage scores. I Tubulo-interstitial damage scores, *P < 0.05 vs. control group, #P < 0.05 vs. STZ + HFD group, n = 3.
Fig. 2
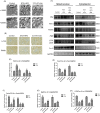
Fig. 2. Effects of metformin on renal oxidative stress and renal interstitial fibrosis in HFD/STZ induced diabetic mice.
A IHC analysis of 8-OHdG (magnification ×400, upper panel) and DHE staining (lower panel) in mouse renal tissue of three groups (magnification ×200). B, C Bar graphs representing quantification of tissues stained with 8-OHdG (B) and DHE (C), *P < 0.05 vs. control groups, #P < 0.05 vs. STZ + HFD groups, n = 3. D Western blot analysis of FN (upper panel) and Col-1(middle panel) protein expression in the renal tissue of three groups. E IF analysis of FN (upper panel) and Col-1 (middle panel) in mouse renal tissue of three groups (magnification ×400), renal tissue sections are stained with Masson (lower panel, magnification ×400). F, G Semiquantification of IF staining for FN (F) and Col-1 (G). HI Densitometric analyses of the Western blotting results, FN to β-actin (H), Col-1 to β-actin (I). Values are presented as the mean ± SD, *P < 0.05 vs. control group, #P < 0.05 vs. STZ + HFD group, n = 3.
Fig. 3
Fig. 3. Renal AMPK, p-AMPK, and NLRP3 expression in HFD/STZ induced diabetic mice following metformin treatment.
A Renal IHC staining with anti-p-AMPK antibody (upper panel) and anti-NLRP3 antibody (lower panel) (magnification ×400). B Western blot analysis of NLRP3 (upper panel), p-AMPK, AMPK (middle panel), and IL-1βprotein (lower panel) expression. CF Densitometric analyses of the Western blotting results, NLRP3 to β-actin (C), p-AMPK to β-actin (D), AMPK to β-actin (E), IL-1β to β-actin (F). Values are presented as the mean ± SD, *P < 0.05 vs. control group, #P < 0.05 vs. STZ + HFD group, n = 3.
Fig. 4
Fig. 4. Effects of metformin on mitophagy dysfunction in renal tubular cell of HFD/STZ induced diabetic mice.
A EM analysis showed obvious mitochondrial morphological changes in diabetic mice renal cells, such as mitochondria swelling and fragmentation, these changes were partially reversed by metformin therapy. In addition, metformin treatment group exhibited conspicuous mitochondrial autophagosome compared with the diabetic mice group (ac, magnification ×10,000, upper panel; df, magnification ×20,000, bottom panel). B Renal IHC staining with anti-LC3II antibody (upper panel) and anti-Pink1 antibody (lower panel) (magnification ×400). C Western blot analysis of P62 (upper panel), Pink1, Parkin, Atg5 (middle panels), and LC3II (bottom panel) protein expression in mitochondria (left panels) and cytoplasm (right panels). DH Densitometric analyses of the western blotting results, P62 to CoxIV or P62 to GAPDH (D), Pink1 to CoxIV or Pink1 to GAPDH (E), Parkin to CoxIV or Parkin to GAPDH (F), Atg5 to CoxIV or Atg5 to GAPDH (G), LC3II to CoxIV or LC3II to GAPDH (H). Values are presented as the mean ± SD, *P < 0.05 vs. control group, #P < 0.05 vs. STZ + HFD group, n = 3.
Fig. 5
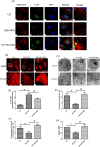
Fig. 5. Effects of metformin on mitochondrial morphology, mitophagy and MMP in HK-2 cells exposed to HG/HFA conditions.
A Laser-scanning confocal microscopy detection showed that LC3II expression and mitochondrial morphology in HK-2 cells exposed to HG/HFA conditions and pretreated with metformin (magnification ×630). B TMRE staining for mitochondrial membrane potential (MMP) in HK-2 cells subjected to HG/HFA treatment with metformin (magnification ×630). C TEM analysis showed obvious mitochondrial morphological changes in HK-2 cells under HG/HFA condition, such as mitochondria swelling, these changes were partially reversed by metformin therapy. In addition, metformin treatment group exhibited conspicuous mitochondrial autophagosome compared with the HG/HFA group (ac magnification ×4000, upper panel; df magnification ×20,000, bottom panel). D Semi-quantification of mitochondrial fragmentation of various group. E Semi-quantification of LC3-positive punctate per cell. F Semi-quantification for the co-localization of LC3II and mitochondria. G Quantification of MMP as measured with TMRE staining. Values are presented as the mean ± SD, *P < 0.05 vs. LG group, #P < 0.05 vs. HG/HFA group, n = 3.
Fig. 6
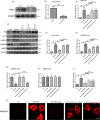
Fig. 6. Metformin treatment regulated FN, Col-1, NLRP3, p-AMPK expression, and mitochondrial ROS generation in HK-2 cells exposed to HG/HFA conditions.
A Western blot analysis of Pink1 protein expression in the HK-2 cells of control and Pink1 siRNA group. B Densitometric analyses of WB results, bar graph represents the ratio of Pink1 to β-actin, *P < 0.05 vs. control groups, n = 3. C Western blot analysis of FN (upper panel), Col-1, NLRP3, p-AMPK (middle panel), and AMPK (bottom panel) protein expression in the HK-2 cells of various groups. DH Each bar graph represents the densitometric analyses of FN to β-actin (D), Col-1 to β-actin (E), NLRP3 to β-actin (F), p-AMPK to β-actin (G), AMPK to β-actin (H). J MitoSOX Red staining represented of mitochondrial ROS levels in HK-2 cells of various groups (magnification ×630). I Quantification of mitochondrial ROS production as measured with MitoSox Red staining. Values are presented as the mean ± SD, *P < 0.05 vs. LG group, #P < 0.05 vs. HG + HFA group, **P < 0.05 vs. HG + HFA + Met group, ##P < 0.05 vs. HG + HFA + Met group, n = 3.
Fig. 7
Fig. 7. Metformin activated mitophagy in HK-2 cells under HG/HFA conditions through p-AMPK-Pink1-Parkin pathway.
A Laser-scanning confocal microscopy detection showed Pink1 expression and mitochondrial morphology in HK-2 cells exposed to HG/HFA conditions and pretreated with metformin, Pink1 siRNA or compond C (magnification ×630). B Quantification of IF staining for Pink1. C Semi-quantification for the co-localization of Pink1 and mitochondria. D Western blot analysis of P62 (upper panel), Pink1, Parkin, Atg5 (middle panels), and LC3II (bottom panel) protein expression in mitochondria (left panels) and cytoplasm (right panels) of HK-2 cells. EI Densitometric analyses of the western blotting results, Pink1 to CoxIV or Pink1 to GAPDH (E), P62 to CoxIV or P62 to GAPDH (F), Parkin to CoxIV or Parkin to GAPDH (G), Atg5 to CoxIV or Atg5 to GAPDH (H), LC3II to CoxIV or LC3II to GAPDH (I). Values are presented as the mean ± SD, *P < 0.05 vs. LG group, #P < 0.05 vs. HG + HFA group, **P < 0.05 vs. HG + HFA + Met group, ##P < 0.05 vs. HG + HFA + Met group, n = 3.

References

    1. Zhang L, Long J, Jiang W, Shi Y, He X, Zhou Z, et al. Trends in chronic kidney disease in China. N. Engl J Med. 2016;375:905–6. doi: 10.1056/NEJMc1602469. - DOI - PubMed
    1. Martínez-Castelao A, Navarro-González JF, Górriz JL, de Alvaro F. The concept and the epidemiology of diabetic nephropathy have changed in recent years. J Clin Med. 2015;4:1207–16. doi: 10.3390/jcm4061207. - DOI - PMC - PubMed
    1. Slyne J, Slattery C, McMorrow T, Ryan MP. New developments concerning the proximal tubule in diabetic nephropathy: in vitro models and mechanisms. Nephrol Dial Transpl. 2015;30:iv60–67. doi: 10.1093/ndt/gfv264. - DOI - PubMed
    1. Yang SK, Li AM, Han YC, Peng CH, Song N, Yang M, et al. Mitochondria-targeted peptide SS31 attenuates renal tubulointerstitial injury via inhibiting mitochondrial fission in diabetic mice. Oxid Med Cell Longev. 2019;2019:2346580. - PMC - PubMed
    1. Yang S, Han Y, Liu J, Song P, Xu X, Zhao L, et al. Mitochondria: a novel therapeutic target in diabetic nephropathy. Curr Med Chem. 2017;24:3185–202. doi: 10.2174/0929867324666170509121003. - DOI - PubMed

Publication types

MeSH terms