. 2022 Feb;51(2):383-397.
doi: 10.1007/s13280-021-01635-6. Epub 2021 Oct 9.

Oceanographic and biogeochemical drivers cause divergent trends in the nitrogen isoscape in a changing Arctic Ocean

Affiliations

Oceanographic and biogeochemical drivers cause divergent trends in the nitrogen isoscape in a changing Arctic Ocean

Pearse James Buchanan et al. Ambio. 2022 Feb.

Abstract

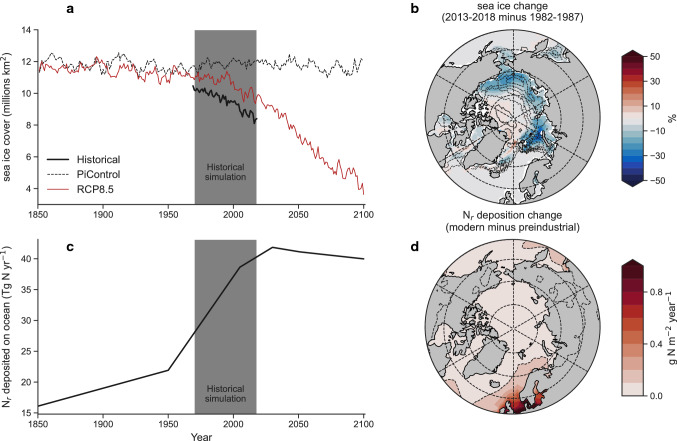
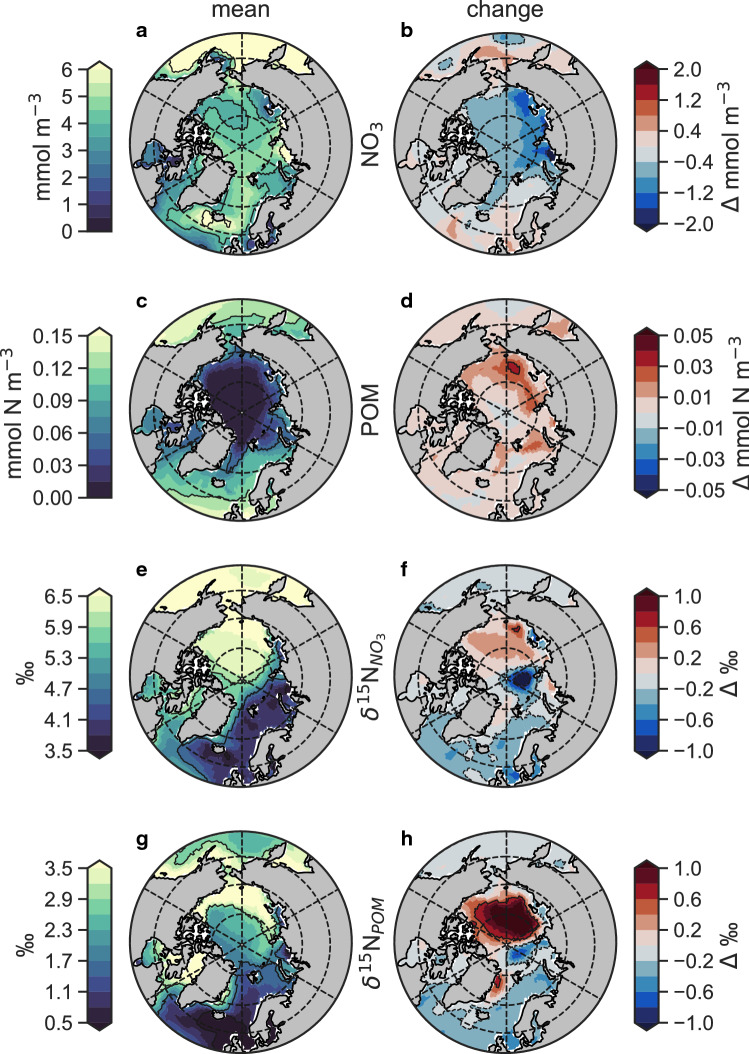
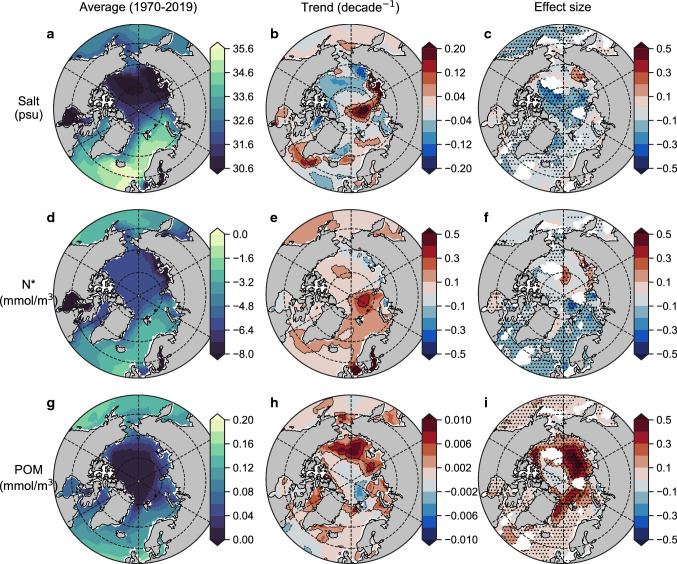
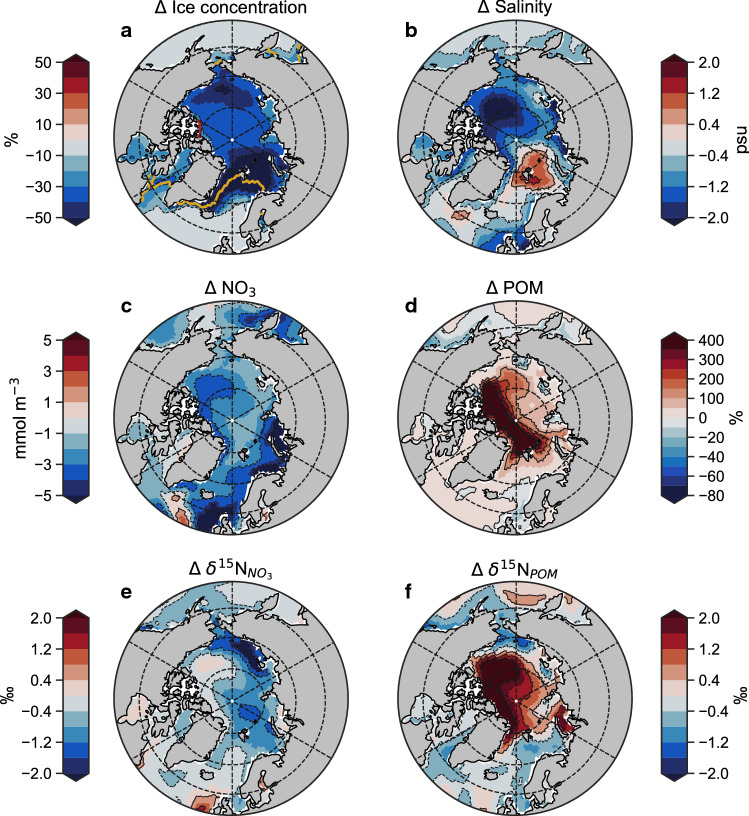
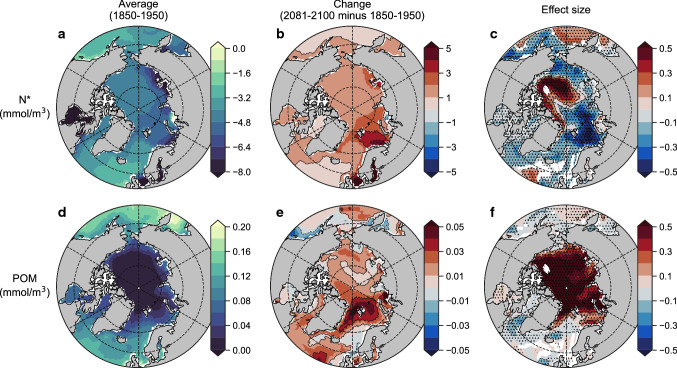
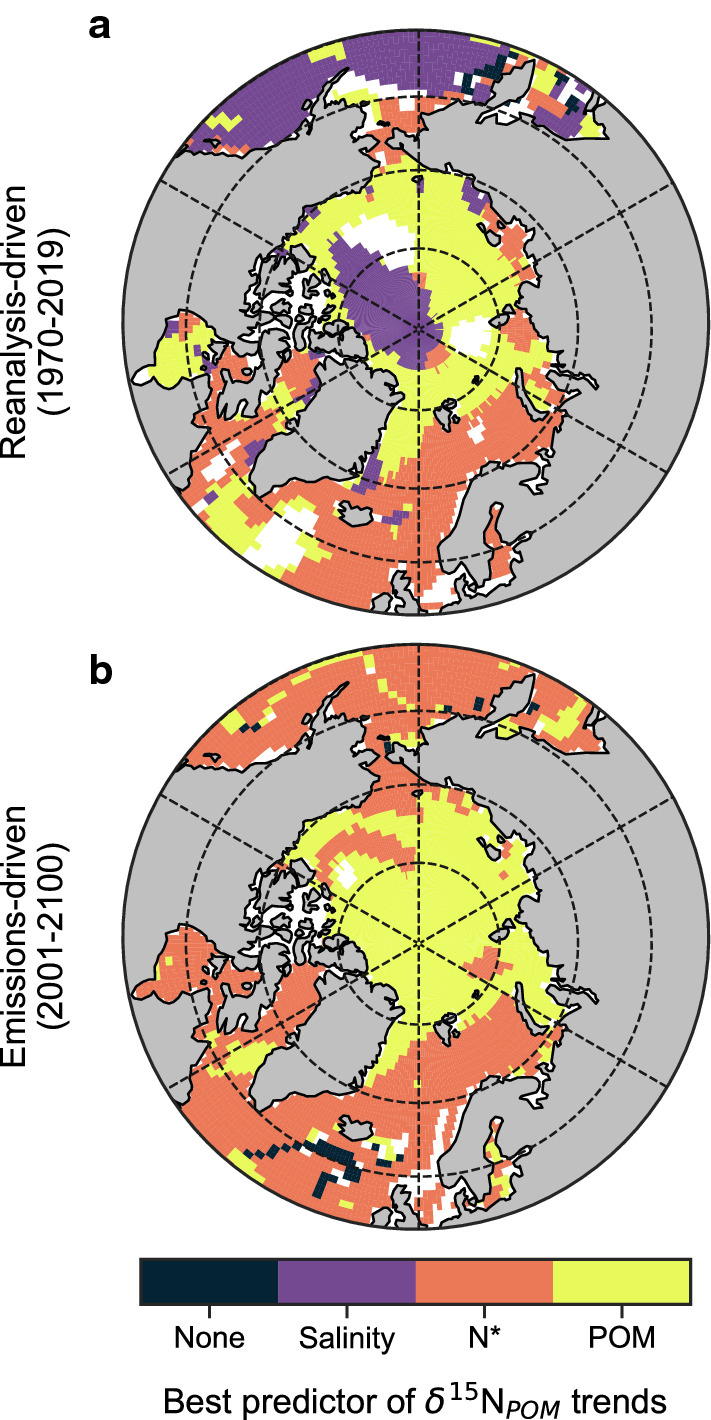
Nitrogen stable isotopes (δ15N) are used to study food web and foraging dynamics due to the step-wise enrichment of tissues with increasing trophic level, but they rely on the isoscape baseline that varies markedly in the Arctic due to the interplay between Atlantic- and Pacific-origin waters. Using a hierarchy of simulations with a state-of-the-art ocean-biogeochemical model, we demonstrate that the canonical isotopic gradient of 2-3‰ between the Pacific and Atlantic sectors of the Arctic Ocean has grown to 3-4‰ and will continue to expand under a high emissions climate change scenario by the end of the twenty-first century. δ15N increases in the Pacific-influenced high Arctic due to increased primary production, while Atlantic sector decreases result from the integrated effects of Atlantic inflow and anthropogenic inputs. While these trends will complicate longitudinal food web studies using δ15N, they may aid those focussed on movement as the Arctic isoscape becomes more regionally distinct.

Keywords: Biogeochemistry; Food webs; Primary production; Spatial ecology; Stable isotopes; Trophic position.


Figures

Fig. 1
Fig. 1
Major changes affecting the isoscape of nitrogen in the Arctic Ocean. a Time series of sea ice cover (millions km2) in our reanalysis-driven (solid black line) and emissions-driven (red line) simulations compared with preindustrial control conditions (dashed black line). b Observed spatial change in sea ice concentration 2013–2018 minus 1982–1987 (shading) and reanalysis-driven change (contours). Contours are in 5% intervals. c Time series of integrated change in aeolian reactive nitrogen (Nr) deposited to the global ocean. d Change in Nr deposition between modern (2005) and preindustrial (1850) in the Arctic region. The dashed contour represents 0.1 g N m−2 year−1
Fig. 2
Fig. 2
Annual mean conditions (1970–1990) and historical changes (2009–2019 minus 1970–1990) in surface properties and the nitrogen isoscape. a Concentration of nitrate (NO3) and b its change (Δ). c Concentration of particulate organic matter (POM) and d its change. e Values of δ15N (isoscape) of NO3 and f its change. g Values of δ15N (isoscape) of POM and h its change. All values come from the reanalysis-driven simulation of historical conditions
Fig. 3
Fig. 3
Major environmental drivers of the Arctic Ocean isoscape from the reanalysis-driven simulations. Average values of salinity, N* and particulate organic matter (units nitrogen) over the upper 100 m of the Arctic Ocean over simulation years 1970–2019 ce (a, d, g), their linear multi-decadal trends (b, e, h) and their normalised effect size (unitless) on inter-annual trends in δ15NPOM (c, f, g). Masked regions in right-hand panels (c, f, i) are those where regression analysis could not be performed with all three variables due to interactive effects between variables (variance inflation factor > 3.0). Stippling in right-hand panels (c, f, i) indicates a significant effect of the variable on δ15NPOM, where the 95% confidence intervals of the effect size do not intersect zero
Fig. 4
Fig. 4
Future changes in surface properties of the Arctic Ocean nitrogen isoscape. Changes (Δ) between mean conditions over upper 100 m between 2081–2100 and 1986–2005. a Sea ice concentration. b Salinity. c Concentration of nitrate (NO3). d Percent change in the concentration of particulate organic matter (POM) in units of nitrogen. e Values of δ15N (isoscape) of NO3. f Values of δ15N (isoscape) of POM in units of nitrogen. All values come from the emissions-driven simulation from preindustrial to future conditions (1801–2100)
Fig. 5
Fig. 5
Major environmental drivers of the Arctic Ocean isoscape from the emissions-driven simulations. Average values of N* and particulate organic matter (units nitrogen) over the upper 100 m of the Arctic Ocean over simulation years 1850–1950 ce (a, d), their linear multi-decadal trends (b, e), and their normalised effect size (unitless) on inter-annual trends in δ15NPOM (c, f). Masked regions in right-hand panels (c, f) are those where regression analysis could not be performed with all three variables due to interactive effects between variables (variance inflation factor > 3.0). Stippling in right-hand panels (c, f) indicates a significant effect of the variable on δ15NPOM, where the 95% confidence intervals of the effect size do not intersect zero
Fig. 6
Fig. 6
Best predictor of temporal trends in the Arctic isoscape. Results of a multiple linear regression analysis using predictors of salinity (psu), N* (mmol m−3), and POM (mmol m−3) and the response of δ15NPOM. All variables were averaged over the upper 100 m and over the year, such that trends are inter-annual. N* = NO3 − PO4*16. POM is particulate organic matter in terms of nitrogen. White spaces are regions where the predictor variables showed significant interactive effects (variance inflation factor > 3.0) and where multiple linear regression was not performed. Salinity was removed as a predictor in the emissions-driven scenario due to variance inflation factors between it and N*

References

    1. Ardyna M, Arrigo KR. Phytoplankton dynamics in a changing Arctic Ocean. Nature Climate Change. 2020;10:892–903. doi: 10.1038/s41558-020-0905-y. - DOI
    1. Arrigo KR, Perovich DK, Pickart RS, Brown ZW, van Dijken GL, Lowry KE, Mills MM, Palmer MA, et al. Massive phytoplankton blooms under Arctic Sea ice. Science. 2012;336:1408–1408. doi: 10.1126/science.1215065. - DOI - PubMed
    1. Aumont O, Ethé C, Tagliabue A, Bopp L, Gehlen M. PISCES-v2: An ocean biogeochemical model for carbon and ecosystem studies. Geoscientific Model Development. 2015;8:2465–2513. doi: 10.5194/gmd-8-2465-2015. - DOI
    1. Bindoff, N.L., W.W.L. Cheung, J.G. Kairo, J. Aristegui, V.A. Guinder, R. Hallberg, N. Hilmi, N. Jiao, et al. 2019. Changing ocean, marine ecosystems, and dependent communities. In IPCC Special Report on the Ocean and Cryosphere in a Changing Climate, ed. H.-O. Portner, C.D. Roberts, V. Masson-Delmotte, P. Zhai, E. Tignor, E. Poloczanska, K. Mintenbeck, A. Alegria, et al., 447–588.
    1. Bird CS, Veríssimo A, Magozzi S, Abrantes KG, Aguilar A, Al-Reasi H, Barnett A, Bethea DM, et al. A global perspective on the trophic geography of sharks. Nature Ecology and Evolution. 2018;2:299–305. doi: 10.1038/s41559-017-0432-z. - DOI - PubMed

LinkOut - more resources