Review
. 2021 Oct 11;23(1):108.
doi: 10.1186/s12968-021-00799-0.

Society for Cardiovascular Magnetic Resonance 2020 Case of the Week series

Affiliations
Review

Society for Cardiovascular Magnetic Resonance 2020 Case of the Week series

Jason N Johnson et al. J Cardiovasc Magn Reson. .

Abstract

The Society for Cardiovascular Magnetic Resonance (SCMR) is an international society focused on the research, education, and clinical application of cardiovascular magnetic resonance (CMR). Case of the week is a case series hosted on the SCMR website ( https://www.scmr.org ) that demonstrates the utility and importance of CMR in the clinical diagnosis and management of cardiovascular disease. Each case consists of the clinical presentation and a discussion of the condition and the role of CMR in diagnosis and guiding clinical management. The cases are all instructive and helpful in the approach to patient management. We present a digital archive of the 2020 Case of the Week series of 11 cases as a means of further enhancing the education of those interested in CMR and as a means of more readily identifying these cases using a PubMed or similar search engine.


Conflict of interest statement

There are no competing interests.

Figures

Fig. 1
Fig. 1
Case 1: Figure 1. 4D Flow 3D rendering. A labeled still-frame outlining the right atria (RA) and left (LA) atria, and right (RV) and left (LV) ventricles. The location of the unroofed coronary sinus is shown as a dotted line with an arrow demonstrating the direction of the shunt flow near the os of the coronary sinus
Fig. 2
Fig. 2
Case 2: Figure 1. Still frame angiogram in a coronal plane. Right sided transverse aortic arch (TAO) with a left descending aorta (DAo) and aberrant left subclavian artery (LSCA)
Fig. 3
Fig. 3
Case 2: Figure 2. Still frame angiogram in an axial plane. Right sided transverse aortic arch (TAO) with a left descending aorta (DAo) and aberrant left subclavian artery (LSCA). AAO ascending aorta
Fig. 4
Fig. 4
Case 2: Figure 3. Still frame 3D reconstruction of aortic arch. Right sided aortic arch with a left descending aorta (DAo) and aberrant left subclavian artery (LSCA). AAO ascending aorta, LCCA left common carotid artery, RCCA right common carotid artery, RSCA right subclavian artery
Fig. 5
Fig. 5
Case 3: Figure 1. 12-lead electrocardiogram (ECG). Sinus rhythm, right atrial abnormality, and diffuse nonspecific ST changes
Fig. 6
Fig. 6
Case 3: Figure 2. Event monitor. Ventricular tachycardia at 240 beats per minute
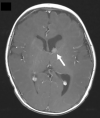
Fig. 7
Fig. 7
Case 3: Figure 3. CMR scar imaging. Comparison of standard “bright blood” segmented inversion recovery images (A) with “dark blood” technique (FIDDLE, B). RA and RV endocardial late gadolinium enhancement (LGE) is readily apparent on dark blood imaging
Fig. 8
Fig. 8
Case 5: Figure 1. Short axis mid (A), apical (B), four chamber (C), two chamber (D) LGE images acquired with GRE readout and PSIR reconstruction. Prior CMR from 2019 with subendocardial enhancement in the LV and RV apices, extending to the mid-ventricular level, and of the basal anterolateral subendocardium
Fig. 9
Fig. 9
Case 5: Figure 2. Short axis mid (A), apical (B), four chamber (C), two chamber (D) LGE images acquired with gradient echo (GRE) readout and phase sensitive inversion recovery (PSIR) reconstruction. Follow up CMR from 2020 with subendocardial enhancement in the LV and RV apices. Note the improved contrast to noise between the fibrotic layer and the LV cavity blood pool when blood pool nulling is used
Fig. 10
Fig. 10
Case 5: Figure 3. Magnitude mid (A) and apical (B) short axis images corresponding to PSIR from Figure 2 Case 5. This demonstrates the blood pool nulling technique
Fig. 11
Fig. 11
Case 5: Figure 4. Multi-echo GRE fat water separation sequence: out of phase (A) and fat only (B). Subendocardial fat deposition is depicted by the arrowheads
Fig. 12
Fig. 12
Case 5: Figure 5. Cine balanced steady state free precession (bSSFP) four chamber. Hypointense regions within the subendocardium (arrows) corresponding to scattered areas of fat deposition
Fig. 13
Fig. 13
Case 6: Figure 1. Cine bSSFP four chamber. Isointense mass (arrow) on the tricuspid valve
Fig. 14
Fig. 14
Case 6: Figure 2. Cine bSSFP short axis. Isointense mass (arrow) on the tricuspid valve
Fig. 15
Fig. 15
Case 6: Figure 3. LGE short axis high inversion (A) and null inversion (B) times. Hyperintense mass (arrows) on the tricuspid valve
Fig. 16
Fig. 16
Case 7: Figure 1. Sagittal single shot bSSFP. Mild subvalvar pulmonary stenosis seen in the setting of a pectus deformity
Fig. 17
Fig. 17
Case 7: Figure 2. RV long axis cine bSSFP at peak systole. Mild subvalvar pulmonary stenosis
Fig. 18
Fig. 18
Case 8: Figure 1. Transthoracic echocardiogram (TTE) four chamber at end diastole. Mild asymmetric LV hypertrophy
Fig. 19
Fig. 19
Case 8: Figure 2. Two (A) and three (B) chamber cine bSSFP at peak systole. Mitral valve prolapse (MVP) and mitral annular disjunction (MAD) are seen with a jet of mitral regurgitation (MR)
Fig. 20
Fig. 20
Case 8: Figure 3. LGE in short axis base (A, B), three chamber (C), and corresponding short axis base (D). Fibrosis in the inferolateral wall basal segment confirmed by the reference image through the three chamber
Fig. 21
Fig. 21
Case 9: Figure 1. Twelve lead ECG. ST depression in the lateral wall (V4–V6), T wave inversion in V1 and Q waves and ST elevation in I and aVL
Fig. 22
Fig. 22
Case 9: Figure 2. Portable chest radiograph. Bilateral, peri-hilar airspace opacities and Kerley B lines consistent with acute pulmonary edema
Fig. 23
Fig. 23
Case 9: Figure 3. Cine bSSFP two and three chamber. Two chamber (A, B) and three chamber (C, D) views of cine bSSFP in end-diastolic (left column) and end-systolic (right column). Wall motion abnormality in the mid anterior and anteroseptal walls. Note the mid to apical mid-wall myocardial hyperintensity (arrows)
Fig. 24
Fig. 24
Case 9: Figure 4. T2 short tau inversion recovery (STIR) and LGE short axis. T2-STIR (AC) and LGE (DF) sequences in basal (left column—A, D), mid-ventricular (central column—B, E) and apical (right column—C, F) short axis views. Although relatively subtle, on STIR images there is myocardial hyperintensity (green asterisks) in the basal to apical anterior and lateral walls and mid anteroseptum, which is suggestive of myocardial edema. On LGE images there is subepicardial enhancement (arrows) in the basal to mid antero- and inferoseptum. The existence of epicardial fat (blue asterisks) might be confounded by subepicardial enhancement. Typically, epicardial fat appears hyperintense on the LGE sequence but is suppressed on STIR images
Fig. 25
Fig. 25
Case 9: Figure 5. Four chamber native T1 and T2 maps. On native T1 map (A) two areas of remarkably shortened T1 time are noted in the apical septum and apical lateral wall. As opposed to the previous tissue characterization images, the T1 time shortening is evident here. The T2 map (B) shows no obvious abnormalities
Fig. 26
Fig. 26
Case 9: Figure 6. Short axis native T1 and T2 maps. As with LGE sequence, in the native T1 map (AC) there is an impression of longer times in the subepicardial basal anteroseptum and mid-wall mid-ventricular septum (white arrows). In the apical slice (C), there is a small area of subtle shortened T1 time in the lower part of the septum (black arrow). T2 times (DF) appeared unremarkable in all segments
Fig. 27
Fig. 27
Case 9: Figure 7. Polar map of native T1 and T2 times in myocardial segments. Diffusely elevated native T1 (A), except where focally decreased in the apical septum. Diffusely borderline high to mildly elevated T2 times (B)
Fig. 28
Fig. 28
Case 9: Figure 8. Four chamber T2-STIR (A), early gadolinium enhancement (EGE) (B) and LGE (C) sequences. Subtle, faint areas of mid-wall apical hypointensity (yellow arrows) can be seen in all three sequences
Fig. 29
Fig. 29
Case 9: Figure 9. Abdominal computed tomography (CT). The heart had been partially covered in two previous abdominal scans related colonic pathology (2016 (A) 2018 (B)). On both scans a focal myocardial hypodensity is visible in the same segments with abnormal signal intensity on CMR. The CT density is similar to the one showed by the pericardial and subcutaneous tissue
Fig. 30
Fig. 30
Case 10: Figure 1. Short-axis T2 weighted image. Isointense LV assist device felt plug in the LV cavity
Fig. 31
Fig. 31
Case 10: Figure 2. Short-axis triple inversion recovery fat suppression. Hyper-intense LV assist device felt plug in the LV cavity
Fig. 32
Fig. 32
Case 10: Figure 3. LGE with long TI (A), myocardial nulling TI magnitude image (B), and PSIR (C). Hypo-intense on long TI, hyper-intense with an etched appearance on myocardial nulling TI, and hypo-intense on phase sensitive inversion recovery LV assist device (LVAD) felt plug in the LV apex. Transmural LGE of the LV apical wall around the LVAD felt plug
Fig. 33
Fig. 33
Case 10: Figure 4. Chest CT coronal plane. LV assist device felt plug in the LV apex with no metal present
Fig. 34
Fig. 34
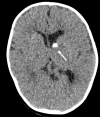
Case 11: Figure 1. Axial brain CT image. Calcified lesion is seen adjacent to left lateral ventricle
Fig. 35
Fig. 35
Case 11: Figure 2. Twelve lead ECG demonstrates sinus rhythm with premature atrial contractions
Fig. 36
Fig. 36
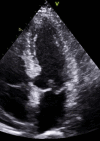
Case 11: Figure 3. TTE parasternal short-axis (A), high right parasternal (B), and subcostal sagittal (C) views. An intracavitary mass (arrow) is noted within the RA between the posterior RA wall and the interatrial septum. The mass is seen at the posterior RA wall, midway between SVC and IVC without systemic venous or tricuspid inflow obstruction. Doppler echocardiography showing lack of vascular flow signal of the RA mass
Fig. 37
Fig. 37
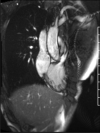
Case 11: Figure 4. T2 bSSFP (A) T1 turbo spin echo (B) T1 with fat saturation LGE (C) four-chamber and T2 triple inversion recovery short axis (D). The RA mass (arrow) is isointense on T2 bSSFP, hyper-intense on T1 TSE, hyper-intense on T1 fat saturation LGE, and hyper-intense on T2 TIR. The RA mass abuts the posterior atrial wall and is located close to the interatrial septum. There is no contrast enhancement of the mass
Fig. 38
Fig. 38
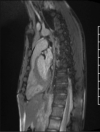
Case 11: Figure 5. T2 steady state free precession sagittal (A) and coronal (B). The relationship of the mass (arrow) with the superior vena cava and inferior vena cava is shown. There is no obstruction to systemic venous flow
Fig. 39
Fig. 39
Case 11: Figure 6. Brain MRI T1 SE post gadolinium contrast. Avidly enhancing mass at the anterior left lateral ventricle suspicious of subependymal giant cell astrocytoma (arrow)

References

    1. Dahiya A, Chao C, Younger J, Kar J, Baldwin BM, Cohen MV, et al. Society for cardiovascular magnetic resonance 2019 case of the week series. J Cardiovasc Magn Reson. 2021;23(1):44. doi: 10.1186/s12968-020-00671-7. - DOI - PMC - PubMed
    1. van der Linde D, Konings EE, Slager MA, Witsenburg M, Helbing WA, Takkenberg JJ, et al. Birth prevalence of congenital heart disease worldwide: a systematic review and meta-analysis. J Am Coll Cardiol. 2011;58(21):2241–2247. doi: 10.1016/j.jacc.2011.08.025. - DOI - PubMed
    1. Jonas RA. Comprehensive surgical management of congenital heart disease. 2. Boca Raton: CRC Press; 2014.
    1. Allen HD, Shaddy RE, Penny DJ, Feltes TF, Cetta F. Moss and Adams heart disease in infants, children, and adolescents: including the fetus and young adult. 9. Philadelphia: Wolters Kluwer; 2016.
    1. Kim H, Choe YH, Park SW, Jun TG, Kang IS, Yang JH, et al. Partially unroofed coronary sinus: MDCT and MRI findings. AJR Am J Roentgenol. 2010;195(5):W331–W336. doi: 10.2214/AJR.09.3689. - DOI - PubMed

MeSH terms