

A Risk Prediction Model for Long-term Prescription Opioid Use
- PMID: 34629423
- PMCID: PMC8595680
- DOI: 10.1097/MLR.0000000000001651
A Risk Prediction Model for Long-term Prescription Opioid Use
Abstract
Background: Tools are needed to aid clinicians in estimating their patients' risk of transitioning to long-term opioid use and to inform prescribing decisions.
Objective: The objective of this study was to develop and validate a model that predicts previously opioid-naive patients' risk of transitioning to long-term use.
Research design: This was a statewide population-based prognostic study.
Subjects: Opioid-naive (no prescriptions in previous 2 y) patients aged 12 years old and above who received a pill-form opioid analgesic in 2016-2018 and whose prescriptions were registered in the California Prescription Drug Monitoring Program (PDMP).
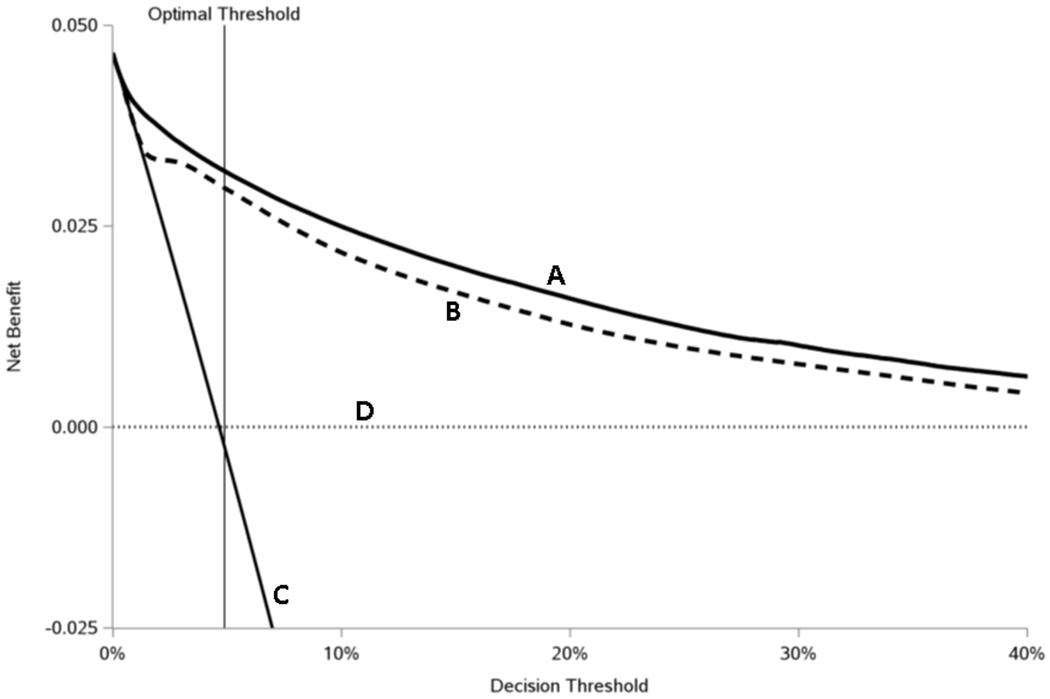
Measures: A multiple logistic regression approach was used to construct a prediction model with long-term (ie, >90 d) opioid use as the outcome. Models were developed using 2016-2017 data and validated using 2018 data. Discrimination (c-statistic), calibration (calibration slope, intercept, and visual inspection of calibration plots), and clinical utility (decision curve analysis) were evaluated to assess performance.
Results: Development and validation cohorts included 7,175,885 and 2,788,837 opioid-naive patients with outcome rates of 5.0% and 4.7%, respectively. The model showed high discrimination (c-statistic: 0.904 for development, 0.913 for validation), was well-calibrated after intercept adjustment (intercept, -0.006; 95% confidence interval, -0.016 to 0.004; slope, 1.049; 95% confidence interval, 1.045-1.053), and had a net benefit over a wide range of probability thresholds.
Conclusions: A model for the transition from opioid-naive status to long-term use had high discrimination and was well-calibrated. Given its high predictive performance, this model shows promise for future integration into PDMPs to aid clinicians in formulating opioid prescribing decisions at the point of care.
Copyright © 2021 Wolters Kluwer Health, Inc. All rights reserved.
Conflict of interest statement
The authors declare no conflict of interest.
Figures


References
-
- Murthy VH. Ending the Opioid Epidemic - A Call to Action. N Engl J Med 2016;375:2413–2415 - PubMed
-
- Centers for Medicare & Medicaid Services. Medicare Program; Contract Year 2019 Policy and Technical Changes to the Medicare Advantage, Medicare Cost Plan, Medicare Fee-for-Service, the Medicare Prescription Drug Benefit Programs, and the PACE Program. In: Department of Health and Human Services, ed.2018:16440–16757 - PubMed
-
- Salter J Express Scripts to limit opioids; doctors concerned. 2017. Available at: https://apnews.com/article/c7d6e9acaeeb4260a571232fe7a4492d. Accessed November 2020,
