. 2021 Sep 24:15:635937.
doi: 10.3389/fnins.2021.635937. eCollection 2021.

Modulating Cortical Instrument Representations During Auditory Stream Segregation and Integration With Polyphonic Music

Affiliations

Modulating Cortical Instrument Representations During Auditory Stream Segregation and Integration With Polyphonic Music

Lars Hausfeld et al. Front Neurosci. .

Abstract

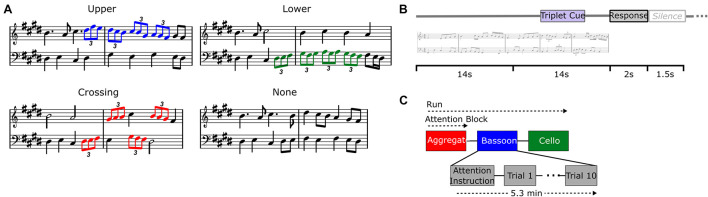
Numerous neuroimaging studies demonstrated that the auditory cortex tracks ongoing speech and that, in multi-speaker environments, tracking of the attended speaker is enhanced compared to the other irrelevant speakers. In contrast to speech, multi-instrument music can be appreciated by attending not only on its individual entities (i.e., segregation) but also on multiple instruments simultaneously (i.e., integration). We investigated the neural correlates of these two modes of music listening using electroencephalography (EEG) and sound envelope tracking. To this end, we presented uniquely composed music pieces played by two instruments, a bassoon and a cello, in combination with a previously validated music auditory scene analysis behavioral paradigm (Disbergen et al., 2018). Similar to results obtained through selective listening tasks for speech, relevant instruments could be reconstructed better than irrelevant ones during the segregation task. A delay-specific analysis showed higher reconstruction for the relevant instrument during a middle-latency window for both the bassoon and cello and during a late window for the bassoon. During the integration task, we did not observe significant attentional modulation when reconstructing the overall music envelope. Subsequent analyses indicated that this null result might be due to the heterogeneous strategies listeners employ during the integration task. Overall, our results suggest that subsequent to a common processing stage, top-down modulations consistently enhance the relevant instrument's representation during an instrument segregation task, whereas such an enhancement is not observed during an instrument integration task. These findings extend previous results from speech tracking to the tracking of multi-instrument music and, furthermore, inform current theories on polyphonic music perception.

Keywords: EEG; attention; auditory scene analysis; auditory stream segregation; envelope tracking; polyphonic music.


Conflict of interest statement

The authors declare that the research was conducted in the absence of any commercial or financial relationships that could be construed as a potential conflict of interest.

Figures

FIGURE 1
FIGURE 1
Experiment design. Different triplet versions for each music composition (A): upper voice (i.e., bassoon; blue notes), lower voice (i.e., cello; green notes), crossing voices (red notes), no triplets. Trial buildup (B) with 28 s stimulus, 2 s response window, and 1.5 s silence. Trials were presented in attentive blocks of 10 stimuli each and preceded by a visual attention instruction and silence (C).
FIGURE 2
FIGURE 2
Sound envelope tracking method. Envelopes were extracted from each instrument’s waveform via an absolute Hilbert transform, its derivative was employed to estimate both single-delay and multi-delay envelope models on N-1 training trials. To assess generalization, the estimated envelope model was used to predict the sound envelope of the single unseen trial and its output correlated with the trial’s actual sound envelope. Multi-delay models provided output in a single correlation value encompassing the evidence of all delays between 0 and 400 ms, while the single-delay models generated a correlation value for each individual delay between –200 and 500 ms (10-ms step size).
FIGURE 3
FIGURE 3
Group Behavioral Results. Accuracies of triplet detection across all tasks (blue boxes) and FA differences between trials with triplets in the other instrument and trials without triplets (black boxes) for the bassoon and cello task for all participants (box = 25th percentile–median–75th percentile). Gray lines denote performances of single participants, red crosses indicate participants excluded from further analysis.
FIGURE 4
FIGURE 4
Envelope Tracking during the Segregation Tasks. Multi-delay model tracking performance (A) for attended (dark gray) and unattended (light gray) instruments, showing a significant difference between the two listening conditions. The average empirical chance-level is displayed as superimposed black waves. Single-delay tracking profiles (B) showing a significant delay-resolved difference between attended (thick black solid line) or unattended (thick black dashed line) instruments during 150–220 ms, 320–360 ms, and 410–450 ms. The thin purple line shows the difference between attended and unattended tracking; the thin solid black (attended) and thin dashed black (unattended) lines present the average empirical chance-level.
FIGURE 5
FIGURE 5
Envelope tracking during the segregation tasks per instrument. Multi-delay model tracking performance (A) for attended (dark gray) and unattended (light gray) instruments. The tracking of bassoon and cello envelopes is displayed at left and right two bars, respectively. Horizontal lines and values above denote results of significance testing between attended and unattended conditions for the bassoon and an interaction between attended and reconstructed instrument. The average empirical chance-level is superimposed as black waves. Single-delay tracking profiles (B) for the bassoon envelope (left panel) and cello envelope (right panel). Significant tracking differences between attended and unattended instruments are indicated by the purple lines. Attention effects for bassoon tracking were found during the 160–220 ms (✩) and 320–380 ms (✧) delay windows and for cello tracking only during a 150–210 ms delay window (✩). Differences between attended and unattended tracking are presented as thin pink lines. Thin horizontal lines within the plot indicate the average empirical chance-level. Horizontal lines in the negative indicate time-points which significantly differed from chance. Topographical representation (C) of tracking differences for the leave-one-electrode out analysis of both the attended and unattended conditions for each instrument during the significant delay-windows indicated in panel (B).
FIGURE 6
FIGURE 6
Aggregate tracking during integration and segregation tasks. Multi-delay model tracking performance (A) for the aggregate during the aggregate (gray), bassoon (blue), and cello (green) tasks, displaying no significant differences between model tracking capacities. The average empirical chance-level is displayed as superimposed black waves. Single-delay aggregate tracking profiles (B) showing tracking performance for the aggregate (black solid line), bassoon (blue dashed line), and cello (green dashed line) tasks. Differences between attention to aggregate and the attention to bassoon of tracking are shown by thin light-gray and dark-gray lines, respectively. Thin horizontal wavy lines within the plot indicate the average empirical chance-level. Horizontal lines at negative tracking values at the bottom of the graph indicate those time-points which displayed significant tracking performance.
FIGURE 7
FIGURE 7
Overview of EEG prediction performance. (A) Encoding models prediction performance for EEG data acquired during the bassoon task. Boxplots show the average model performance of different encoding models across all 63 channels. Boxes indicate the interquartile range, red lines indicate the median and whiskers reach to the most extreme data point up to 1.5 interquartile from the lower or upper quartile. Gray lines and dots denote encoding performance for individual participants. Encoding results are presented as a function of models reflecting the envelope the bassoon, cello or the aggregate or their combination with 2 or 3 predictors. Best models for individual participants are indicated by star symbols. Topographic plots show prediction performance for single channels. Right: matrices show comparisons of different models. Asterisks and open circles indicate the significant differences for model pairs at pFDR < 0.01 and pFDR < 0.05, respectively (two-sided, false-discovery-rate adjusted p-values across 21 paired comparisons). a, b, c denote the aggregate, bassoon and cello predictors to identify different encoding models. Panels (B,C) same as panel (A) but for the cello and aggregate task, respectively. (D) Right: task comparisons of encoding model prediction averaged across channels indicated as in panels (A–C) for single-predictor models and the two-predictor model with bassoon and cello envelope. Left: prediction differences for models with the bassoon and cello predictors between tasks for single channels. Neither the average prediction across channels nor the predictions for single channels were significantly different between any pair of tasks (two-sided, uncorrected).

Similar articles

References

    1. Alain C., Bernstein L. J. (2015). Auditory scene analysis: tales from cognitive neurosciences. Music Percept. Interdiscip. J. 33 70–82. 10.1525/mp.2015.33.1.70 - DOI
    1. Alho K., Rinne T., Herron T. J., Woods D. L. (2014). Stimulus-dependent activations and attention-related modulations in the auditory cortex: a meta-analysis of fMRI studies. Hear. Res. 307 29–41. 10.1016/j.heares.2013.08.001 - DOI - PubMed
    1. Benjamini Y., Hochberg Y. (1995). Controlling the false discovery rate: a practical and powerful approach to multiple testing. J. R. Stat. Soc. Ser. B 57 289–300. 10.2307/2346101 - DOI
    1. Besle J., Schevon C. A., Mehta A. D., Lakatos P., Goodman R. R., McKhann G. M., et al. (2011). Tuning of the human neocortex to the temporal dynamics of attended events. J. Neurosci. 31 3176–3185. 10.1523/JNEUROSCI.4518-10.2011 - DOI - PMC - PubMed
    1. Bey C., McAdams S. (2003). Postrecognition of interleaved melodies as an indirect measure of auditory stream formation. J. Exp. Psychol. Hum. Percept. Perform. 29 267–279. 10.1037/0096-1523.29.2.267 - DOI - PubMed

LinkOut - more resources