. 2021 Sep 24:15:735387.
doi: 10.3389/fnbeh.2021.735387. eCollection 2021.

Measuring Behavior in the Home Cage: Study Design, Applications, Challenges, and Perspectives

Affiliations

Measuring Behavior in the Home Cage: Study Design, Applications, Challenges, and Perspectives

Fabrizio Grieco et al. Front Behav Neurosci. .

Abstract

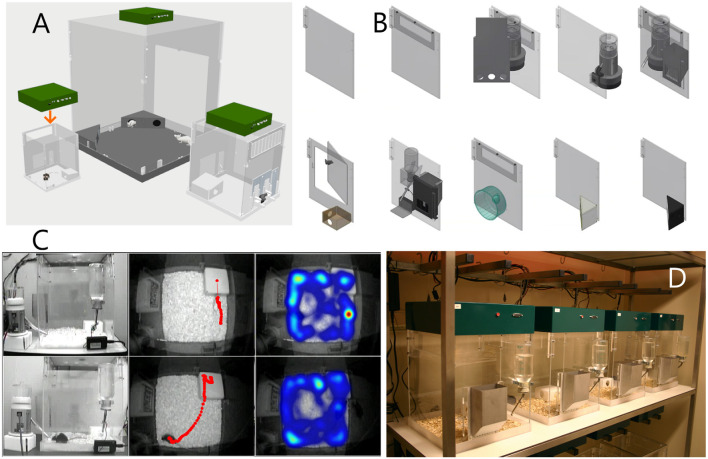
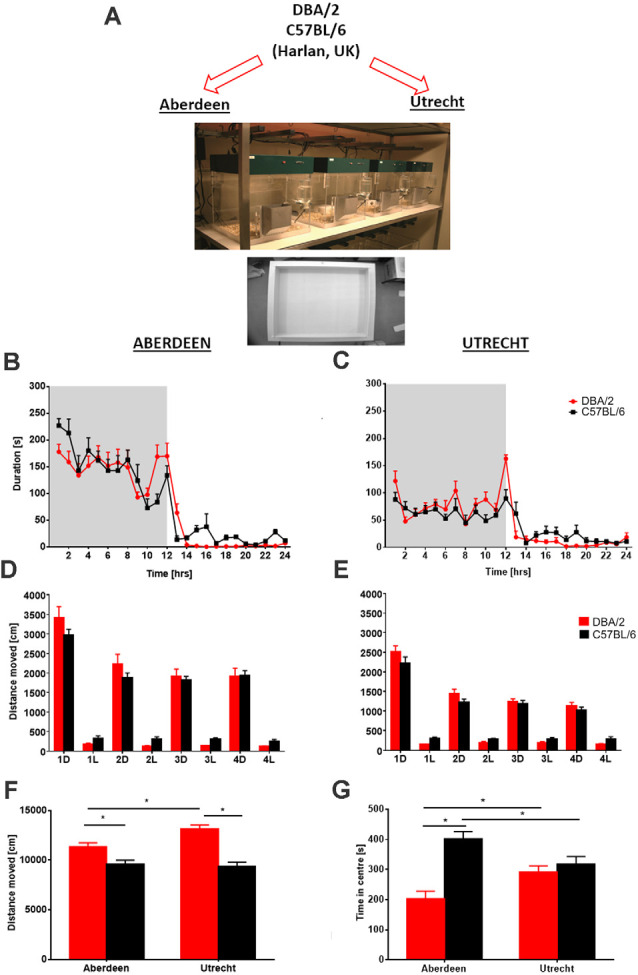
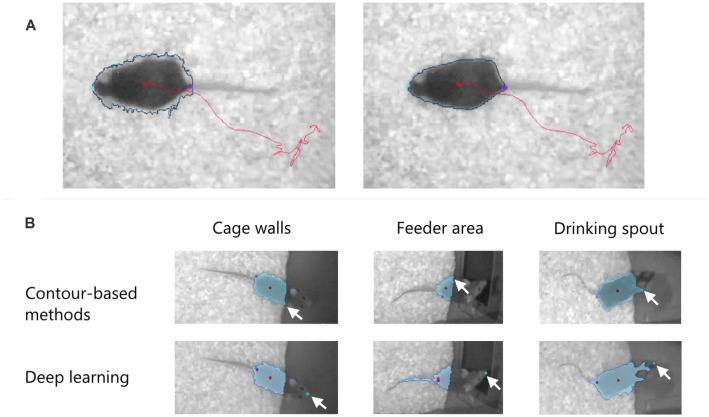
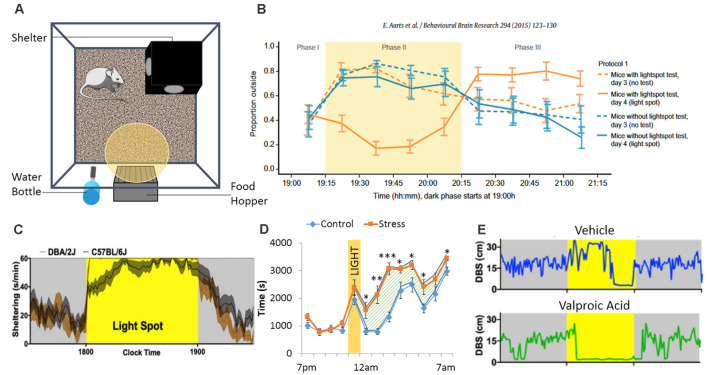
The reproducibility crisis (or replication crisis) in biomedical research is a particularly existential and under-addressed issue in the field of behavioral neuroscience, where, in spite of efforts to standardize testing and assay protocols, several known and unknown sources of confounding environmental factors add to variance. Human interference is a major contributor to variability both within and across laboratories, as well as novelty-induced anxiety. Attempts to reduce human interference and to measure more "natural" behaviors in subjects has led to the development of automated home-cage monitoring systems. These systems enable prolonged and longitudinal recordings, and provide large continuous measures of spontaneous behavior that can be analyzed across multiple time scales. In this review, a diverse team of neuroscientists and product developers share their experiences using such an automated monitoring system that combines Noldus PhenoTyper® home-cages and the video-based tracking software, EthoVision® XT, to extract digital biomarkers of motor, emotional, social and cognitive behavior. After presenting our working definition of a "home-cage", we compare home-cage testing with more conventional out-of-cage tests (e.g., the open field) and outline the various advantages of the former, including opportunities for within-subject analyses and assessments of circadian and ultradian activity. Next, we address technical issues pertaining to the acquisition of behavioral data, such as the fine-tuning of the tracking software and the potential for integration with biotelemetry and optogenetics. Finally, we provide guidance on which behavioral measures to emphasize, how to filter, segment, and analyze behavior, and how to use analysis scripts. We summarize how the PhenoTyper has applications to study neuropharmacology as well as animal models of neurodegenerative and neuropsychiatric illness. Looking forward, we examine current challenges and the impact of new developments. Examples include the automated recognition of specific behaviors, unambiguous tracking of individuals in a social context, the development of more animal-centered measures of behavior and ways of dealing with large datasets. Together, we advocate that by embracing standardized home-cage monitoring platforms like the PhenoTyper, we are poised to directly assess issues pertaining to reproducibility, and more importantly, measure features of rodent behavior under more ethologically relevant scenarios.

Keywords: EthoVision XT; PhenoTyper; home-cage; neuroscience; rodent behavior; video-tracking.


Conflict of interest statement

BB and QP were employed by F. Hoffman-La Roche Ltd. BK and ML are employed by Synaptologics BV. ED, FG, LN, RFR, and RT are employed by Noldus Information Technology BV. AS participates in a holding that owns shares of Synaptologics BV. The remaining authors declare that the research was conducted in the absence of any commercial or financial relationships that could be construed as a potential conflict of interest.

Figures

Figure 1
Figure 1
The four pillars of Noldus PhenoTyper as a home cage monitoring system. (A) Different cage sizes can be combined with the same device (the Top Unit) that functions as the interface between the cage and the video-tracking system. Left, 30 × 30 cm cage for single mouse; middle, 90 × 90 cm for rat social interaction; might, 45 × 45 cm for single rat or mouse social interaction. (B) Cages can be made of different functional components, easily assembled, disassembled and cleaned. (C) Control of stimuli and recording of behavior and analysis is performed by the EthoVision XT software. Left: external view of two cages during a conditioning experiment where the mouse must sit on top of the shelter in order to receive a reward. Cages are provided with a pellet dispenser for the rewards and a lickometer to additionally measure drinking behavior. Middle: view from the Top Unit with tracks. In the cage at the top, the dot on the shelter indicates that the mouse is inside the shelter; the time spent in the shelter is also measured. In the other cage, the mouse has just received a reward after it was detected on the top of the shelter. Right: example of locomotor/exploration behavior visualized as heatmaps. (D) Cages can be placed in standard racks and tests are performed simultaneously, with up to 16 cages per EthoVision XT workstation. The subjects are usually released and taken by lifting the feeding tray.
Figure 2
Figure 2
Between laboratory analysis of ambulatory activity and anxiety-related behavior in two different mouse strains. (A) Following delivery of mice to the two behavioral facilities in Aberdeen and Utrecht, identical experiments were conducted using the home cage observation system PhenoTyper and the open field. Circadian activity (hourly bins) expressed as time spent in the open area of the PhenoTyper during a 24-h period (shaded area = dark phase of testing) revealed that activity of both mouse strains DBA/2 and C57BL/6 in Aberdeen (B) and Utrecht (C) laboratories was increased during periods of darkness and declined during the light phase. Despite overall higher ambulatory activity in the Aberdeen mice, similar activity peaks at the beginning and end of the dark phase were obtained with both strains in both laboratories. Analysis of distance moved across four consecutive recording days averaged for 12-h time bins, dark (D) and light (L) phases of activity revealed no overall significant differences between strains in both (D) Aberdeen and (E) Utrecht, although similar trends were observed across laboratories with DBA/2 mice being more active during the dark phases and C57BL/6 more active during the light phases. Following completion of PhenoTyper testing analysis of activity (distance moved) (F) and anxiety-related (time spent in the center) in the open field (G) revealed activity differences between the two strains that were comparable across both laboratories, with DBA/2 mice displaying higher levels of activity than C57BL/6 mice. However, a difference in anxiety-related behavior between the two strains was only observed in Aberdeen with DBA/2 displaying heightened levels of anxiety-like behavior (i.e., less time spent in the center) compared to C57BL/6. Furthermore, some strain differences were observed between laboratories with C57BL/6 mice being less anxious in Aberdeen compared to Utrecht with the opposite observed for DBA/2. Data are presented as means + SEM. Asterisks denote p < 0.05, t-test. The figure is adapted from Robinson et al. (2018).
Figure 3
Figure 3
(A) Effect of pixel filtering to remove indentations in the subject contour (blue line) and make it less dependent on the spatial variation of the background. Left: before filtering. Right: after filtering. The nose, the tail-base, and the center of the body are shown with color dots. (B) Detection of the nose point in EthoVision XT 16 in three “difficult” cases where the mouse moves over dark surfaces in a PhenoTyper cage. Two methods are used to find the nose: contour-based and deep learning. The arrows indicate the position of the detected nose. In all cases, the deep learning method correctly finds the nose independent of the detected blob (in light blue).
Figure 4
Figure 4
The PhenoTyper boxes are equipped with a shelter, a food hopper, a water bottle, a yellow (or white) LED light and a ceiling mounted camera allowing tracking of the animals (A). During the dark phase, the LED light can be turned ON, shining above the food zone. This creates a conflict between food intake and the subject’s fear of lit environment. In the Light Spot Test (B), animals show reduced time spend outside of the shelter when the light is ON. A study from Jankovic et al (2019) identified strains differences regarding sheltering time in response to the light test, while other “standard” tests failed to identify strain differences (C). Another way to assess anxiety-like behavior using the PhenoTyper would be to investigate how animals react to the light (as in the Light Spot Test) as well as their behavior when the light is turned back OFF. Residual avoidance behavior can be observed (D) in some cases, like after chronic stress exposure, where mice tend to stay in the shelter even when the light has been turned off, suggesting the presence of more pervasive anxiety-like behavior (the hatched area highlights the residual avoidance period *p < 0.05; **p < 0.01; ***p < 0.001). Finally, the Light Spot test can be performed with pairs of mice tested in the same PhenoTyper (without the shelter to ease tracking). During the light challenge, animals receiving valproic acid prenatally spent more time close to each other (DBS: distance between subjects), compared to animals receiving vehicle (E). Figures are redrawn from Aarts et al. (2015), Bass et al. (2020), Jankovic et al. (2019), and Prevot et al. (2019b).
Figure 5
Figure 5
Assessment of food and water consumption in the PhenoTyper. (A) Home-cage arena i ndicating the location of defined zones of interest including food and water zones adjacent to the food hopper and water bottle. Treatment with AM251 induced a decrease in body weight (B), food intake (C) and water intake (D). They also spent less time in the food zone compared with controls (E) and displayed lower levels of ambulatory activity (F). Repeated administration of AM251 suppressed food intake (G) with home cage observations indicating a reduced time in food zone each night following drug treatment (H). The figure is adapted from Riedel et al. (2009). *P < 0.05; **P < 0.01; ***P < 0.001.
Figure 6
Figure 6
Simultaneously measuring kinematic and neurovegetative function in PhenoTyper home cages. Right: Cartoon showing home-cage configuration with a screen capture from an aerial infrared camera showing mouse body contour (blue) and center point (red). (A) Horizontal distances accumulated hourly by 8-week old C57BL/6J mice (n = 32, 16 female). (B) Total distances moved (per day), and the mean “time budget” calculated across this 21 h recording period. (C,D) Heat maps, time budgets and behavioral quantities depicted over 6 h long epochs. “Other” is defined as time spent not sheltering, drinking or feeding. (E) Average rates of sheltering, licking and feeding measured simultaneously with individual total values plotted in inset. (F) Percent frequency of (noninvasively derived) sleep bouts as a function of time of day (Top) and by duration of sleep bout (Bottom), with individual values obtained for total sleep (Inset). The mean + SEM is shown. The figure is adapted from Jankovic et al. (2019).
Figure 7
Figure 7
(A) The CognitionWall for identifying discrimination learning impairments. The CognitionWall is an opaque Perspex wall with three entrances that is placed in front of a food dispenser inside PhenoTyper. (B) In the discrimination learning test, mice are rewarded with a food pellet (blue dot) when they choose to pass through one of the three entrances; in this example, the left-most entrance. In the reversal learning test (not shown), the rewarding entrance is switched to another one, for example the right-most entrance. The scheme is adapted from www.sylics.com. (C) Top view of the Combicage. Left, the PhenoTyper home-cage. Right, MedAssociates operant chamber. The test animal can move between the two parts through a custom connection tube. The figure is adapted from Remmelink et al. (2017).
Figure 8
Figure 8
Assessment of semantic-like memory in a home-cage environment via a social transmission of food preference (STFP) task. (A) Outline of a novel semi-automated STFP task developed in the PhenoTyper. The task consists of various phases using “observer” and “demonstrator” animals. Observer animals are initially habituated to the PhenoTyper whilst demonstrator mice are single housed, both animals are habituated to food jars containing mouse chow. Prior to the test all mice are subjected to overnight food restriction after which the demonstrator animals are given a flavored mouse chow (cocoa or cinnamon). The observer animal is subsequently exposed to the demonstrator animal via a cylinder positioned within the PhenoTyper and interaction between the two animals initiated. Social interaction for cued food was followed by either a short (15 min—STM) or long delay (24 h—LTM) prior to the mice being tested for recall via the presentation of jars containing correct and incorrect food. The amount of food consumed, and time spent in the zones associated with each jar were recorded with intact semantic memory represented by a preference for the cued food they were exposed to via the demonstrator. Analysis of correct food eaten, i.e., food matching the flavor of the demonstrator (B), and time spent in food jar zones (C) revealed that 6 month old PLB4 mice (mice with mild overexpression of human BACE1 involved in neurodegeneration) displayed impaired memory for the cued food in both STM and LTM tests, with only PLBWT mice (i.e., mice from PLB crossings that do not carry transgenes) displaying intact memory for the cued food. Impairments in memory for the cued food were also observed with PLB2Tau (i.e., knock-in mice which express a single copy of FTD human Tau) with mice consuming less of the correct food (D) and in contrast to age matched PLBWT mice they demonstrated no preference for the cued food in either STM or LTM tasks (E). The figure is adapted from Plucińska et al. (2014) and Koss et al. (2016). *P < 0.05; **P < 0.01; ***P < 0.001, for group comparisons. $P < 0.05 significance vs. chance (50%).
Figure 9
Figure 9
Time plot of behavioral events coded by human observer (Ground truth; top) and scored by the Deep learning annotation system. Note the striking agreement between ground truth and automated annotations. The figure is redrawn from van Dam et al. (2020).

Similar articles

Cited by

References

    1. Aarts E., Maroteaux G., Loos M., Koopmans B., Kovačević J., Smit A. B., et al. . (2015). The light spot test: measuring anxiety in mice in an automated home-cage environment. Behav. Brain Res. 294, 123–130. 10.1016/j.bbr.2015.06.011 - DOI - PubMed
    1. Ahloy-Dallaire J., Klein J. D., Davis J. K., Garner J. P. (2019). Automated monitoring of mouse feeding and body weight for continuous health assessment. Lab Anim. 53, 342–351. 10.1177/0023677218797974 - DOI - PubMed
    1. Alexandrov V., Brunner D., Hanania T., Leahy E. (2015). High-throughput analysis of behavior for drug discovery. Eur. J. Pharmacol. 750, 82–89. 10.1016/j.ejphar.2014.11.047 - DOI - PMC - PubMed
    1. Angelakos C. C., Tudor J. C., Ferri S. L., Jongens T. A., Abel T. (2019). Home-cage hypoactivity in mouse genetic models of autism spectrum disorder. Neurobiol. Learn. Mem. 165:107000. 10.1016/j.nlm.2019.02.010 - DOI - PMC - PubMed
    1. Archer J. (1976). “The organisation of aggression and fear in vertebrates,” in Perspectives in Ethology (Vol. 2), eds Bateson P. P. G., Klopfer P. H. (Boston, MA: Springer; ), 231–298.

LinkOut - more resources