

Directional Decoding From EEG in a Center-Out Motor Imagery Task With Visual and Vibrotactile Guidance
- PMID: 34630055
- PMCID: PMC8497713
- DOI: 10.3389/fnhum.2021.687252
Directional Decoding From EEG in a Center-Out Motor Imagery Task With Visual and Vibrotactile Guidance
Abstract
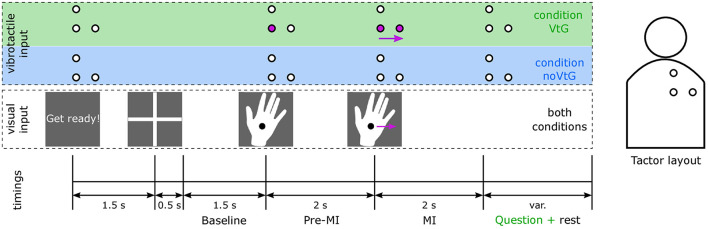
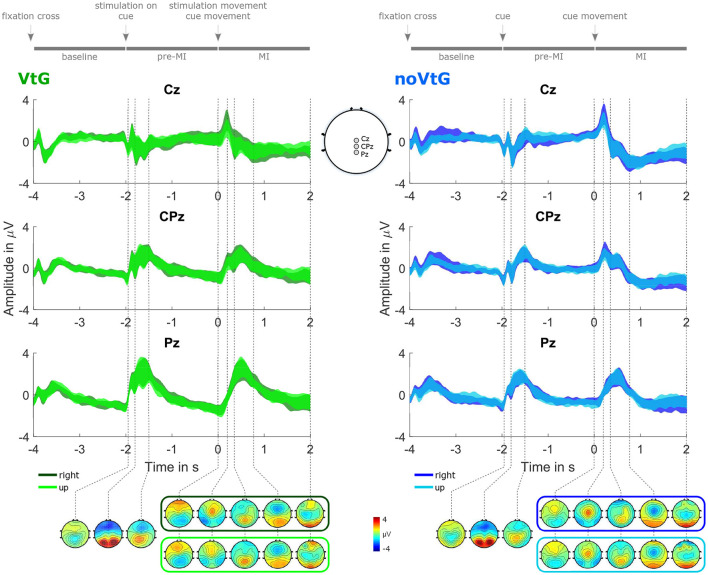
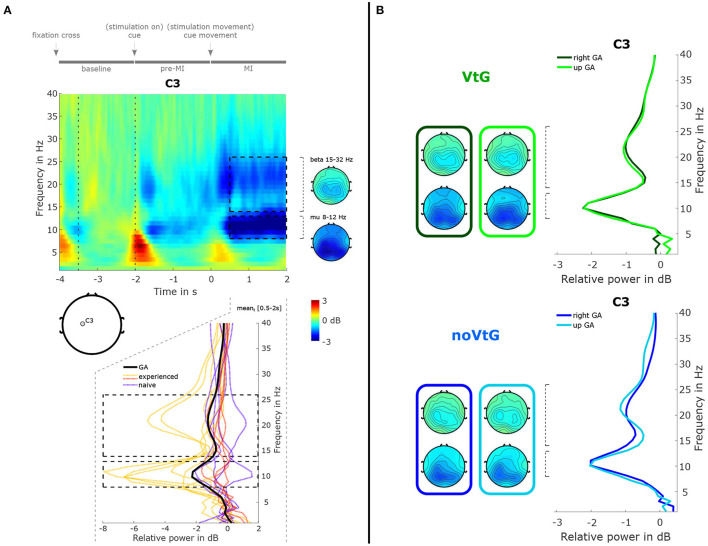
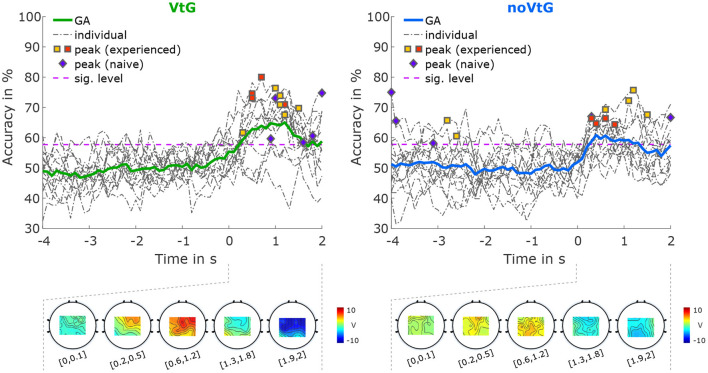
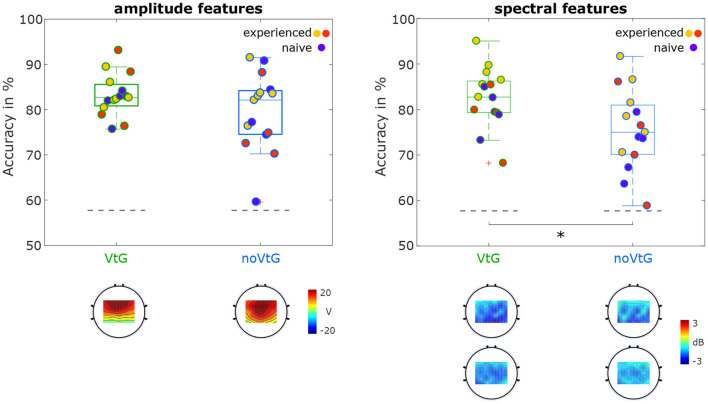
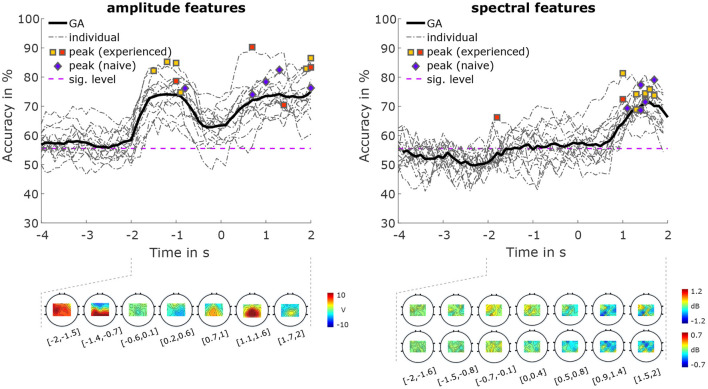
Motor imagery is a popular technique employed as a motor rehabilitation tool, or to control assistive devices to substitute lost motor function. In both said areas of application, artificial somatosensory input helps to mirror the sensorimotor loop by providing kinesthetic feedback or guidance in a more intuitive fashion than via visual input. In this work, we study directional and movement-related information in electroencephalographic signals acquired during a visually guided center-out motor imagery task in two conditions, i.e., with and without additional somatosensory input in the form of vibrotactile guidance. Imagined movements to the right and forward could be discriminated in low-frequency electroencephalographic amplitudes with group level peak accuracies of 70% with vibrotactile guidance, and 67% without vibrotactile guidance. The peak accuracies with and without vibrotactile guidance were not significantly different. Furthermore, the motor imagery could be classified against a resting baseline with group level accuracies between 76 and 83%, using either low-frequency amplitude features or μ and β power spectral features. On average, accuracies were higher with vibrotactile guidance, while this difference was only significant in the latter set of features. Our findings suggest that directional information in low-frequency electroencephalographic amplitudes is retained in the presence of vibrotactile guidance. Moreover, they hint at an enhancing effect on motor-related μ and β spectral features when vibrotactile guidance is provided.
Keywords: brain-computer interface; directional decoding; electroencephalography; kinesthetic guidance; motor imagery; vibrotactile guidance.
Copyright © 2021 Hehenberger, Batistic, Sburlea and Müller-Putz.
Conflict of interest statement
The authors declare that the research was conducted in the absence of any commercial or financial relationships that could be construed as a potential conflict of interest.
Figures
Similar articles
-
Detection of motor imagery based on short-term entropy of time-frequency representations.Biomed Eng Online. 2023 May 4;22(1):41. doi: 10.1186/s12938-023-01102-1. Biomed Eng Online. 2023. PMID: 37143020 Free PMC article.
-
Assessing the impact of vibrotactile kinaesthetic feedback on electroencephalographic signals in a center-out task.J Neural Eng. 2020 Oct 14;17(5):056032. doi: 10.1088/1741-2552/abb069. J Neural Eng. 2020. PMID: 33052887
-
Motor Imagery Classification Based on EEG Sensing with Visual and Vibrotactile Guidance.Sensors (Basel). 2023 May 25;23(11):5064. doi: 10.3390/s23115064. Sensors (Basel). 2023. PMID: 37299791 Free PMC article.
-
Decoding Imagined 3D Hand Movement Trajectories From EEG: Evidence to Support the Use of Mu, Beta, and Low Gamma Oscillations.Front Neurosci. 2018 Mar 20;12:130. doi: 10.3389/fnins.2018.00130. eCollection 2018. Front Neurosci. 2018. PMID: 29615848 Free PMC article.
-
From classic motor imagery to complex movement intention decoding: The noninvasive Graz-BCI approach.Prog Brain Res. 2016;228:39-70. doi: 10.1016/bs.pbr.2016.04.017. Epub 2016 May 31. Prog Brain Res. 2016. PMID: 27590965 Review.
Cited by
-
Improved motor imagery skills after repetitive passive somatosensory stimulation: a parallel-group, pre-registered study.Front Neural Circuits. 2025 Jan 7;18:1510324. doi: 10.3389/fncir.2024.1510324. eCollection 2024. Front Neural Circuits. 2025. PMID: 39839676 Free PMC article.
-
Feel Your Reach: An EEG-Based Framework to Continuously Detect Goal-Directed Movements and Error Processing to Gate Kinesthetic Feedback Informed Artificial Arm Control.Front Hum Neurosci. 2022 Mar 11;16:841312. doi: 10.3389/fnhum.2022.841312. eCollection 2022. Front Hum Neurosci. 2022. PMID: 35360289 Free PMC article. Review.
-
Vibration stimulation enhances robustness in teleoperation robot system with EEG and eye-tracking hybrid control.Front Bioeng Biotechnol. 2025 May 8;13:1591316. doi: 10.3389/fbioe.2025.1591316. eCollection 2025. Front Bioeng Biotechnol. 2025. PMID: 40458259 Free PMC article.
-
Towards unlocking motor control in spinal cord injured by applying an online EEG-based framework to decode motor intention, trajectory and error processing.Sci Rep. 2024 Feb 27;14(1):4714. doi: 10.1038/s41598-024-55413-x. Sci Rep. 2024. PMID: 38413782 Free PMC article.
-
Detection of motor imagery based on short-term entropy of time-frequency representations.Biomed Eng Online. 2023 May 4;22(1):41. doi: 10.1186/s12938-023-01102-1. Biomed Eng Online. 2023. PMID: 37143020 Free PMC article.
References
-
- Allison B. Z., Neuper C. (2010). Could anyone use a BCI?, in Brain-Computer Interfaces, eds D. S. Tan and A. Nijholt (London: Springer; ), 35–54. 10.1007/978-1-84996-272-8_3 - DOI
-
- Ang K. K., Guan C., Chua K. S. G., Ang B. T., Kuah C., Wang C., et al. . (2009). A clinical study of motor imagery-based brain-computer interface for upper limb robotic rehabilitation, in 2009 Annual International Conference of the IEEE Engineering in Medicine and Biology Society (Minneapolis, MN: ), 5981–5984. - PubMed
LinkOut - more resources
Full Text Sources
Research Materials