

A-Lipoic Acid Alleviates Folic Acid-Induced Renal Damage Through Inhibition of Ferroptosis
- PMID: 34630132
- PMCID: PMC8493959
- DOI: 10.3389/fphys.2021.680544
A-Lipoic Acid Alleviates Folic Acid-Induced Renal Damage Through Inhibition of Ferroptosis
Abstract
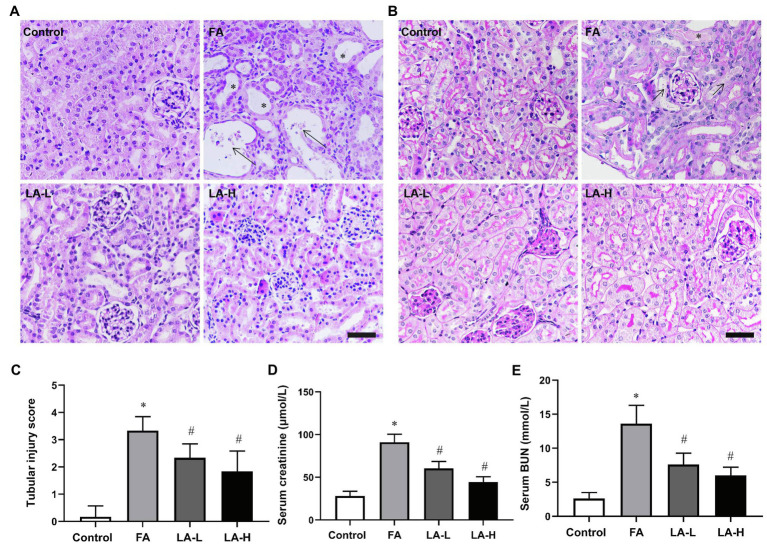
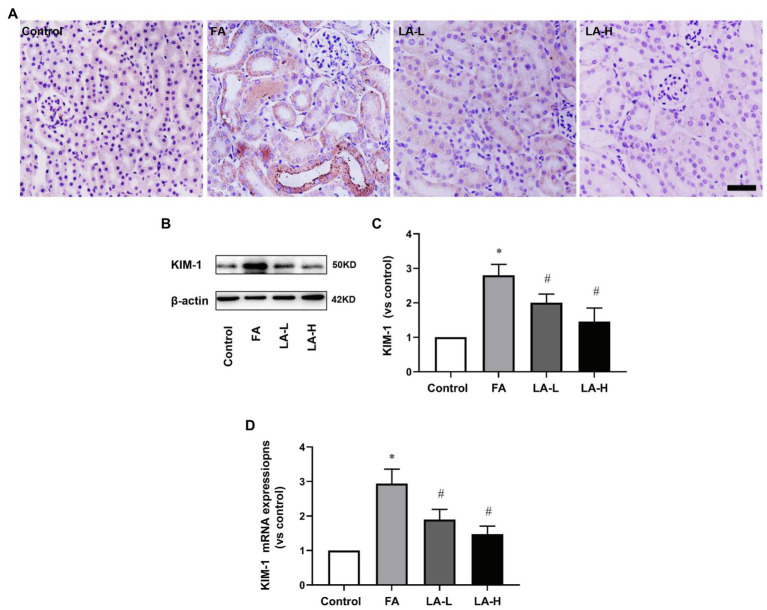
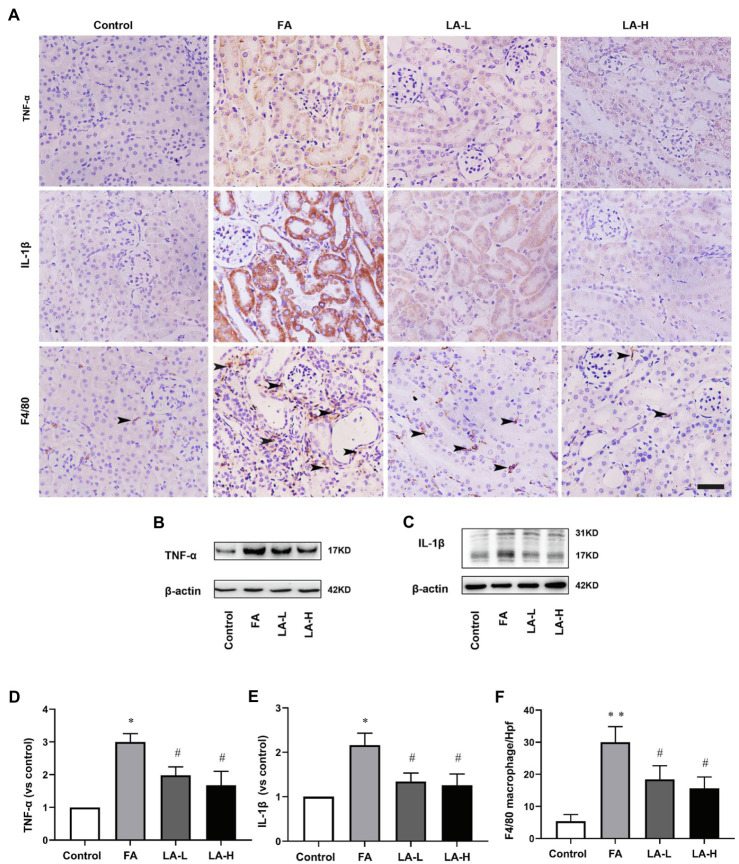
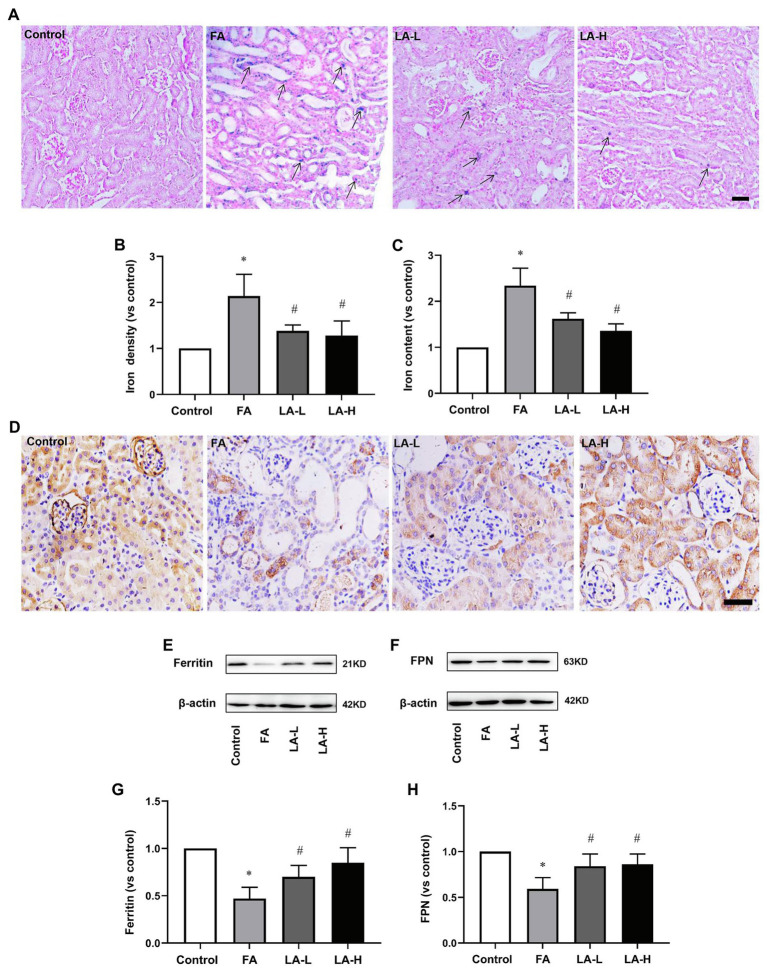
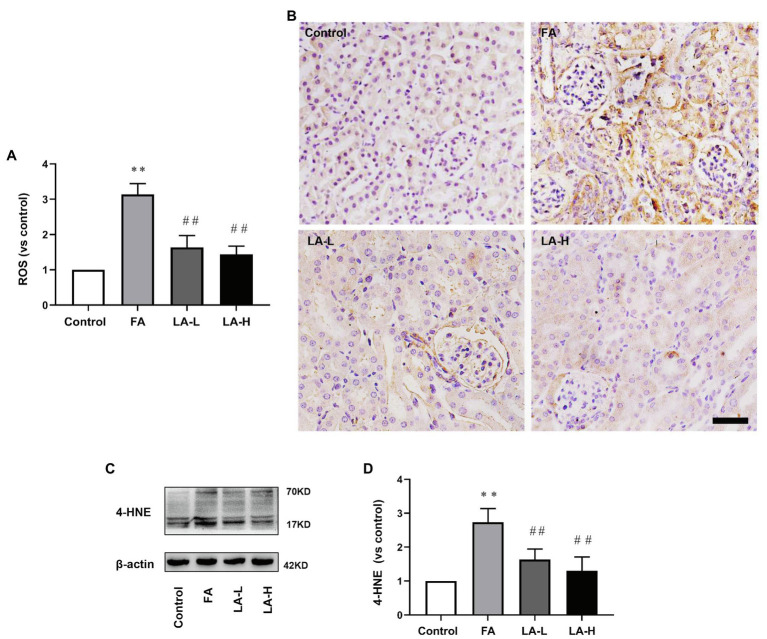
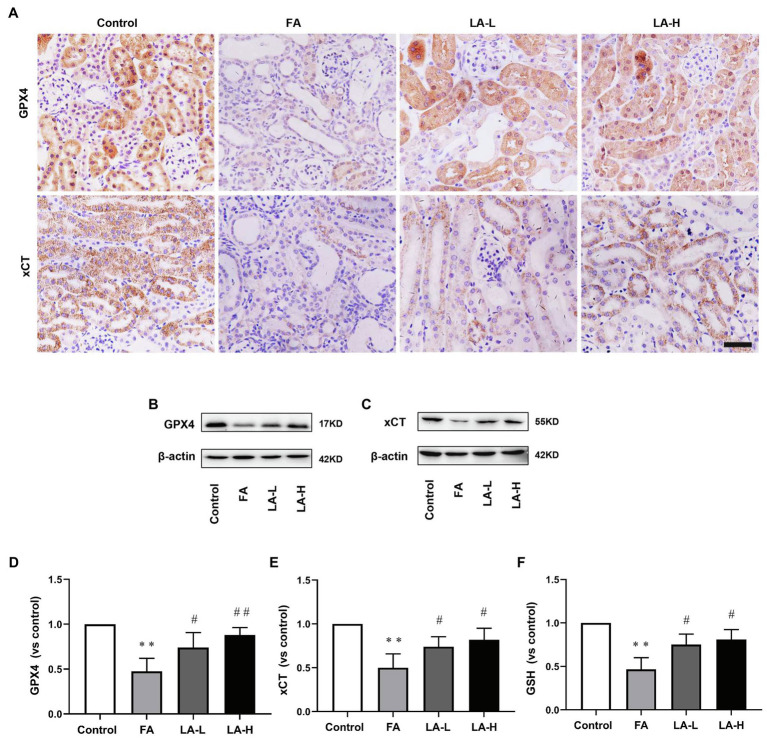
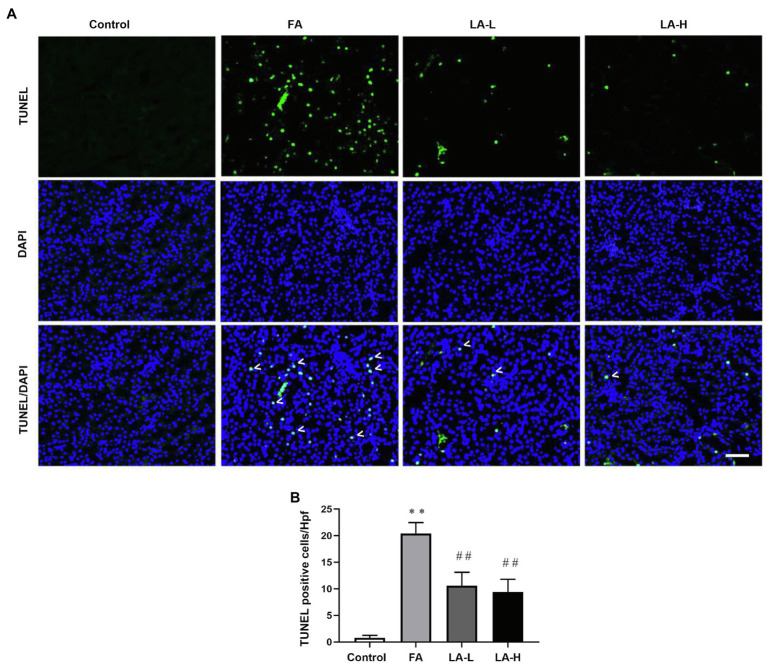
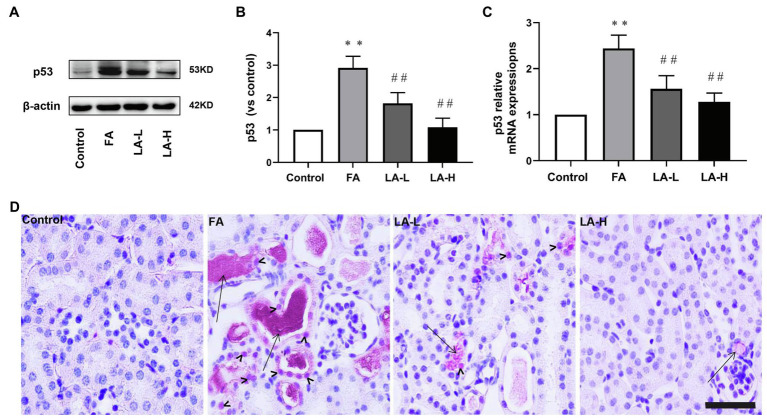
Folic acid (FA)-induced acute kidney injury (AKI) is characterized by the disturbance of redox homeostasis, resulting in massive tubular necrosis and inflammation. Α-lipoic acid (LA), as an antioxidant, has been reported to play an important role in renal protection, but the underlying mechanism remains poorly explored. The aim of this study is to investigate the protective effect of LA on FA-induced renal damage. Our findings showed that LA could ameliorate renal dysfunction and histopathologic damage induced by FA overdose injection. Moreover, FA injection induced severe inflammation, indicated by increased release of pro-inflammatory cytokines tumor necrosis factor (TNF)-α and IL-1β, as well as infiltration of macrophage, which can be alleviated by LA supplementation. In addition, LA not only reduced the cellular iron overload by upregulating the expressions of Ferritin and ferroportin (FPN), but also mitigated reactive oxygen species (ROS) accumulation and lipid peroxidation by increasing the levels of antioxidant glutathione (GSH) and glutathione peroxidase-4 (GPX4). More importantly, we found that LA supplementation could reduce the number of Terminal deoxynucleotidyl transferase dUTP nick end labeling (TUNEL)-positive tubular cells caused by FA, indicating that the tubular cell death mediated by ferroptosis may be inhibited. Further study demonstrated that LA supplementation could reverse the decreased expression of cystine/glutamate antiporter xCT (SLC7A11), which mediated GSH synthesis. What is more, mechanistic study indicated that p53 activation was involved in the inhibitory effect of SLC7A11 induced by FA administration, which could be suppressed by LA supplementation. Taken together, our findings indicated that LA played the protective effect on FA-induced renal damage mainly by inhibiting ferroptosis.
Keywords: A-lipoic acid; ferroptosis; folic acid; p53; renal damage.
Copyright © 2021 Li, Zou, Fu, Xing, Wang, Wan and Zhai.
Conflict of interest statement
The authors declare that the research was conducted in the absence of any commercial or financial relationships that could be construed as a potential conflict of interest.
Figures
Similar articles
-
Shenshuaifu Granule Attenuates Acute Kidney Injury by Inhibiting Ferroptosis Mediated by p53/SLC7A11/GPX4 Pathway.Drug Des Devel Ther. 2023 Nov 14;17:3363-3383. doi: 10.2147/DDDT.S433994. eCollection 2023. Drug Des Devel Ther. 2023. PMID: 38024532 Free PMC article.
-
Pretreatment with Roxadustat (FG-4592) Attenuates Folic Acid-Induced Kidney Injury through Antiferroptosis via Akt/GSK-3β/Nrf2 Pathway.Oxid Med Cell Longev. 2020 Jan 20;2020:6286984. doi: 10.1155/2020/6286984. eCollection 2020. Oxid Med Cell Longev. 2020. PMID: 32051732 Free PMC article.
-
α-Lipoic acid alleviates ferroptosis in the MPP+ -induced PC12 cells via activating the PI3K/Akt/Nrf2 pathway.Cell Biol Int. 2021 Feb;45(2):422-431. doi: 10.1002/cbin.11505. Epub 2020 Dec 8. Cell Biol Int. 2021. PMID: 33241887
-
Programmed Cell-Death by Ferroptosis: Antioxidants as Mitigators.Int J Mol Sci. 2019 Oct 8;20(19):4968. doi: 10.3390/ijms20194968. Int J Mol Sci. 2019. PMID: 31597407 Free PMC article. Review.
-
Lipid Peroxidation-Dependent Cell Death Regulated by GPx4 and Ferroptosis.Curr Top Microbiol Immunol. 2017;403:143-170. doi: 10.1007/82_2016_508. Curr Top Microbiol Immunol. 2017. PMID: 28204974 Review.
Cited by
-
Alpha-lipoic acid upregulates the PPARγ/NRF2/GPX4 signal pathway to inhibit ferroptosis in the pathogenesis of unexplained recurrent pregnancy loss.Open Med (Wars). 2024 Jun 5;19(1):20240963. doi: 10.1515/med-2024-0963. eCollection 2024. Open Med (Wars). 2024. PMID: 38859880 Free PMC article.
-
Protective effects of mefunidone on ischemia-reperfusion injury/Folic acid-induced acute kidney injury.Front Pharmacol. 2022 Nov 23;13:1043945. doi: 10.3389/fphar.2022.1043945. eCollection 2022. Front Pharmacol. 2022. PMID: 36506525 Free PMC article.
-
Tet1 deficiency exacerbates oxidative stress in acute kidney injury by regulating superoxide dismutase.Theranostics. 2023 Sep 25;13(15):5348-5364. doi: 10.7150/thno.87416. eCollection 2023. Theranostics. 2023. PMID: 37908721 Free PMC article.
-
Emerging significance and therapeutic targets of ferroptosis: a potential avenue for human kidney diseases.Cell Death Dis. 2023 Sep 22;14(9):628. doi: 10.1038/s41419-023-06144-w. Cell Death Dis. 2023. PMID: 37739961 Free PMC article. Review.
-
Experimental models for preclinical research in kidney disease.Zool Res. 2024 Sep 18;45(5):1161-1174. doi: 10.24272/j.issn.2095-8137.2024.072. Zool Res. 2024. PMID: 39257378 Free PMC article. Review.
References
-
- Ashour R. H., Saad M. A., Sobh M. A., Al-Husseiny F., Abouelkheir M., Awad A., et al. . (2016). Comparative study of allogenic and xenogeneic mesenchymal stem cells on cisplatin-induced acute kidney injury in Sprague-Dawley rats. Stem Cell Res. Ther. 7:126. doi: 10.1186/s13287-016-0386-0, PMID: - DOI - PMC - PubMed
LinkOut - more resources
Full Text Sources
Research Materials
Miscellaneous