. 2021 Sep 24:12:727000.
doi: 10.3389/fphys.2021.727000. eCollection 2021.

Secondhand Smoke Decreased Excitability and Altered Action Potential Characteristics of Cardiac Vagal Neurons in Mice

Affiliations

Secondhand Smoke Decreased Excitability and Altered Action Potential Characteristics of Cardiac Vagal Neurons in Mice

Junqing Sun et al. Front Physiol. .

Abstract

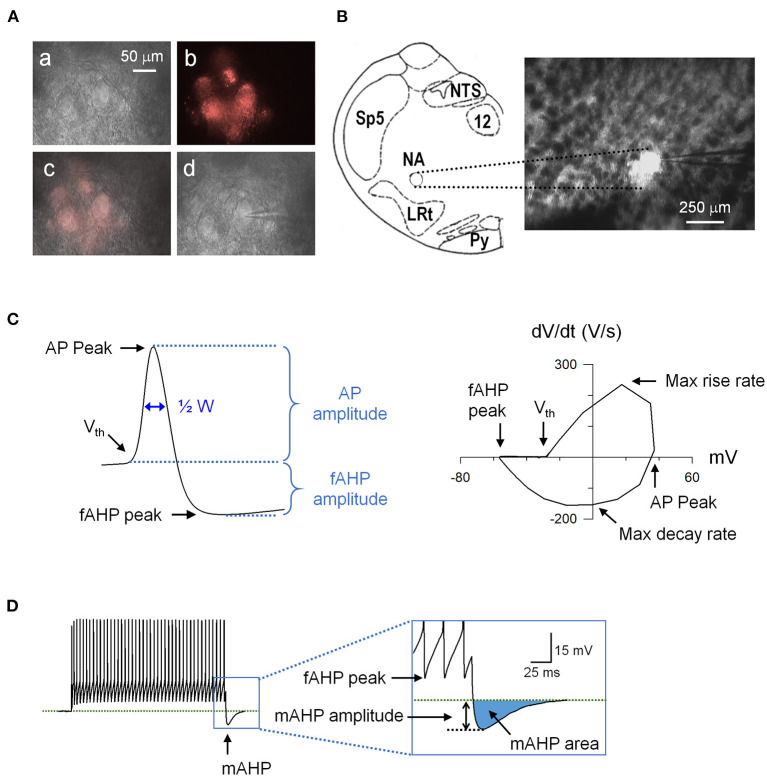
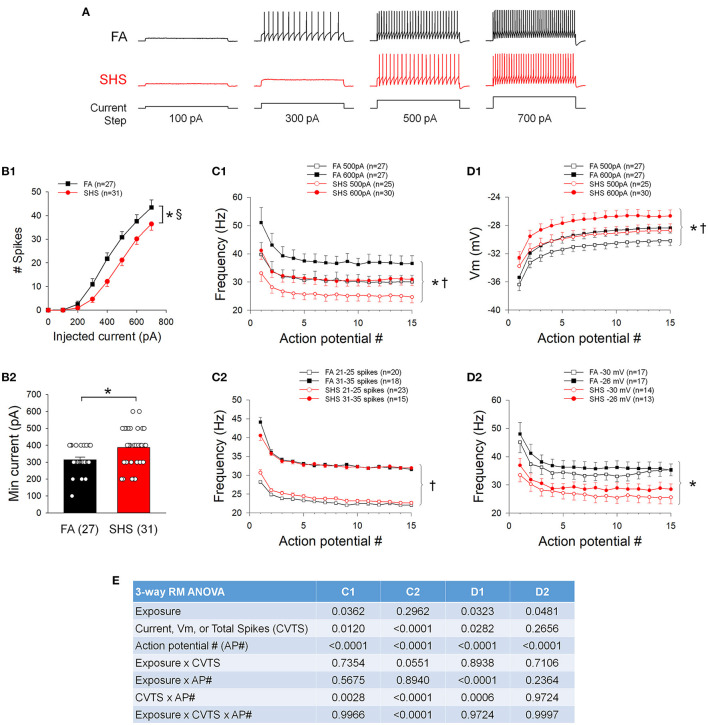
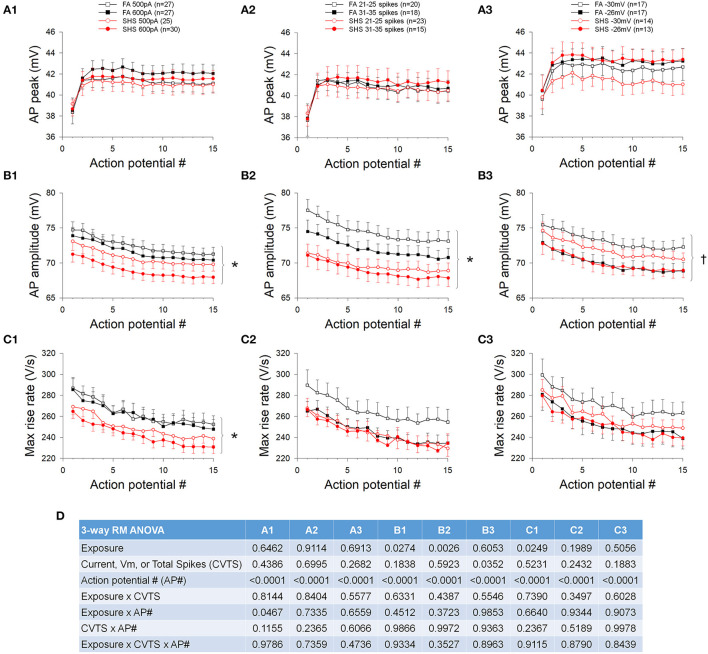
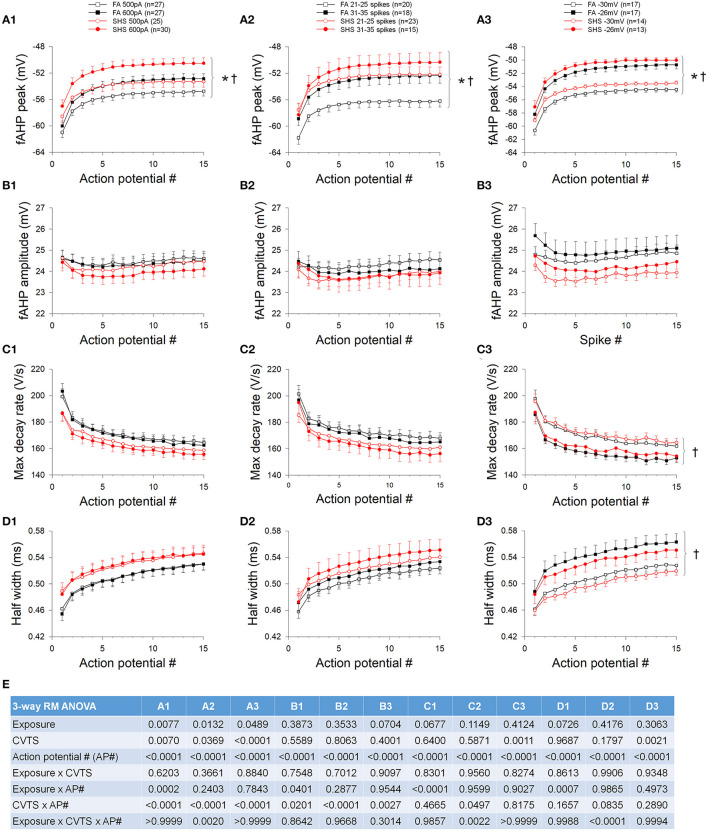
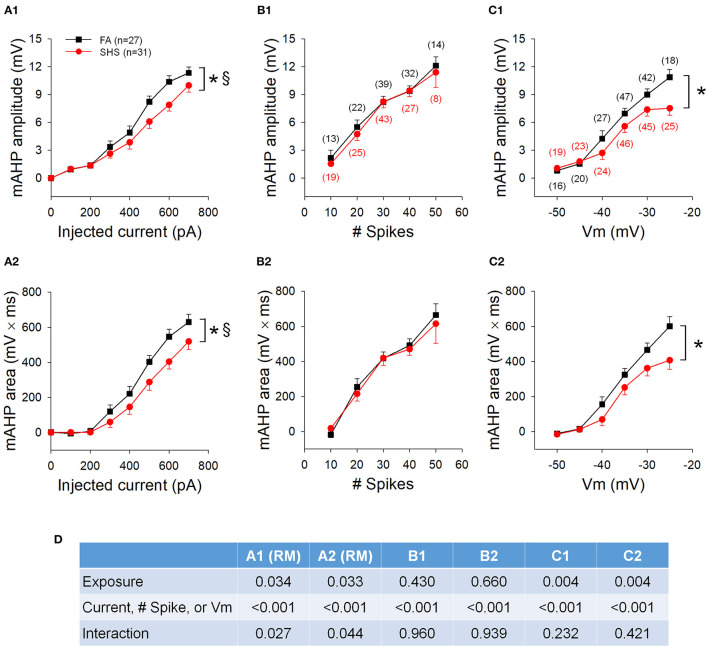
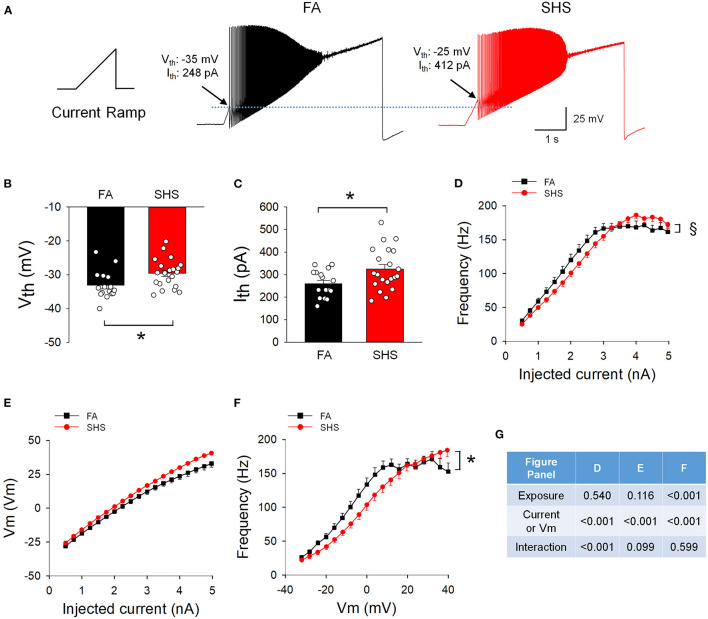
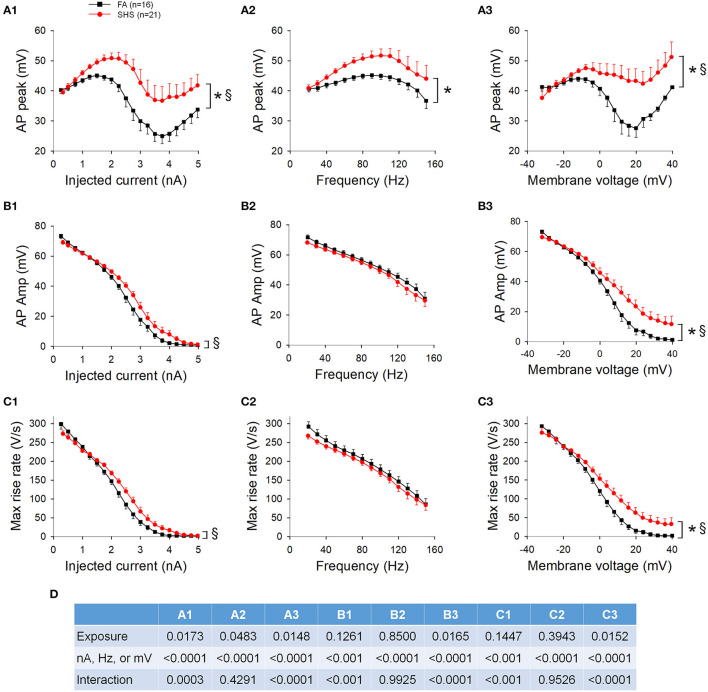
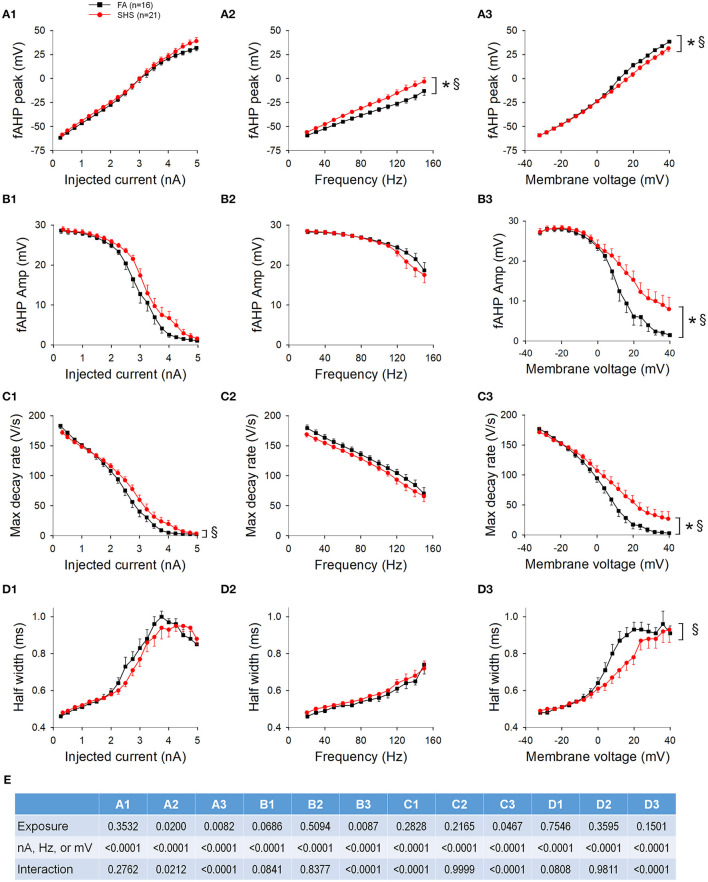
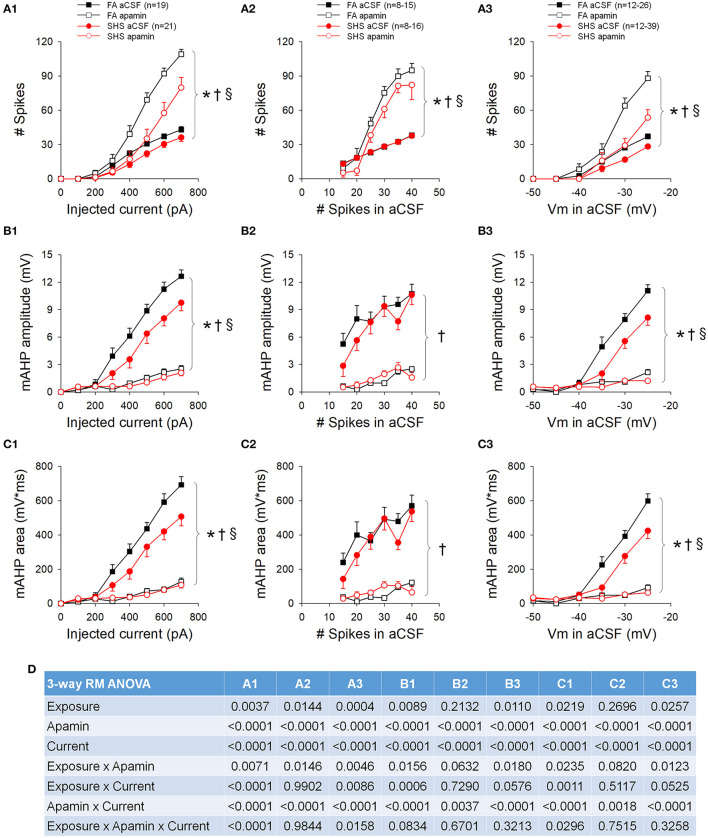
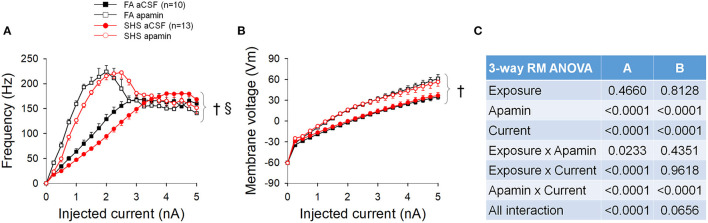
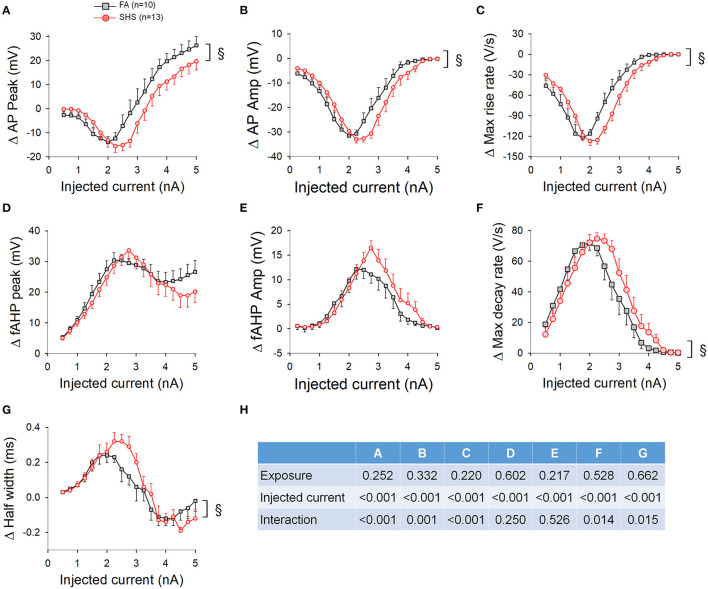
Background: Secondhand smoke (SHS), a major indoor pollutant, is a significant risk factor for cardiovascular morbidity and mortality including arrhythmias and sudden cardiac death. Exposure to SHS can produce autonomic imbalance, as evidenced by reduced heart rate variability (HRV)-a clinical metric of cardiac vagal regulation. Currently, the mechanisms through which SHS changes the vagal preganglionic neuronal inputs to the heart to produce this remains unknown. Objectives: To characterize the effect of SHS on both the excitability and action potential (AP) characteristics of anatomically identified cardiac vagal neurons (CVNs) in the nucleus ambiguus and examine whether SHS alters small conductance calcium-activated potassium (SK) channel activity of these CVNs. Methods: Adult male mice were exposed to four weeks of filtered air or SHS (3 mg/m3) 6 h/day, 5 day/week. Using patch-clamp recordings on identified CVNs in brainstem slices, we determined neuronal excitability and AP characteristics with depolarizing step- and ramp-current injections. Results: Four weeks of SHS exposure reduced spiking responses to depolarizing current injections and increased AP voltage threshold in CVNs. Perfusion with apamin (20 nM) magnified these SHS-induced effects, suggesting reduced SK channel activity may serve to minimize the SHS-induced decreases in CVNs excitability. Medium afterhyperpolarization (a measurement of SK channel activity) was smaller in the SHS group, further supporting a lower SK channel activity. AP amplitude, rise rate, fast afterhyperpolarization amplitude (a measurement of voltage-gated channel activity), and decay rate were higher in the SHS group at membrane voltages more positive to 0 mV, suggesting altered inactivation properties of voltage-dependent channels underlying APs. Discussion: SHS exposure reduced neuronal excitability of CVNs with compensatory attenuation of SK channel activity and altered AP characteristics. Neuroplasticity of CVNs could blunt regulatory cardiac vagal signaling and contribute to the cardiovascular consequences associated with SHS exposure, including reduced HRV.

Keywords: SK channel; autonomic function; cardiovascular; environmental tobacco smoke; neuroplasticity; nucleus ambiguus; spiking activity.


Conflict of interest statement

The authors declare that the research was conducted in the absence of any commercial or financial relationships that could be construed as a potential conflict of interest.

Figures

Figure 1
Figure 1
An example of retrogradely labeled cardiac vagal neurons (CVNs) and action potential (AP) analysis. (A) (a) Nucleus ambiguus region viewed at 40x with Infrared-differential interference contrast (IR-DIC). (b) The same region viewed with a fluorescence filter for DiI. (c) Overlay of the IR-DIC and fluorescence images. (d) An identified CVN with a patch electrode in whole-cell configuration. (B) Schematic drawing of the recording site (left) and the brainstem slice containing the nucleus ambiguus viewed at 5x. LRt, lateral reticular nucleus; NA, nucleus ambiguus; NTS, nucleus tractus solitarii; Py, pyramidal tract; Sp5, spinal trigeminal nucleus; 12, hypoglossal nucleus. (C) A recorded action potential (left) and its phase plane plot (right) showing the measured parameters. (D) Spiking response to a 1-s depolarizing current step showing the mAHP. AHP, afterhyperpolarization; ½ W, AP half width.
Figure 2
Figure 2
Effects of SHS on neuronal response to 1 s depolarizing current steps. (A) Example traces of depolarizing current injection induced spiking responses of CVNs from one filtered air (FA) and one secondhand smoke (SHS) exposed group. (B1) Total number of spikes discharged to 1 s depolarizing current steps. CVNs from the SHS exposed group had a lower spiking response compared to those from the FA group (two-way repeated measures ANOVA: p = 0.017 for exposure, p < 0.001 for injected current and p < 0.001 for interaction). (B2) Minimum current that evoked an AP was significantly higher in the SHS group (Mann-Whitney Rank Sum Test, p = 0.012). (C1) Instantaneous frequency of the first 15 APs at injected currents of 500 and 600 pA. Neurons from both groups showed similar frequency adaptation, albeit lower overall frequency in the SHS group compared to the FA control group. (C2) Instantaneous frequency of the first 15 APs from neurons discharged a total of 21–25 spikes and 31–35 spikes in response to 1 s depolarizing current steps, further demonstrate that there was no difference in frequency adaptation between FA and SHS exposed groups. (D1) Membrane voltage (Vm) at 500 and 600 pA current steps. Compared to the FA group, the membrane voltage was significantly more depolarized in the SHS group at each injected current, suggesting that the reduced spiking response in SHS group is not due to a more hyperpolarized membrane voltage at each injected current. (D2) Instantaneous frequency of the first 15 action potentials at two membrane voltages (−31 to −29 mV and −27 to −25 mV for −30 and −26 mV, respectively) demonstrating that the reduced spiking activity in SHS group persisted at similar membrane voltages. (E) Three-way repeated measures ANOVA results for panels (C1,C2,D1,D2). *p < 0.05 SHS vs. FA, p < 0.05 main effects for current or total spikes, §p < 0.05 exposure x current interaction.
Figure 3
Figure 3
Effects of SHS on AP upstroke characteristics of the first 15 APs during step current injections. (A) Absolute AP peak voltage. There was no significant exposure effect on the AP peak whether grouping the data with same injected currents (A1), total number of spikes (A2) or membrane voltages (A3). (B) AP amplitude (measured from voltage threshold to AP peak). SHS exposure group had significantly lower AP amplitude when grouped with same injected currents (B1) or total number of spikes (B2) but not with same membrane voltages (B3). (C) AP maximum rise rate. Compared to the FA group, the SHS group had a lower rise rate at the same injected current (C1). There was no difference when grouping data by total number of spikes (C2) or membrane voltages (C3). (D) Three-way repeated measures ANOVA results. CVTS, injected current, membrane voltage, or total spikes. *p < 0.05 SHS vs. FA, p < 0.05 main effect for membrane voltage.
Figure 4
Figure 4
Effects of SHS on AP downstroke characteristics of the first 15 APs during step current injections. (A) Absolute fAHP peak voltage. The SHS group had more depolarized fAHP peak at same injected currents (A1), total number of spikes (A2), and membrane voltages (A3). (B) fAHP amplitude (measured from voltage threshold to fAHP peak). SHS did not have significant effects on fAHP amplitude. (C) AP maximum decay rate showing no exposure effect whether the data were groups by injected current (C1), total number of spikes (C2), or membrane voltage (C3). (D) AP half width showing no difference between FA and SHS whether grouping the data by injected current (D1), total number of spikes (D2) or membrane voltage (D3). (E) Three-way repeated measures ANOVA results. CVTS, injected current, membrane voltage, or total spikes. *p < 0.05 SHS vs. FA, p < 0.05 main effect for current, total spikes, or membrane voltage.
Figure 5
Figure 5
Effects of SHS on mAHP amplitude and mAHP area. (A) mAHP amplitude (A1) and area (A2) at the same injected currents were smaller in the SHS exposed group. (B) mAHP amplitude (B1) and area (B2) plotted against the total number of spikes discharged during the 1 s step current injection. There was no difference between the FA and SHS groups. (C) mAHP plotted against average membrane voltage (Vm) during 1 s step current injections showing smaller mAHP amplitude (C1) and area (C2) in the SHS group. (D) Two-way ANOVA results. RM, repeated measures; Numbers in parentheses indicate number of neurons. *p < 0.05 SHS vs. FA, §p < 0.05 exposure x current interaction.
Figure 6
Figure 6
Effects of SHS on spiking responses to a ramp current injection (5 nA in 5 s). (A) Example traces of neurons from one FA and one SHS exposed group. Arrows indicate the membrane voltage and injected current where the first action potential was discharged and was designated as voltage threshold (Vth) and current threshold (Ith) respectively. (B) Group data of voltage threshold showing a significantly higher threshold for neurons from the SHS group (t-test, p = 0.0166). (C) Group data of current threshold showing that higher input currents were required to evoke an action potential in the SHS group (t-test, p = 0.0141). (D) Instantaneous frequency during the 5-s ramp current injection. The significant exposure by current interaction indicates that the SHS group had a flatter increase in instantaneous frequency as the injected current increased (flatter input-output relationship). (E) Membrane voltage during the ramp current injection showing no difference between FA and SHS, suggesting that the flatter input-output relation to current injection is not due to a smaller membrane voltage response to the injected current. (F) Instantaneous frequency plotted against membrane voltage during the 5-s ramp current injection. The SHS group had lower spiking frequency at the same voltages. (G) Two-way repeated measures ANOVA results for panels (D–F). Sample size: n = 16 for FA and n = 21 for SHS. *p < 0.05 SHS vs. FA, §p < 0.05 exposure x current interaction.
Figure 7
Figure 7
Effects of SHS on AP upstroke characteristics over the 5-s ramp current injection. (A) AP peak was higher in SHS group at higher injected current (A1), discharge frequency (A2), and membrane voltage (A3). (B) AP amplitude was larger at higher injected current (B1) and membrane voltage (B3). AP amplitude was similar at the same discharge frequency (B2). (C) AP maximum rise rate. As the injected current increased, the decrease in the rise rate was steeper in the FA group (C1). The difference vanished when plotting against discharge frequency (C2) and persisted when plotting against membrane voltage (C3). (D) Two-way repeated measures ANOVA results. *p < 0.05 SHS vs. FA, §p < 0.05 interaction.
Figure 8
Figure 8
Effects of SHS on AP downstroke characteristics over the 5-s ramp current injection. (A) intra-train fAHP peak. There was no difference in fAHP peak when plotting against injected current (A1). However, there was a significantly more depolarized fAHP peak in the SHS group at same discharge frequency (A2) and a small but significantly more hyperpolarized fAHP peak at positive membrane voltages (A3). (B) fAHP amplitude in the SHS group was not different from the FA group with increasing injected current (B1) and discharge frequency (B2) but was significantly larger at higher membrane voltage (B3). (C) AP maximum decay rate showing no difference between FA and SHS at same injected current (C1) and discharge frequency (C2) but a greater decay rate at positive membrane voltages in the SHS group (C3). (D) AP half width was smaller in the SHS group at higher membrane voltage (D3). There was no difference at the same injected currents (D1) or discharge frequency (D2). *p < 0.05 SHS vs. FA, §p < 0.05 interaction. (E) Two-way repeated measures ANOVA results.
Figure 9
Figure 9
Effects of apamin on spiking responses to step current injections. (A) Spiking responses to step current injections before (aCSF) and during apamin perfusion. Apamin had a smaller effect in the SHS group at a given injected current (A1), total number of spikes (A2), and membrane voltage (A3). (B) mAHP amplitude before and during apamin perfusion. Apamin had a smaller effect in the SHS group at same injected current (B1) and membrane voltage (B3) but not at same total discharge rate (B2). (C) mAHP area before and during apamin perfusion. As in the case of mAHP amplitude, apamin had a smaller effect in the SHS group at same injected current (C1) and membrane voltage (C3) but not at same total discharge rate (C2). (D) Three-way repeated measures ANOVA results. *p < 0.05 SHS vs. FA, p < 0.05 apamin vs. aCSF, §p < 0.05 exposure x apamin interaction.
Figure 10
Figure 10
Spiking and membrane voltage responses to a ramp current injection in the absence and presence of apamin. (A) Apamin significantly increased spiking response to current injection. (B) Apamin similarly increased membrane voltage response to current injection. (C) Three-way repeated measures ANOVA results. p < 0.05 apamin vs. aCSF, §p < 0.05 exposure x apamin interaction.
Figure 11
Figure 11
Apamin-induced changes in AP characteristics over the 5-s ramp current injection. Apamin-induced changes in AP peak (A), AP amplitude (B), and maximum rise rate (C) showed a shift toward higher injected current in the SHS group. Apamin-induced changes on fAHP peak (D) and amplitude (E) were not different between the FA and SHS groups. AP maximum decay rate (F) and half width (G) also showed a shift toward higher injected current in the SHS group. (H) Two-way repeated measures ANOVA results. §p < 0.05 interaction.

Similar articles

Cited by

References

    1. Agelink M. W., Majewski T., Wurthmann C., Postert T., Linka T., Rotterdam S., et al. . (2001). Autonomic neurocardiac function in patients with major depression and effects of antidepressive treatment with nefazodone. J. Affect. Disord. 62, 187–198. 10.1016/S0165-0327(99)00202-5 - DOI - PubMed
    1. Aronow W. S., Stemmer E. A., Zweig S. (1979). Carbon monoxide and ventricular fibrillation threshold in normal dogs. Arch. Environ. Health 34, 184–186. 10.1080/00039896.1979.10667394 - DOI - PubMed
    1. Bailey T. W., Jin Y. H., Doyle M. W., Andresen M. C. (2002). Vanilloid-sensitive afferents activate neurons with prominent A-type potassium currents in nucleus tractus solitarius. J. Neurosci. 22, 8230–8237. 10.1523/JNEUROSCI.22-18-08230.2002 - DOI - PMC - PubMed
    1. Baranauskas G. (2007). Ionic channel function in action potential generation: current perspective. Mol. Neurobiol. 35, 129–150. 10.1007/s12035-007-8001-0 - DOI - PubMed
    1. Barnoya J., Glantz S. A. (2005). Cardiovascular effects of secondhand smoke: nearly as large as smoking. Circulation 111, 2684–2698. 10.1161/CIRCULATIONAHA.104.492215 - DOI - PubMed