. 2021 Sep 24:12:728683.
doi: 10.3389/fphys.2021.728683. eCollection 2021.

Myofibril and Mitochondrial Area Changes in Type I and II Fibers Following 10 Weeks of Resistance Training in Previously Untrained Men

Affiliations

Myofibril and Mitochondrial Area Changes in Type I and II Fibers Following 10 Weeks of Resistance Training in Previously Untrained Men

Bradley A Ruple et al. Front Physiol. .

Abstract

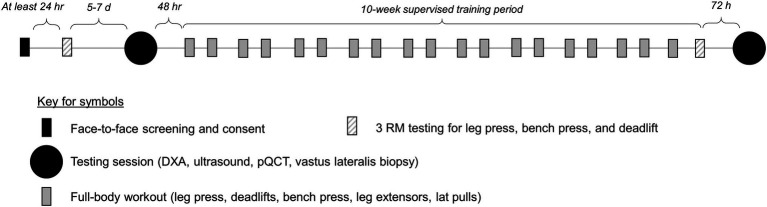
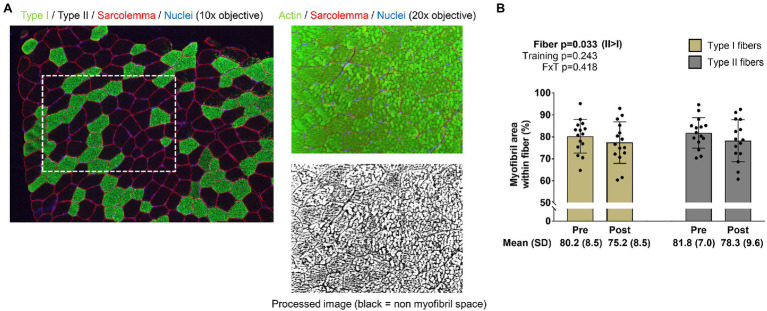
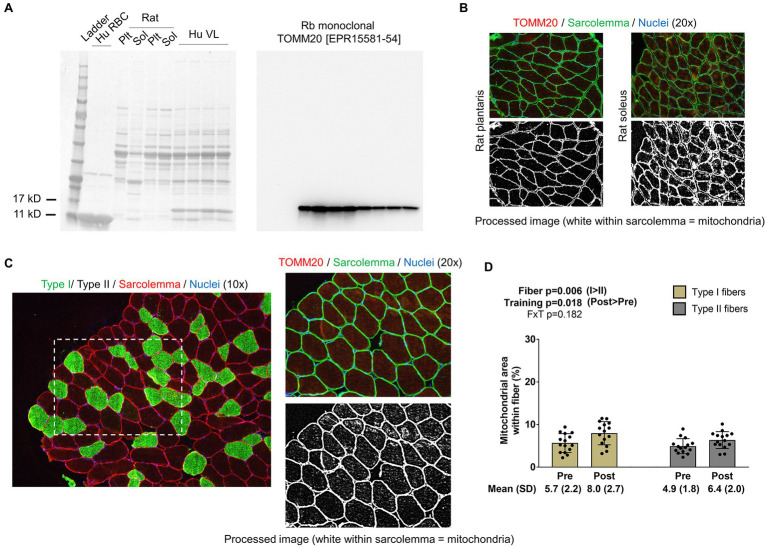
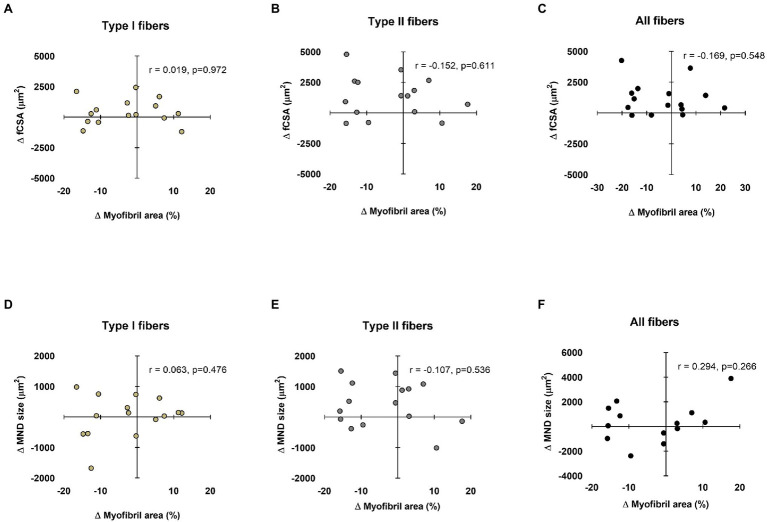
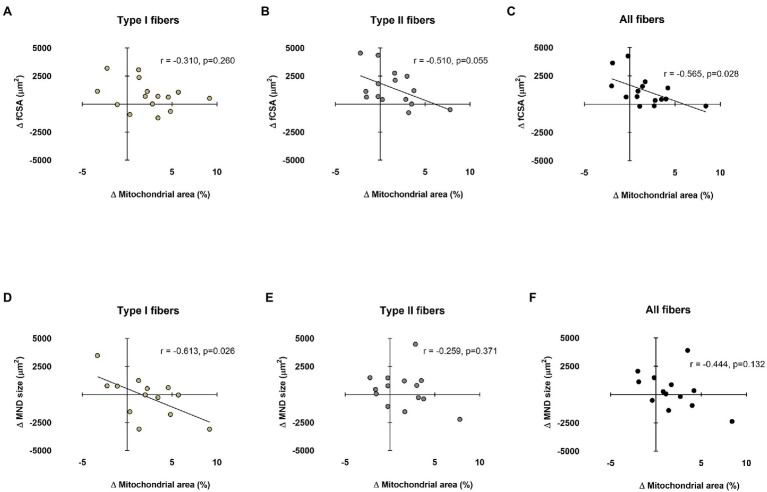
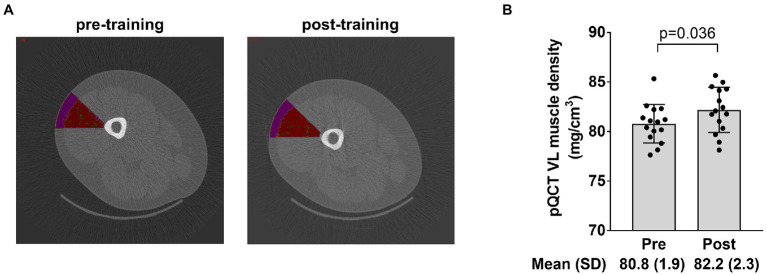
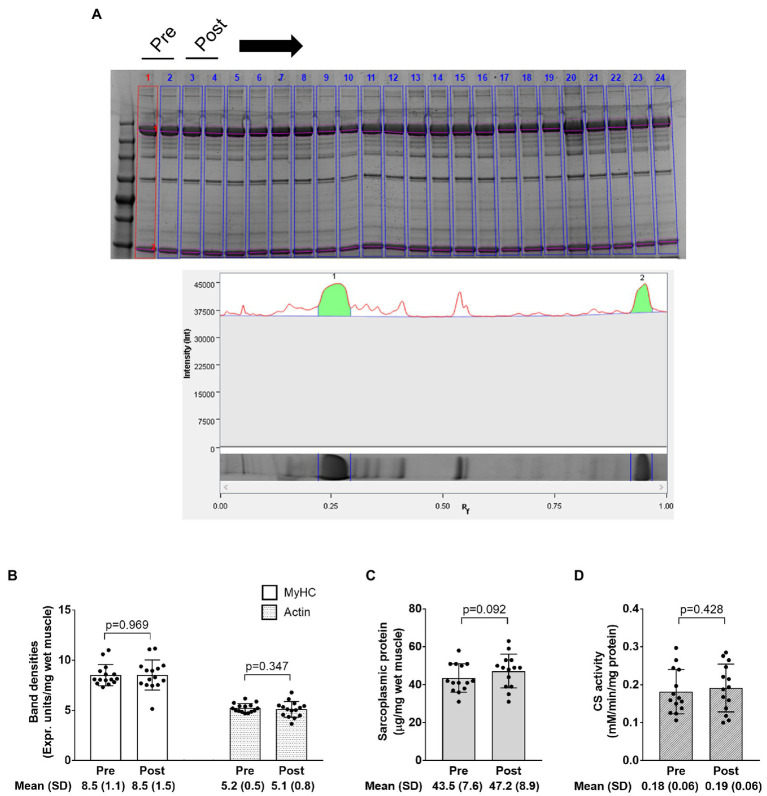
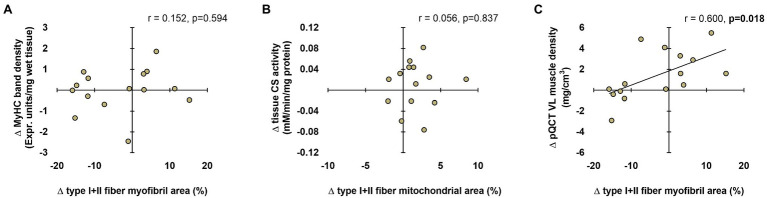
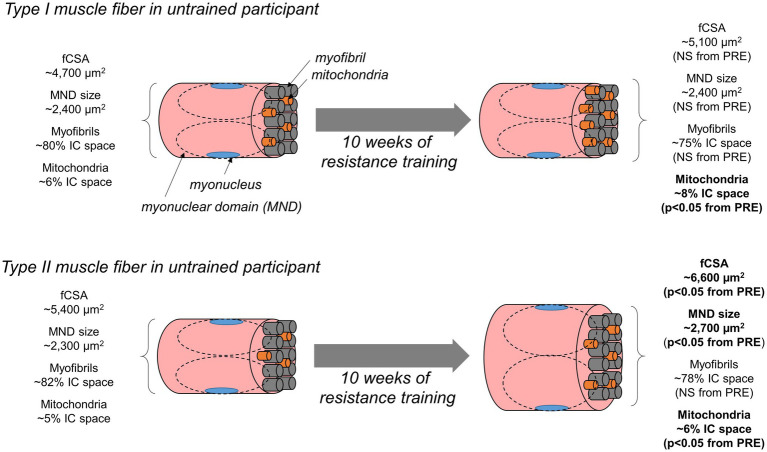
Resistance training increases muscle fiber hypertrophy, but the morphological adaptations that occur within muscle fibers remain largely unresolved. Fifteen males with minimal training experience (24±4years, 23.9±3.1kg/m2 body mass index) performed 10weeks of conventional, full-body resistance training (2× weekly). Body composition, the radiological density of the vastus lateralis muscle using peripheral quantitative computed tomography (pQCT), and vastus lateralis muscle biopsies were obtained 1week prior to and 72h following the last training bout. Quantification of myofibril and mitochondrial areas in type I (positive for MyHC I) and II (positive for MyHC IIa/IIx) fibers was performed using immunohistochemistry (IHC) techniques. Relative myosin heavy chain and actin protein abundances per wet muscle weight as well as citrate synthase (CS) activity assays were also obtained on tissue lysates. Training increased whole-body lean mass, mid-thigh muscle cross-sectional area, mean and type II fiber cross-sectional areas (fCSA), and maximal strength values for leg press, bench press, and deadlift (p<0.05). The intracellular area occupied by myofibrils in type I or II fibers was not altered with training, suggesting a proportional expansion of myofibrils with fCSA increases. However, our histological analysis was unable to differentiate whether increases in myofibril number or girth occurred. Relative myosin heavy chain and actin protein abundances also did not change with training. IHC indicated training increased mitochondrial areas in both fiber types (p=0.018), albeit CS activity levels remained unaltered with training suggesting a discordance between these assays. Interestingly, although pQCT-derived muscle density increased with training (p=0.036), suggestive of myofibril packing, a positive association existed between training-induced changes in this metric and changes in mean fiber myofibril area (r=0.600, p=0.018). To summarize, our data imply that shorter-term resistance training promotes a proportional expansion of the area occupied by myofibrils and a disproportional expansion of the area occupied by mitochondria in type I and II fibers. Additionally, IHC and biochemical techniques should be viewed independently from one another given the lack of agreement between the variables assessed herein. Finally, the pQCT may be a viable tool to non-invasively track morphological changes (specifically myofibril density) in muscle tissue.

Keywords: histology; mitochondria; myofibrils; peripheral quantitative computed tomography; resistance training.


Conflict of interest statement

MR receives laboratory funding from various industry sources in the form of fixed-price contracts or laboratory gifts. MR has also been financially compensated by various industry entities for consultation work regarding scientific presentations and/or various scientific writing endeavors in accordance with Auburn University’s Research Compliance and Ethics Guidelines. In relation to the current study, however, none of the authors has financial or other conflicts of interest to report. The remaining authors declare that the research was conducted in the absence of any commercial or financial relationships that could be construed as a potential conflict of interest.

Figures

Figure 1
Figure 1
Study design. This figure illustrates the study design.
Figure 2
Figure 2
Type I and II fiber myofibril areas with training. The figure in panel A is from IHC and phalloidin-actin staining; specifically, this figure demonstrates how myofibril areas were quantified using 20x images and cross-referenced to fiber type from 10x images of serial sections. Panel B shows how training affected myofibril areas in type I and II fibers. Bar graph data are presented as means ± standard deviation values, and individual participant data are overlaid. n=15 participants. Abbreviation: FxT, fiber x training interaction.
Figure 3
Figure 3
Type I and II fiber mitochondrial areas with training. Panel A shows Western blotting validation results regarding the veracity of the TOMM20 antibody. The left inset is the Ponceau stain of human red blood cells (Hu RBC), rat plantaris (Plt) and soleus (Sol) lysates, and human vastus lateralis muscle (Hu VL). The right inset contains results from Western blotting. Panel B shows IHC validation results from rat Plt and Sol muscles (20x images). Panel C shows IHC and TOMM20 staining from our human participants; specifically, this figure demonstrates how mitochondrial areas were quantified using 20x images and cross-referenced to fiber type from 10x images of serial sections. Panel D shows how training affected mitochondrial areas in type I and II fibers. Bar graph data are presented as means ± standard deviation values, and individual participant data are overlaid. n=15 participants. Abbreviation: FxT, fiber x training interaction.
Figure 4
Figure 4
Relationships between myonuclear domain and fiber cross-sectional area (fCSA) sizes versus myofibril area. These plots demonstrate the relationships between changes in type I, II, and mean fCSA versus change in myofibril area (panels A–C, respectively), as well as the change in type I, II, and mean fiber myonuclear domain (MND) sizes versus change in myofibril area (panels D–F, respectively). n=13-15 participants in each panel.
Figure 5
Figure 5
Relationships between myonuclear domain and fCSA sizes versus mitochondrial area. These plots demonstrate the relationships between changes in type I, II, and mean fCSA versus change in mitochondrial area (panels A–C, respectively) and the change in type I, II, and mean fiber myonuclear domain (MND) sizes versus change in mitochondrial area (panels D–F, respectively). n=13-15 participants in each panel.
Figure 6
Figure 6
Radiological density data of the vastus lateralis. The figure in panel A demonstrates the region of interest drawn over the mid-thigh scan to extrapolate tissue density in a portion of the vastus lateralis (where the biopsy occurred) with the intent of correlating these data to vastus lateralis mean (type I and II) myofibril area. Panel B shows how training affected vastus lateralis (VL) density. Bar graph data are presented as means ± standard deviation (SD) values, and individual participant data are overlaid. n=15 participants.
Figure 7
Figure 7
Electrophoresis, sarcoplasmic protein, and CS activity data. The figure in panel A is from SDS-PAGE; specifically, this figure demonstrates how the relative densities of myosin heavy chain and actin (lane 1 in this image) were quantified using band densitometry. Panel B shows how training affected relative myosin heavy chain (MyHC) and actin protein content per milligram wet muscle. Panel C shows how training affected sarcoplasmic protein concentrations per milligram wet muscle. Panel D shows how training affected CS activity levels, a surrogate of mitochondrial volume density. Bar graph data are presented as means ± standard deviation values, and individual participant data are overlaid. n=14 participants in the CS activity and sarcoplasmic protein panels, and n=15 participants in other panels.
Figure 8
Figure 8
Associations between histology, biochemical, and radiological techniques. These plots demonstrate the relationships between changes in type I+II fiber myofibril area versus change in tissue myosin heavy chain band density (panel A), changes in type I+II mitochondrial area versus change in tissue CS activity (panel B), and changes in type I+II fiber myofibril area versus change in tissue pQCT-derived vastus lateralis (VL) muscle density (panel C). n=15 participants in each panel.
Figure 9
Figure 9
Summary figure of findings. This schematic illustrates our findings. In short, 10weeks of resistance training in untrained men increased type II fCSA (not type I fCSA). Additionally, type II fiber myonuclear domain size increased in type II fibers only. The space occupied by myofibrils did not statistically change in type I or type II fibers. Since increases in type II fCSA occurred, this implies myofibril expansion proportionally occurred with fiber growth. Notwithstanding, we are unsure as to whether this occurred via an increase in myofibril number or an increase in the girth of pre-existing myofibrils (not determined herein due to histology limitations). Interestingly, the disproportional increase in the area occupied by mitochondria evidenced through TOMM20 staining suggests the expansion of the mitochondria occurred in type I fibers without fCSA increase, and this expansion occurred more rapidly than changes in fCSA in type II fibers.

References

    1. Allen D. L., Roy R. R., Edgerton V. R. (1999). Myonuclear domains in muscle adaptation and disease. Muscle Nerve 22, 1350–1360. doi: 10.1002/(SICI)1097-4598(199910)22:10<1350::AID-MUS3>3.0.CO;2-8, PMID: - DOI - PubMed
    1. Alway S. E., Macdougall J. D., Sale D. G., Sutton J. R., Mccomas A. J. (1988). Functional and structural adaptations in skeletal muscle of trained athletes. J. Appl. Physiol. 64, 1114–1120. doi: 10.1152/jappl.1988.64.3.1114 - DOI - PubMed
    1. American College of Sports, M. Sawka M. N., Burke L. M., Eichner E. R., Maughan R. J., Montain S. J., et al. . (2007). American College of Sports Medicine position stand. Exercise and fluid replacement. Med. Sci. Sports Exerc. 39, 377–390. doi: 10.1249/mss.0b013e31802ca597, PMID: - DOI - PubMed
    1. Claassen H., Gerber C., Hoppeler H., Luthi J. M., Vock P. (1989). Muscle filament spacing and short-term heavy-resistance exercise in humans. J. Physiol. 409, 491–495. doi: 10.1113/jphysiol.1989.sp017509, PMID: - DOI - PMC - PubMed
    1. Cohen S., Brault J. J., Gygi S. P., Glass D. J., Valenzuela D. M., Gartner C., et al. . (2009). During muscle atrophy, thick, but not thin, filament components are degraded by MuRF1-dependent ubiquitylation. J. Cell Biol. 185, 1083–1095. doi: 10.1083/jcb.200901052, PMID: - DOI - PMC - PubMed

LinkOut - more resources