

Spatial Changes in the Atrial Fibrillation Wave-Dynamics After Using Antiarrhythmic Drugs: A Computational Modeling Study
- PMID: 34630153
- PMCID: PMC8497701
- DOI: 10.3389/fphys.2021.733543
Spatial Changes in the Atrial Fibrillation Wave-Dynamics After Using Antiarrhythmic Drugs: A Computational Modeling Study
Erratum in
-
Corrigendum: Spatial changes in the atrial fibrillation wave-dynamics after using antiarrhythmic drugs: A computational modeling study.Front Physiol. 2022 Dec 15;13:992000. doi: 10.3389/fphys.2022.992000. eCollection 2022. Front Physiol. 2022. PMID: 36589458 Free PMC article.
Abstract
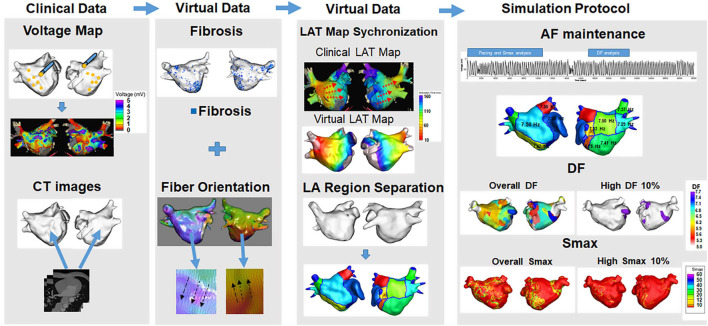
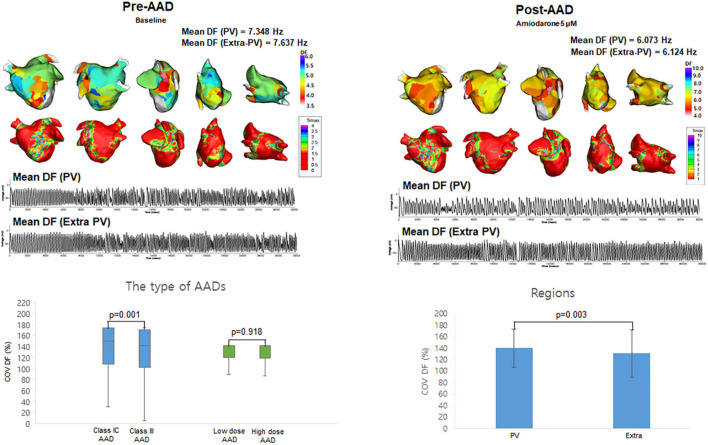
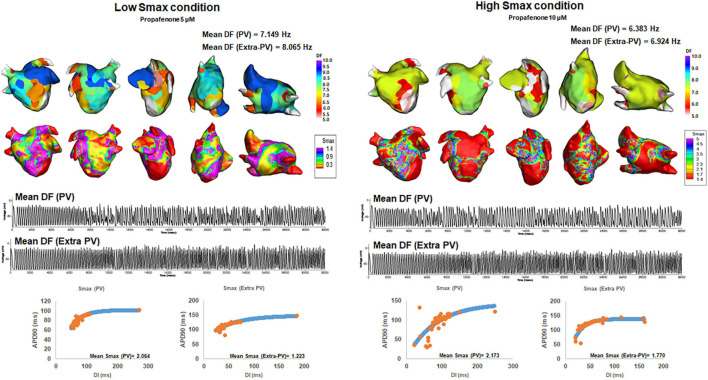
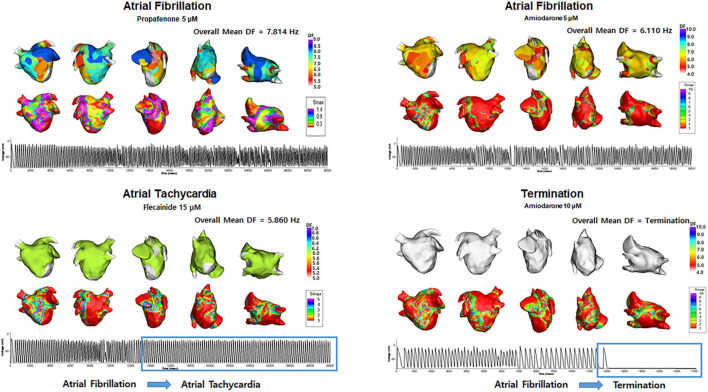
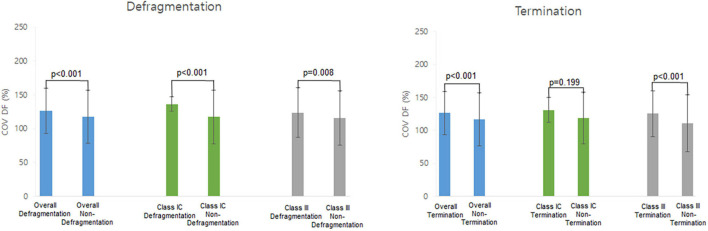
Background: We previously reported that a computational modeling-guided antiarrhythmic drug (AAD) test was feasible for evaluating multiple AADs in patients with atrial fibrillation (AF). We explored the anti-AF mechanisms of AADs and spatial change in the AF wave-dynamics by a realistic computational model. Methods: We used realistic computational modeling of 25 AF patients (68% male, 59.8 ± 9.8 years old, 32.0% paroxysmal AF) reflecting the anatomy, histology, and electrophysiology of the left atrium (LA) to characterize the effects of five AADs (amiodarone, sotalol, dronedarone, flecainide, and propafenone). We evaluated the spatial change in the AF wave-dynamics by measuring the mean dominant frequency (DF) and its coefficient of variation [dominant frequency-coefficient of variation (DF-COV)] in 10 segments of the LA. The mean DF and DF-COV were compared according to the pulmonary vein (PV) vs. extra-PV, maximal slope of the restitution curves (Smax), and defragmentation of AF. Results: The mean DF decreased after the administration of AADs in the dose dependent manner (p < 0.001). Under AADs, the DF was significantly lower (p < 0.001) and COV-DF higher (p = 0.003) in the PV than extra-PV region. The mean DF was significantly lower at a high Smax (≥1.4) than a lower Smax condition under AADs. During the episodes of AF defragmentation, the mean DF was lower (p < 0.001), but the COV-DF was higher (p < 0.001) than that in those without defragmentation. Conclusions: The DF reduction with AADs is predominant in the PVs and during a high Smax condition and causes AF termination or defragmentation during a lower DF and spatially unstable (higher DF-COV) condition.
Keywords: antiarrhythmic drug; atrial fibrillation; computational modeling; dominant frequency; spatial changes.
Copyright © 2021 Hwang, Park, Kwon, Lim, Lee, Jin, Yu, Kim, Joung and Pak.
Conflict of interest statement
The authors declare that the research was conducted in the absence of any commercial or financial relationships that could be construed as a potential conflict of interest.
Figures
References
-
- Bai J., Zhu Y., Lo A., Gao M., Lu Y., Zhao J., et al. (2021). In silico assessment of class I Antiarrhythmic drug effects on Pitx2-induced atrial fibrillation: insights from populations of electrophysiological models of human atrial cells and tissues. Int. J. Mol. Sci. 22:1265. 10.3390/ijms22031265 - DOI - PMC - PubMed
-
- Chen S. A., Hsieh M. H., Tai C. T., Tsai C. F., Prakash V. S., Yu W. C., et al. (1999). Initiation of atrial fibrillation by ectopic beats originating from the pulmonary veins: electrophysiological characteristics, pharmacological responses, and effects of radiofrequency ablation. Circulation 100 1879–1886. 10.1161/01.cir.100.18.1879 - DOI - PubMed
Grants and funding
LinkOut - more resources
Full Text Sources
Research Materials
Miscellaneous