

Transcriptomics Analysis Reveals Shared Pathways in Peripheral Blood Mononuclear Cells and Brain Tissues of Patients With Schizophrenia
- PMID: 34630179
- PMCID: PMC8492981
- DOI: 10.3389/fpsyt.2021.716722
Transcriptomics Analysis Reveals Shared Pathways in Peripheral Blood Mononuclear Cells and Brain Tissues of Patients With Schizophrenia
Abstract
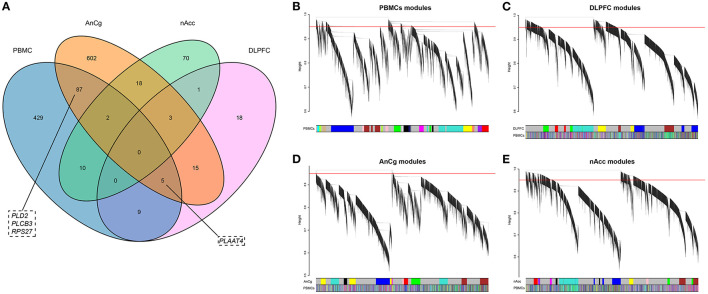
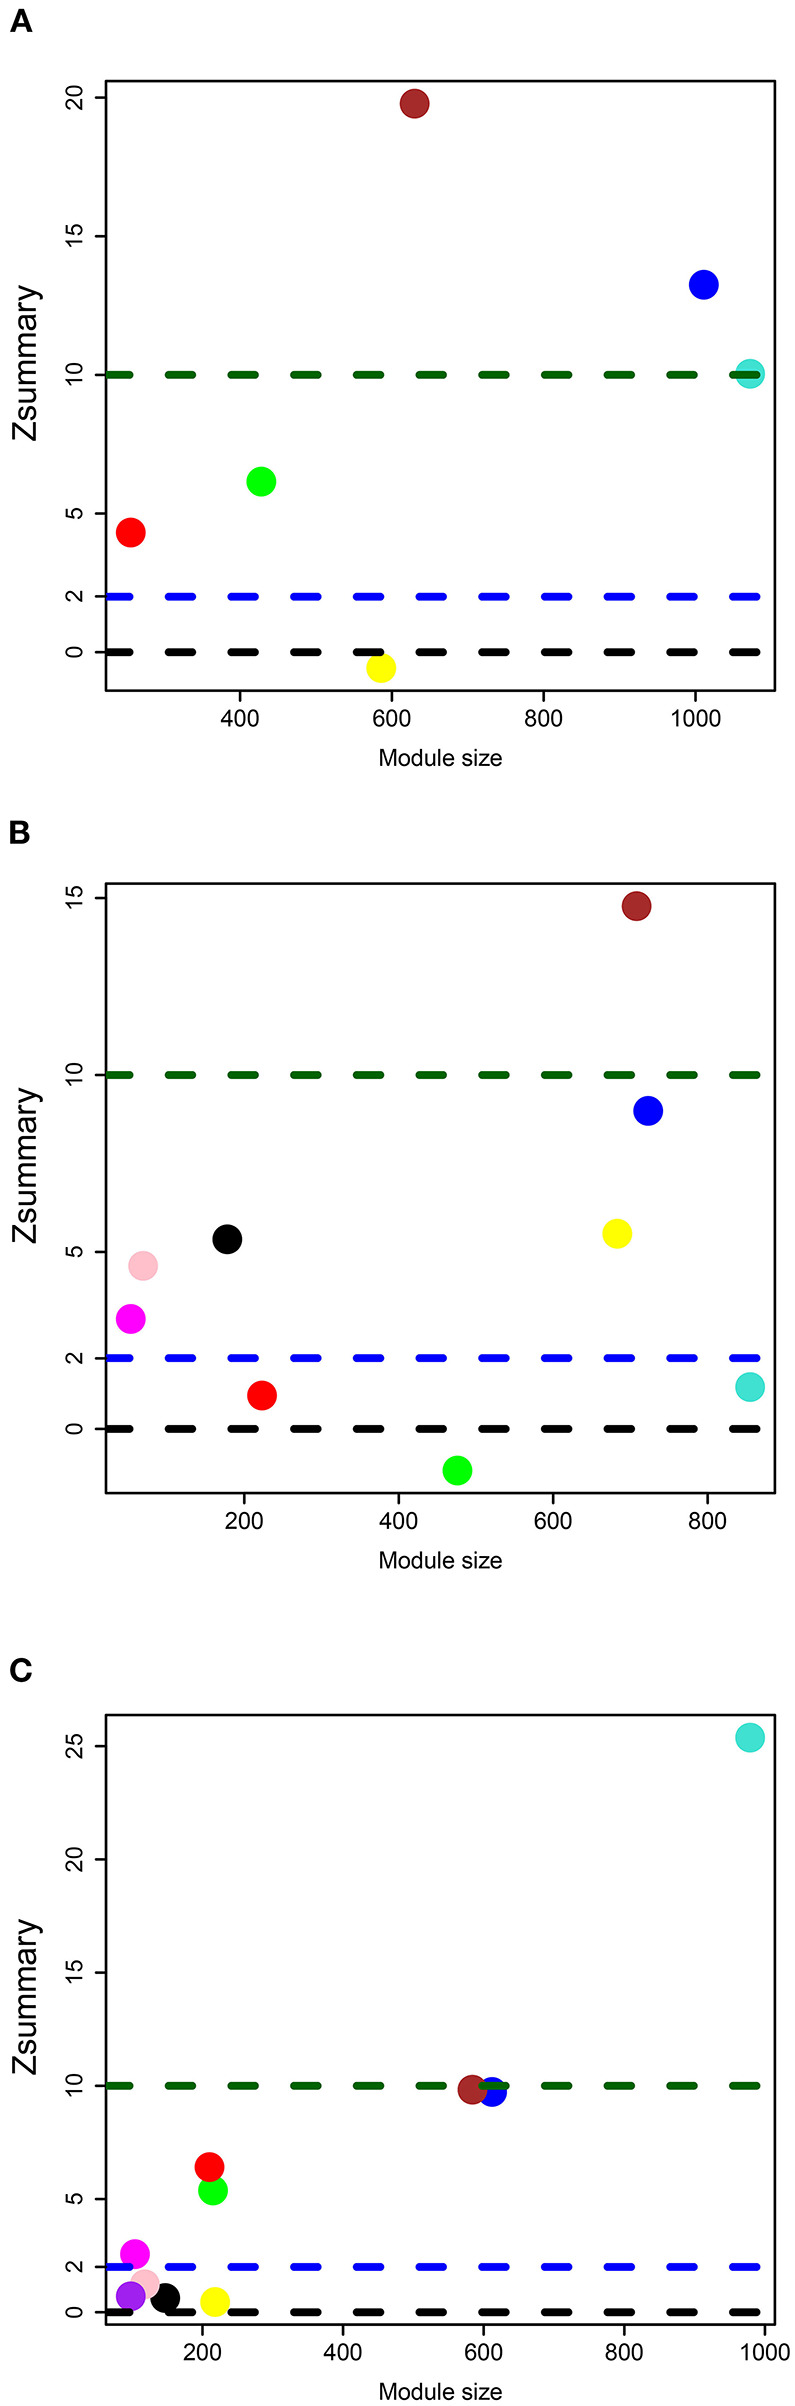
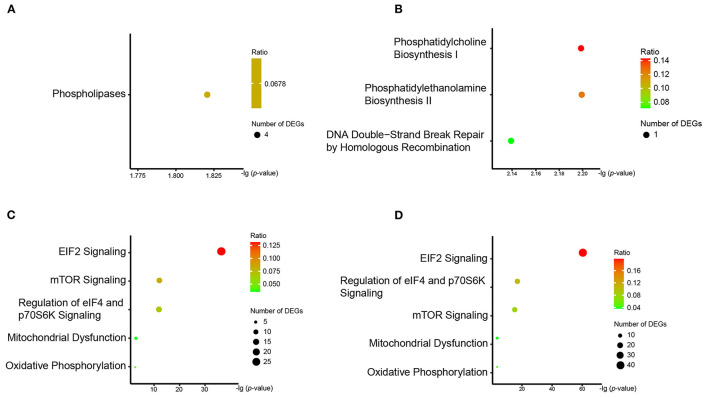
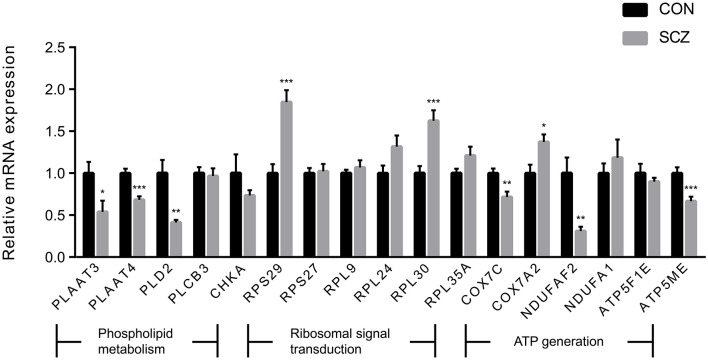
Background: Schizophrenia is a serious mental disorder with complicated biological mechanisms. Few studies explore the transcriptional features that are shared in brain tissue and peripheral blood. In the present study, we aimed to explore the biological pathways with similar expression patterns in both peripheral blood mononuclear cells (PBMCs) and brain tissues. Methods: The present study used transcriptomics technology to detect mRNA expression of PBMCs of 10 drug-naïve patients with schizophrenia and 20 healthy controls. Transcriptome data sets of brain tissue of patients with schizophrenia downloaded from public databases were also analyzed in our study. The biological pathways with similar expression patterns in the PBMCs and brain tissues were uncovered by differential expression analysis, weighted gene co-expression network analysis (WGCNA), and pathway analysis. Finally, the expression levels of differential expressed genes (DEGs) were validated by real-time fluorescence quantitative polymerase chain reaction (qPCR) in another 12 drug-naïve patients with schizophrenia and 12 healthy controls. Results: We identified 542 DEGs, 51 DEGs, 732 DEGs, and 104 DEGs in PBMCs, dorsolateral prefrontal cortex, anterior cingulate gyrus, and nucleus accumbent, respectively. Five DEG clusters were recognized as having similar gene expression patterns in PBMCs and brain tissues by WGCNA. The pathway analysis illustrates that these DEG clusters are mainly enriched in several biological pathways that are related to phospholipid metabolism, ribosome signal transduction, and mitochondrial oxidative phosphorylation. The differential significance of PLAAT3, PLAAT4, PLD2, RPS29, RPL30, COX7C, COX7A2, NDUFAF2, and ATP5ME were confirmed by qPCR. Conclusions: This study finds that the pathways associated with phospholipid metabolism, ribosome signal transduction, and energy metabolism have similar expression patterns in PBMCs and brain tissues of patients with schizophrenia. Our results supply a novel insight for revealing the pathogenesis of schizophrenia and might offer a new approach to explore potential biological markers of peripheral blood in schizophrenia.
Keywords: mitochondrial dysfunction; peripheral blood mononuclear cells; phospholipid metabolism; ribosome signal transduction; schizophrenia; transcriptomics.
Copyright © 2021 Song, Liu, Pu, Gui, Zhong, Chen, Chen, Chen, Chen, Wang, Cheng, Zhao and Xie.
Conflict of interest statement
The authors declare that the research was conducted in the absence of any commercial or financial relationships that could be construed as a potential conflict of interest.
Figures

References
-
- Global regional and national incidence prevalence and years lived with disability for 354 diseases and injuries for 195 countries and territories 1990–2017: a systematic analysis for the Global Burden of Disease Study 2017 . Lancet. (2018) 392:1789–858. 10.1016/S0140-6736(18)32279-7 - DOI - PMC - PubMed
LinkOut - more resources
Full Text Sources
Miscellaneous