Review
. 2021 Sep 28;13(9):258-282.
doi: 10.4329/wjr.v13.i9.258.

Comprehensive literature review on the radiographic findings, imaging modalities, and the role of radiology in the COVID-19 pandemic

Affiliations
Review

Comprehensive literature review on the radiographic findings, imaging modalities, and the role of radiology in the COVID-19 pandemic

Aman Pal et al. World J Radiol. .

Abstract

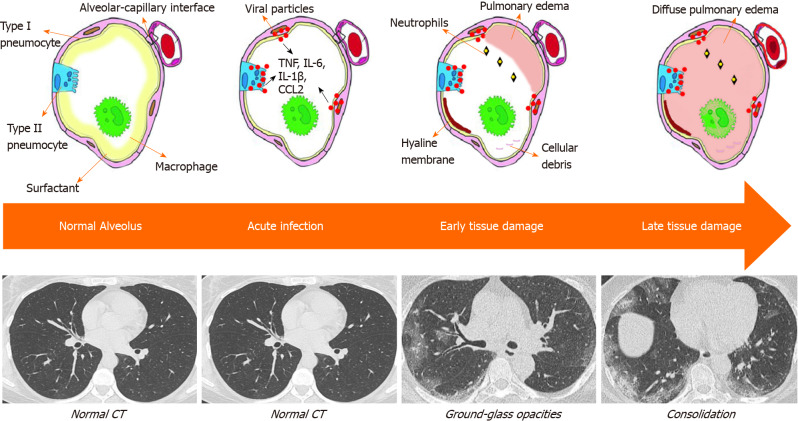
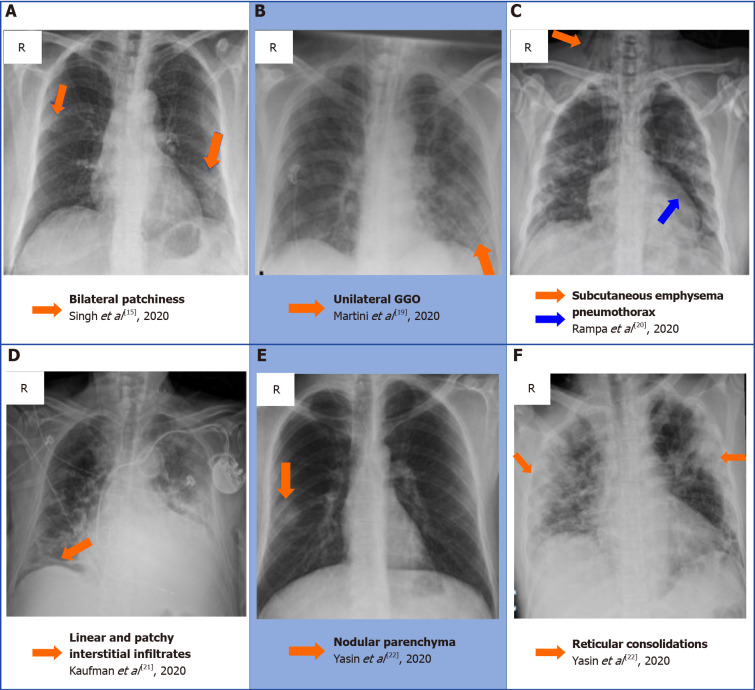
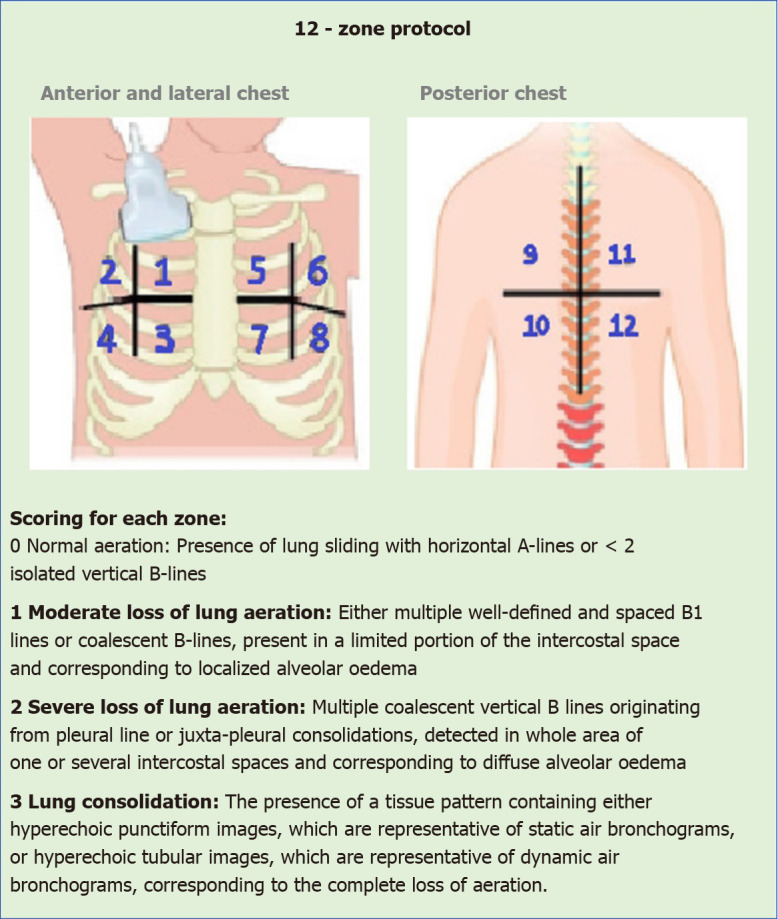
Since the outbreak of the coronavirus disease 2019 (COVID-19) pandemic, over 103214008 cases have been reported, with more than 2231158 deaths as of January 31, 2021. Although the gold standard for diagnosis of this disease remains the reverse-transcription polymerase chain reaction of nasopharyngeal and oropharyngeal swabs, its false-negative rates have ignited the use of medical imaging as an important adjunct or alternative. Medical imaging assists in identifying the pathogenesis, the degree of pulmonary damage, and the characteristic features in each imaging modality. This literature review collates the characteristic radiographic findings of COVID-19 in various imaging modalities while keeping the preliminary focus on chest radiography, computed tomography (CT), and ultrasound scans. Given the higher sensitivity and greater proficiency in detecting characteristic findings during the early stages, CT scans are more reliable in diagnosis and serve as a practical method in following up the disease time course. As research rapidly expands, we have emphasized the CO-RADS classification system as a tool to aid in communicating the likelihood of COVID-19 suspicion among healthcare workers. Additionally, the utilization of other scoring systems such as MuLBSTA, Radiological Assessment of Lung Edema, and Brixia in this pandemic are reviewed as they integrate the radiographic findings into an objective scoring system to risk stratify the patients and predict the severity of disease. Furthermore, current progress in the utilization of artificial intelligence via radiomics is evaluated. Lastly, the lesson from the first wave and preparation for the second wave from the point of view of radiology are summarized.

Keywords: Brixia score; COVID-19; Computed tomography; Coronavirus; MuLBSTA Scoring system; Radiological Assessment of Lung Edema classification; Ultrasound.


Conflict of interest statement

Conflict-of-interest statement: Authors declare no conflict of interest for this article.

Figures

Figure 1
Figure 1
Model of infected lung through pathological and radiological perspectives.
Figure 2
Figure 2
A collection of chest radiographs that displays some of the common and rare findings of coronavirus disease 2019 pneumonia[15,19-22]. A: Bilateral patchiness; B: Unilateral ground glass opacification; C: Subcutaneous emphysema secondary to a pneumothorax; D: Linear and patchy interstitial infiltrate in the right basal zone; E: Nodular appearance of the right lobe parenchyma; F: reticular appearance of the consolidation bilaterally. A: Citation: Singh B, Kaur P, Reid RJ, Shamoon F, Bikkina M. COVID-19 and Influenza Co-Infection: Report of Three Cases. Cureus 2020; 12: e9852. Copyright ©The Author(s) 2020. Published by Cureus; B: Citation: Martini K, Blüthgen C, Walter JE, Messerli M, Nguyen-Kim TD, Frauenfelder T. Accuracy of Conventional and Machine Learning Enhanced Chest Radiography for the Assessment of COVID-19 Pneumonia: Intra-Individual Comparison with CT. Journal of Clinical Medicine 2020;.9: 3576 Copyright ©The Author(s) 2020. Published by MDPI, Basel, Switzerland; C: Citation: Rampa L, Miceli A, Casilli F, Biraghi T, Barbara B, Donatelli F. Lung complication in COVID-19 convalescence: A spontaneous pneumothorax and pneumatocele case report. Journal of Respiratory Diseases and Medicine 2020; 2. Copyright ©The Author(s) 2020. Published by Open-access article; D: Citation: Kaufman A, Naidu S, Ramachandran S, Kaufman D, Fayad Z, Mani V. Review of radiographic findings in COVID-19. World Journal of Radiology 2020; 12: 142-55. Copyright ©The Author(s) 2020. Published by Baishideng Publishing Group Inc; E and F: Citation: Yasin R, Gouda W. Chest X-ray findings monitoring COVID-19 disease course and severity. The Egyptian Journal of Radiology and Nuclear Medicine 2020; 51: 193. Copyright ©The Author(s) 2020. Published by BMJ.
Figure 3
Figure 3
Summary of the frequency distribution of classical and ancillary computed tomography imaging findings in coronavirus disease 2019 pneumonia. The whiskers indicate the 95% confidence interval. GGO: Ground-glass opacity.
Figure 4
Figure 4
A collection of chest computed tomography that displays some of the classical findings of coronavirus disease 2019 pneumonia[26-28]. A: Ground-glass opacity (GGO); B: Consolidation and air bronchogram; C: Crazy paving; D: GGO superimposed with consolidation; E: Bronchiectasis, reticular thickening, with vascular enlargement; F: Pleural adhesion. A, B, E and F: Citation: Fu Z, Tang N, Chen Y, Ma L, Wei Y, Lu Y, Ye K, Liu H, Tang F, Huang G, Yang Y, Xu F. CT features of COVID-19 patients with two consecutive negative RT-PCR tests after treatment. Science Report 2020; 10: 11548. Copyright ©The Author(s) 2020. Published by Springer Nature; C: Citation: Gillespie M, Flannery P, Schumann JA, Dincher N, Mills R, Can A. Crazy-Paving: A Computed Tomographic Finding of Coronavirus Disease 2019. Clinical Practice and Cases in Emergency Medicine 2020; 4: 461-463. Copyright ©The Author(s) 2020. Published by UC Irvine; D: Citation: Ali TF, Tawab MA, ElHariri MA. CT chest of COVID-19 patients: what should a radiologist know? Egyptian Journal of Radiology and Nuclear Medicine 2020; 51: 120. Copyright ©The Author(s) 2020. Published by Springer Nature.
Figure 5
Figure 5
Summary of the frequency distribution of lesions in the lung lobes on computed tomography imaging of coronavirus disease 2019 patients. CI: Confidence interval; LLL: Left lower lobe; LUL: Left upper lobe (LUL); RLL: Right lower lobe; RML: Right middle lobe; RUL: Right upper lobe.
Figure 6
Figure 6
Summary of the frequency distribution of classical and ancillary computed tomography imaging findings in coronavirus disease 2019 pneumonia. The whiskers indicate the 95% confidence interval. The data are adapted from the meta-analysis conducted by Ojha et al[31].
Figure 7
Figure 7
A collection of chest computed tomography that displays some of the atypical findings of coronavirus disease 2019 pneumonia[32-36]. A: Comb sign in the right lobe characterized by vascular enlargement; B: Curvilinear opacities in the subpleural area; C: Reticular pattern bilaterally; D: Multiple nodules and cavitation; E: Bilateral hilar lymphadenopathy; F: Atoll sign also known as reverse halo. A: Citation: Kwee TC, Kwee RM. Chest CT in COVID-19: What the radiologist needs to know. Radiographics 2020; 40: 1848-1865. Copyright ©The Author(s) 2021. Published by Radiographics; B and F: Citation: Kong W, Agarwal PP. Chest imaging appearance of COVID-19 infection. Radiology: Cardiothoracic Imaging 2020; 2: e200028. Copyright ©The Author(s) 2020. Published by the Radiological Society of North America, Inc; C: Citation: Meirelles GSP. COVID-19: A brief update for radiologists. Radiologia Brasileira 2020; 53: 320-328. Copyright ©The Author(s) 2020. Published by Radiology brasil; D: Citation: Zhang Q, Douglas A, Abideen ZU, Khanal S, Tzarnas S. Novel coronavirus (2019-nCoV) in disguise. Cureus 2020; 12: e7521. Copyright ©The Author(s) 2020. Published by Cureus; E: Citation: Mughal MS, Rehman R, Osman R, Kan N, Mirza H, Eng MH. Hilar lymphadenopathy, a novel finding in the setting of coronavirus disease (COVID-19): A case report. Journal of Medical Case Reports 2020; 14: 124. Copyright ©The Author(s) 2020. Published by BMC.
Figure 8
Figure 8
Summarizes the frequencies of chest classical and ancillary computed tomography findings at different stages of disease progression (early [n = 155], intermediate [n = 155], and late [n = 155]). Data acquired from Gu et al[41].
Figure 9
Figure 9
Shows a simplified flowchart guiding the triage in patients presenting with respiratory symptoms during the coronavirus disease 2019 pandemic using lung ultrasonography in the emergency department. 1Unilateral appearance of more than 1 of any 4 criteria means coronavirus disease 2019 suspected. COVID-19: Coronavirus disease 2019; LUS: Lung ultrasonography.
Figure 10
Figure 10
Schematic diagram describing the 12-zone assessed using the lung ultrasonography 12-zone scoring method. The criteria for each score value (0-3) is described and tabulated.
Figure 11
Figure 11
Lung ultrasonography presentation of B-lines (green panel), subpleural consolidations (white panel), and lung ultrasound scores (orange panel) at different lung zones (anterior, lateral, posterior) in patients with a primary diagnosis of coronavirus disease 2019 (n = 11) and without coronavirus disease 2019 (other, n = 38). Boxplots around median and interquartile range (IQR), with outliers within 1.5 IQR of the nearest quartile. Other (extrapulmonary infection/inflammation (n = 10), pneumonia of other etiology (n = 8), exacerbated asthma/ chronic obstructive pulmonary disease (n = 7), pulmonary neoplasia (n = 4), pulmonary embolism (n = 2), congestive heart failure (n = 2), and not documented (n = 5)). Statistically significant outcomes with P < 0.05. Data utilized from Speidel et al[67]. COVID-19: Coronavirus disease 2019; LUSS: Lung ultrasound score.
Figure 12
Figure 12
Basic workflow of the artificial intelligence system. AI: Artificial intelligence; COVID-19: Coronavirus disease 2019.

References

    1. World Health Organization. Laboratory testing for 2019 novel coronavirus (2019-nCoV) in suspected human cases 19 March 2020. [cited 22 January 2021]. Available from: https://www.who.int/publications/i/item/10665-331501 .
    1. Böger B, Fachi MM, Vilhena RO, Cobre AF, Tonin FS, Pontarolo R. Systematic review with meta-analysis of the accuracy of diagnostic tests for COVID-19. Am J Infect Control. 2021;49:21–29. - PMC - PubMed
    1. Liotti FM, Menchinelli G, Marchetti S, Posteraro B, Landi F, Sanguinetti M, Cattani P. Assessment of SARS-CoV-2 RNA Test Results Among Patients Who Recovered From COVID-19 With Prior Negative Results. JAMA Intern Med. 2021;181:702–704. - PMC - PubMed
    1. Mossa-Basha M, Meltzer CC, Kim DC, Tuite MJ, Kolli KP, Tan BS. Radiology Department Preparedness for COVID-19: Radiology Scientific Expert Review Panel. Radiology. 2020;296:E106–E112. - PMC - PubMed
    1. Younes N, Al-Sadeq DW, Al-Jighefee H, Younes S, Al-Jamal O, Daas HI, Yassine HM, Nasrallah GK. Challenges in Laboratory Diagnosis of the Novel Coronavirus SARS-CoV-2. Viruses. 2020;12:582. - PMC - PubMed