. 2021 Sep 29;8(9):210594.
doi: 10.1098/rsos.210594. eCollection 2021 Sep.

Mathematical model of STAT signalling pathways in cancer development and optimal control approaches

Affiliations

Mathematical model of STAT signalling pathways in cancer development and optimal control approaches

Jonggul Lee et al. R Soc Open Sci. .

Abstract

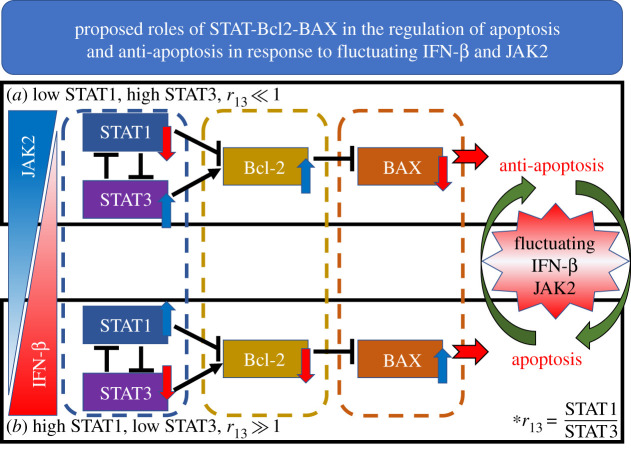
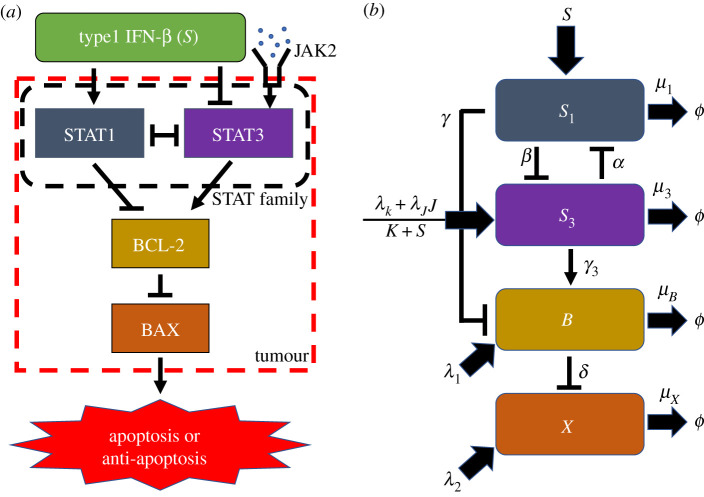
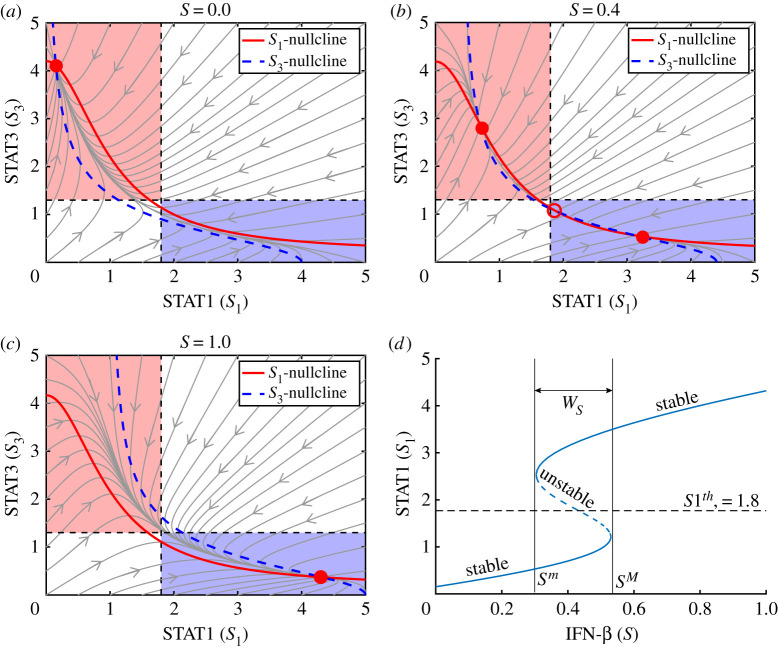
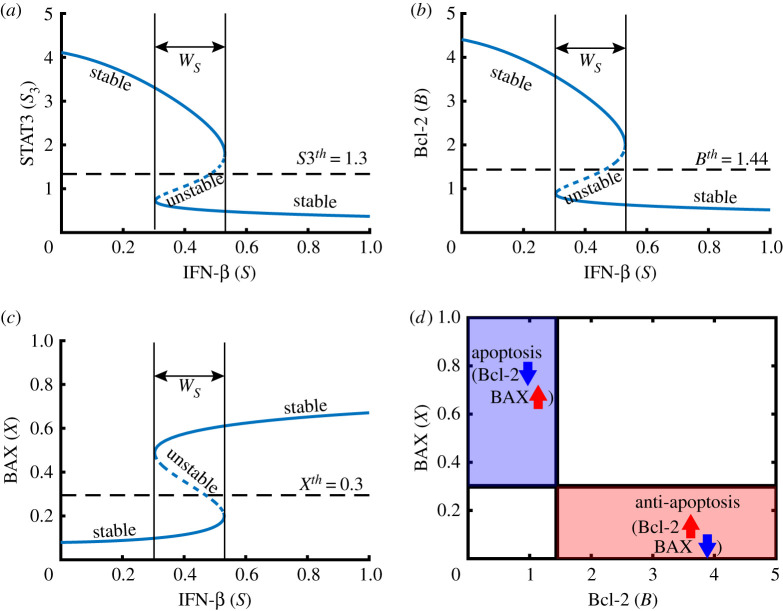
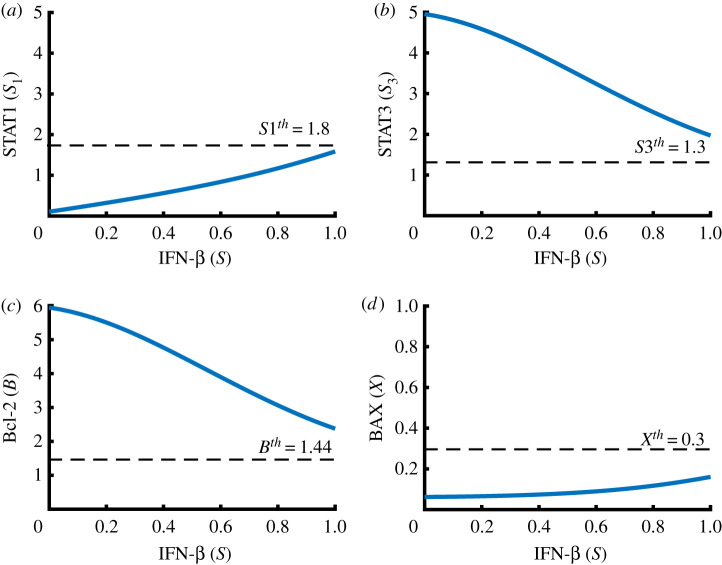
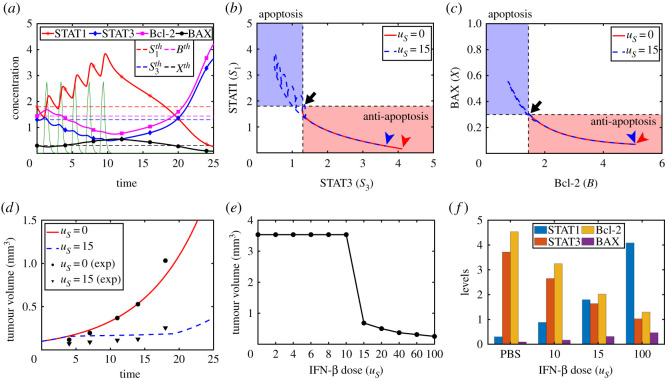
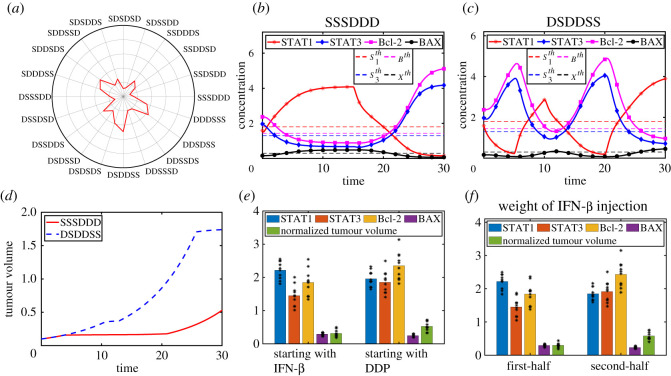
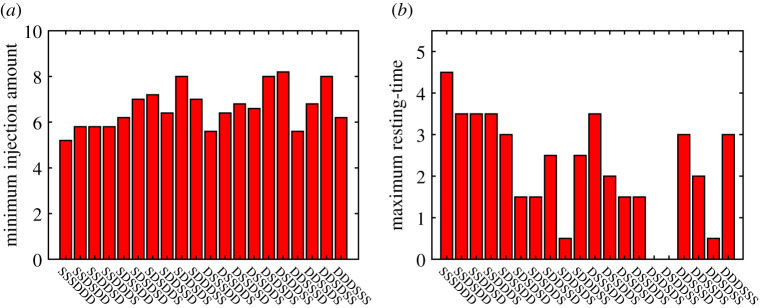
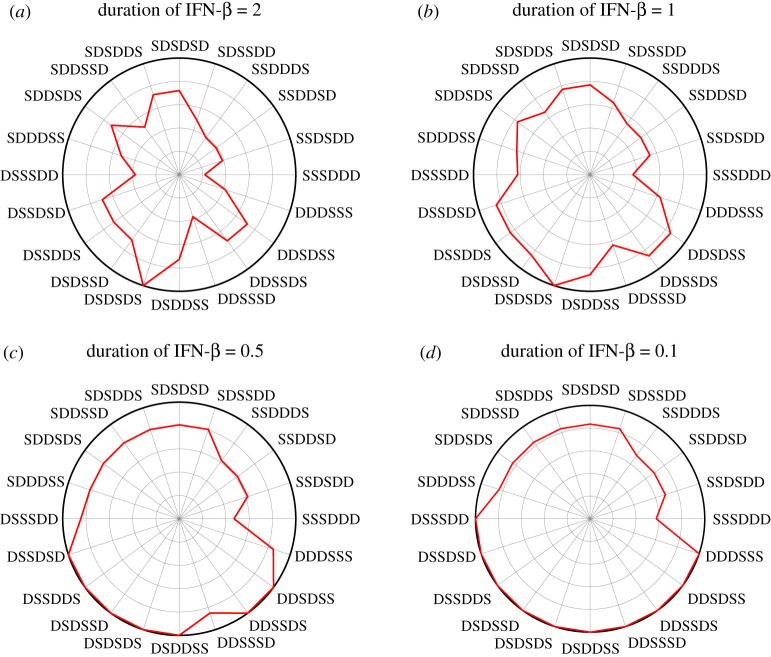
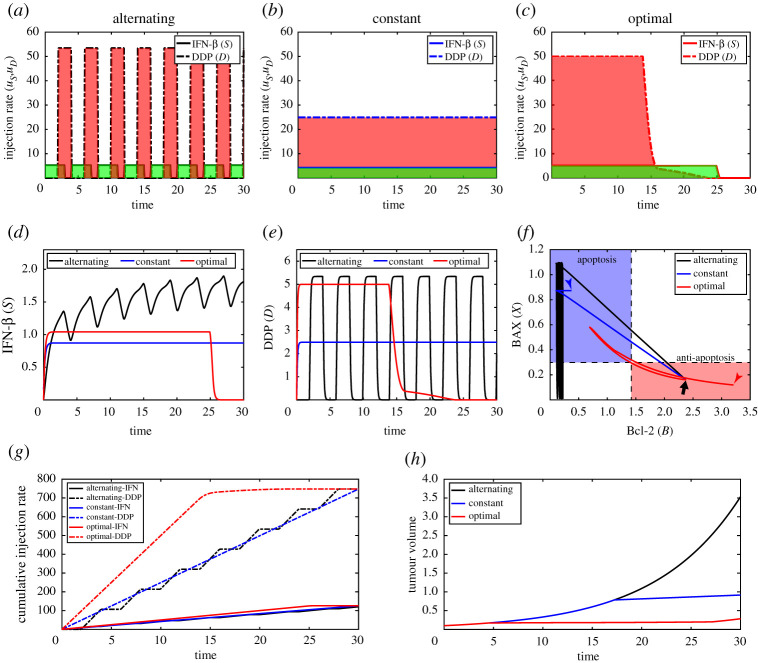
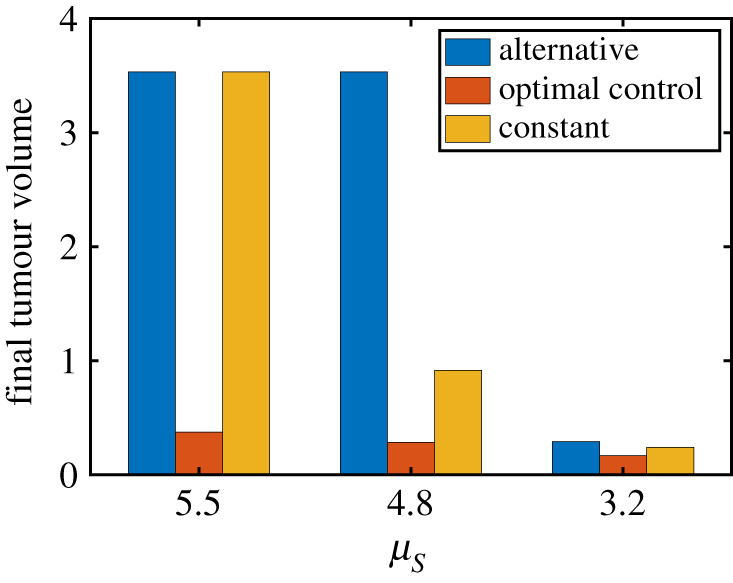
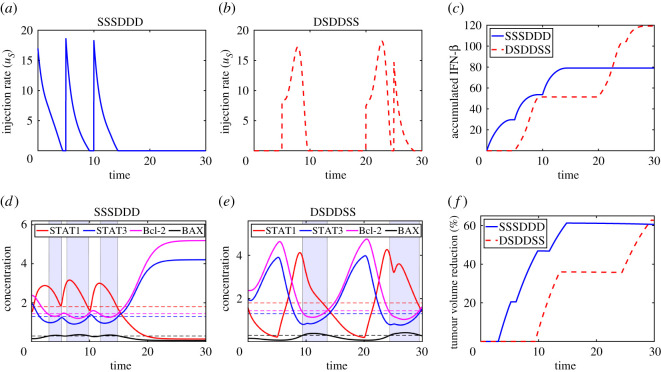
In various diseases, the STAT family display various cellular controls over various challenges faced by the immune system and cell death programs. In this study, we investigate how an intracellular signalling network (STAT1, STAT3, Bcl-2 and BAX) regulates important cellular states, either anti-apoptosis or apoptosis of cancer cells. We adapt a mathematical framework to illustrate how the signalling network can generate a bi-stability condition so that it will induce either apoptosis or anti-apoptosis status of tumour cells. Then, we use this model to develop several anti-tumour strategies including IFN-β infusion. The roles of JAK-STATs signalling in regulation of the cell death program in cancer cells and tumour growth are poorly understood. The mathematical model unveils the structure and functions of the intracellular signalling and cellular outcomes of the anti-tumour drugs in the presence of IFN-β and JAK stimuli. We identify the best injection order of IFN-β and DDP among many possible combinations, which may suggest better infusion strategies of multiple anti-cancer agents at clinics. We finally use an optimal control theory in order to maximize anti-tumour efficacy and minimize administrative costs. In particular, we minimize tumour volume and maximize the apoptotic potential by minimizing the Bcl-2 concentration and maximizing the BAX level while minimizing total injection amount of both IFN-β and JAK2 inhibitors (DDP).

Keywords: STAT1; apoptosis; cancer; mathematical model; optimal control.


Figures

Figure 1.
Figure 1.
A schematic diagram for a proposed network of apoptosis signalling in the presence of IFN-β/JAK2. (a) Low IFN-β and high JAK2 levels increase STAT3 and Bcl-2 and suppress STAT1 and BAX, maintaining anti-apoptosis status. (b) High IFN-β and decreased JAK2 initiate phenotypical transition from anti-apoptosis to apoptosis of cancer through reversed regulation of each module.
Figure 2.
Figure 2.
A schematic diagram of the apoptosis signalling network in figure 1. (a) Key signalling network of apoptosis involving STAT1, STAT3, Bcl-2 and BAX in response to IFN-β and JAK2. (b) The corresponding mathematical model: levels of STAT1 and STAT3, and activity of their target Bcl2, and BAX were represented by ‘S1’, ‘S3’, ‘B’ and ‘X’, respectively.
Figure 3.
Figure 3.
Dynamics of intracellular (STAT1-STAT3-Bcl2-BAX) module in the absence of JAK2. (ac) Solution flow of the system (2.9)–(2.12) in the S1S3 set when S = 0 (a), 0.4 (b) and 1.0 (c). Filledcircle=stableequilibrium, emptycircle=unstableequilibrium. Blue region = upregulation of STAT1 + downregulation of STAT3, pink region = downregulation of STAT1 + upregulation of STAT3. (d) Bifurcation curve of STAT1. Yaxis = equilibrium. WS = [Sm, SM] = a window of bi−stabilty.
Figure 4.
Figure 4.
Bifurcation diagram and characterization of apoptosis when J = 0. (ac) Bifurcation curves for steady states of STAT3 (S3 in (a)), Bcl-2 (B in (b)) and BAX (X in (c)): IFN-β signals (S) provide an on-off switch of STAT3, Bcl-2 and BAX, induing binary modes: malignant and benign progression. WS = [Sm, SM] = a window of bi−stabilty. (d) Schematic of anti-apoptosis (Pt) and apoptosis (Pa) regions in the BX plane. Parameters: J = 0. Other parameters are given in table 1.
Figure 5.
Figure 5.
Intracellular response to IFN-β when J > 0. When J > 0, IFN-β induces uniform responses in intracellular states: downregulation of STAT1/BAX (i.e. S1<S1th, X<Xth,S(0S1)) and upregulation of STAT3/Bcl-2 (i.e. S3>S3th, B>Bth,S(0S1)). Y -axis = steady state (SS) of given variable. Parameters: J = 1. Other parameters are given in table 1.
Figure 6.
Figure 6.
Intracellular apoptosis dynamics (STAT1, STAT3, Bcl-2, BAX) in response to IFN-β and therapeutic effect. (a) Time evolution of STAT1 (S1), STAT3 (S3), Bcl-2 (B) and BAX (X) after IFN-β treatment (green) at t = 1, 3, 5, 7, 9 with uS = 15. (b,c) Solution trajectories of the intracellular variables (STAT1-STAT3 in (b) and Bcl-2-BAX in (c)) in the S1S3 and BX plane, respectively, with two IFN-β doses: uS = 0 (red solid), uS = 15 (blue dotted; corresponding to (a)). Arrow = initial condition, red arrow head = position of solutions with uS = 0 at final time. blue arrow head = position of solutions with uS = 15 at final time. (d) Comparison with experimental data: growth patterns of a tumour in control (simulation; solid red curves), and IFN-β-treatment (dashed curves) from our model, control case from experimental (PBS; filled circles), and IFN-β injection case from experimental (filled triangles). (e) Dose response curve when uS = 0, 2, 4, 6, 8, 10, 15, 20, 40, 60, 100. (f) Average field of STAT1 (blue), STAT3 (red), Bcl-2 (yellow) and BAX (purple) when uS = 0 (PBS), 10, 15, 100.
Figure 7.
Figure 7.
Effect of the injection order of IFN-β and DDP on tumour growth. (a) Normalized tumour volume for 20 different schedules. (b,c) Time courses of the STAT1 (S1), STAT3 (S3), Bcl-2 (B) and BAX (X) in response to the ‘SSSDDD’ (b) and ‘DSDDSS’ (c) cases. (d) Dynamics of the tumour size in the ‘SSSDDD’ (solid red) and ‘DSDDSS’ (dashed blue) cases. (e) Average levels of STAT1, STAT3, Bcl-2 and BAX, and tumour volume of all cases in (a) in two categories: schedules with initial injection of IFN-β (left panel), schedules with initial injection of DDP (right panel). (f) Average levels of STAT1, STAT3, Bcl-2 and BAX, and tumour volume of all cases in (a) in two categories: schedules with weighted injection of IFN-β in the first half (left panel), schedules with weighted injection of IFN-β in the second half (right panel).
Figure 8.
Figure 8.
(a) The minimum injection dose of IFN-β in the permutation sequences of the two drugs in figure 7, for reduction in the tumour size by 50% compared to the case without IFN-β (control) while hs is fixed. (b) Maximum resting-time of IFN-β in the permutation sequences of the two drugs, for the same degree of tumour size reduction (50%) compared to the control.
Figure 9.
Figure 9.
Effect of duration of IFN-β injection on tumour size. The normalized tumour volume with various duration of IFN-β injection: (a) hS = 2, (b) hS = 1, (c) hS = 0.5 and (d) hS = 0.1.
Figure 10.
Figure 10.
Inhibition of tumour growth by optimal control (Strategy I). (a) Profiles of IFN-β (green, black solid curve) and DDP (pink, black dashed curve) for alternating scheme. (b) Profiles of IFN-β (green, blue solid curve) and DDP (pink, blue dashed curve) for constant scheme. (c) Optimal control profiles of IFN-β (green, solid) and DDP (pink, dashed). (d,e) Time courses of IFN-β (d) and DDP (e) corresponding to three cases in (ac). (f) Flow of solutions (Bcl-2, BAX) in the phase plane. (g,h) Time evolution of the cumulative injection rates (g) and corresponding tumour size (h) in three cases in (ac).
Figure 11.
Figure 11.
Effect of the half-life of IFN-β on different anti-cancer strategies. Final tumour size in alternative, constant and optimal control strategies with various decay rates of IFN-β (μS = 5.5, 4.8*, 3.2). See other parameters in table 1.
Figure 12.
Figure 12.
Dynamics of the system corresponding to two alternating schemes of IFN-β and DDP with optimal control. (a,b) Temporal changes in IFN-β infusion in the ‘SSSDDD’ and the ‘DSDDSS’ scheme, respectively. (c) Time courses of the accumulated IFN-β in two cases. (d,e) Time courses of the intracellular molecules (STAT1 (S1), STAT3 (S3), Bcl-2 (B) and BAX (X)) in the ‘SSSDDD’ and ‘DSDDSS’ scheme, respectively. The apoptotic state of cancer cells is marked in blue boxes. (f) Reduced tumour sizes of two schemes relative to the base case.

Similar articles

Cited by

References

    1. Bray F, Ferlay J, Soerjomataram I, Siegel RL, Torre LA, Jemal A. 2018Global cancer statistics 2018: GLOBOCAN estimates of incidence and mortality worldwide for 36 cancers in 185 countries. CA Cancer J. Clin. 68, 394-424. (10.3322/caac.21492) - DOI - PubMed
    1. Herbst RS. 2018The biology and management of non-small cell lung cancer. Nature 553, 446-454. (10.1038/nature25183) - DOI - PubMed
    1. Aguda BD, Kim Y, Hunter MG, Friedman A, Marsh CB. 2008MicroRNA regulation of a cancer network: consequences of the feedback loops involving miR-17-92, E2F, and Myc. Proc. Natl Acad. Sci. USA 105, 19 678-19 683. (10.1073/pnas.0811166106) - DOI - PMC - PubMed
    1. Aguda BD, Kim Y, Kim HS, Friedman A, Fine H. 2011Qualitative network modeling of the MYC-p53 control system of cell proliferation and differentiation. Biophys. J. 101, 2082-2091. (10.1016/j.bpj.2011.09.052) - DOI - PMC - PubMed
    1. Kim Y, Lee D, Lawler S. 2020Collective invasion of glioma cells through OCT1 signalling and interaction with reactive astrocytes after surgery. Phil. Trans. R. Soc. B 375, 20190390. (10.1098/rstb.2019.0390) - DOI - PMC - PubMed