

A randomized controlled trial of an innovative, user-friendly, interactive smartphone app-based lifestyle intervention for weight loss
- PMID: 34631134
- PMCID: PMC8488442
- DOI: 10.1002/osp4.503
A randomized controlled trial of an innovative, user-friendly, interactive smartphone app-based lifestyle intervention for weight loss
Abstract
Objectives: Most electronically delivered lifestyle interventions are labor intensive, requiring logging onto websites and manually recording activity and diet. Cumbersome technology and lack of a human coach may have contributed to the limitations of prior interventions. In response, the current program of research created a comprehensive electronically delivered lifestyle intervention using a user-friendly, interactive, smartphone app-based model, and evaluated it in a randomized controlled trial.
Methods: Twenty-eight adults, body mass index 25-42 kg/m2, with smartphones and sedentary jobs, were randomized to the intervention, along with conventional outpatient weight-management visits every 3 months, or to a wait-listed control group that received only weight-management visits. The intervention included wearable activity trackers, smartscales, food photography logs, physician-driven app-based behavioral coaching, and peer support via the app. The prespecified primary outcome was a comparison of change in weight in kilograms, in the intervention versus control group at 6 months.
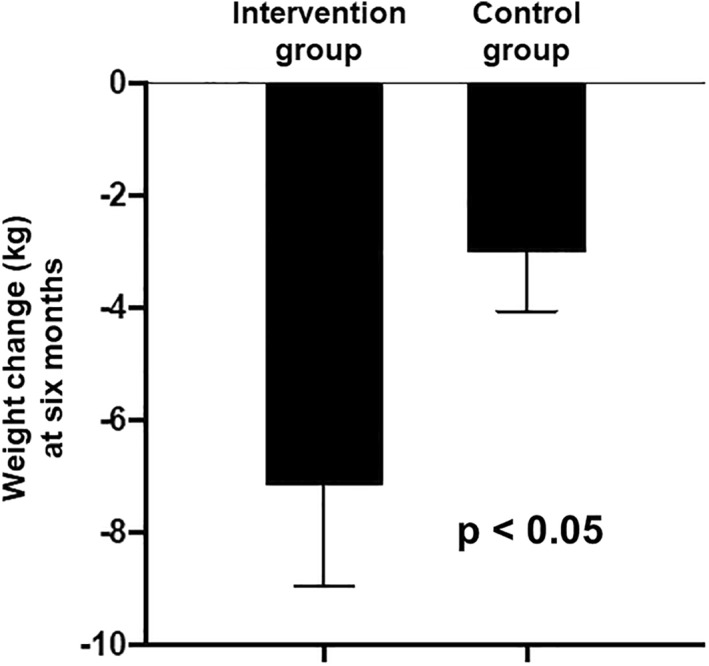
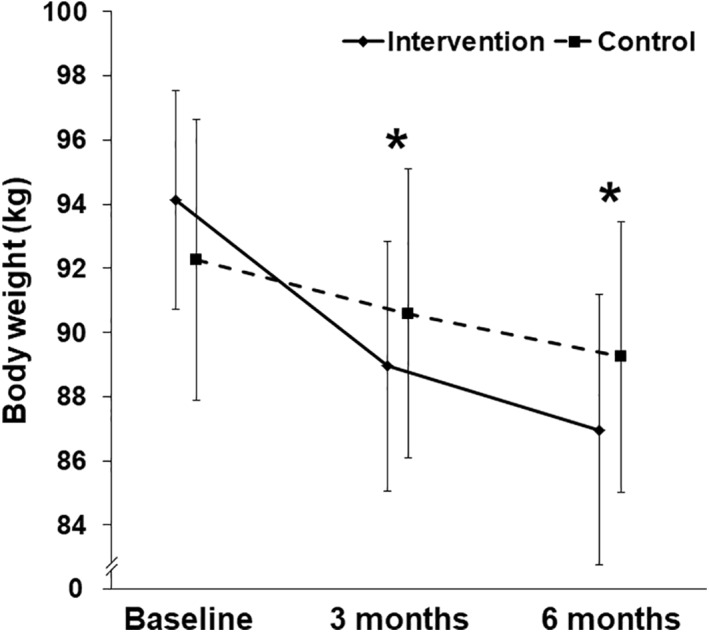
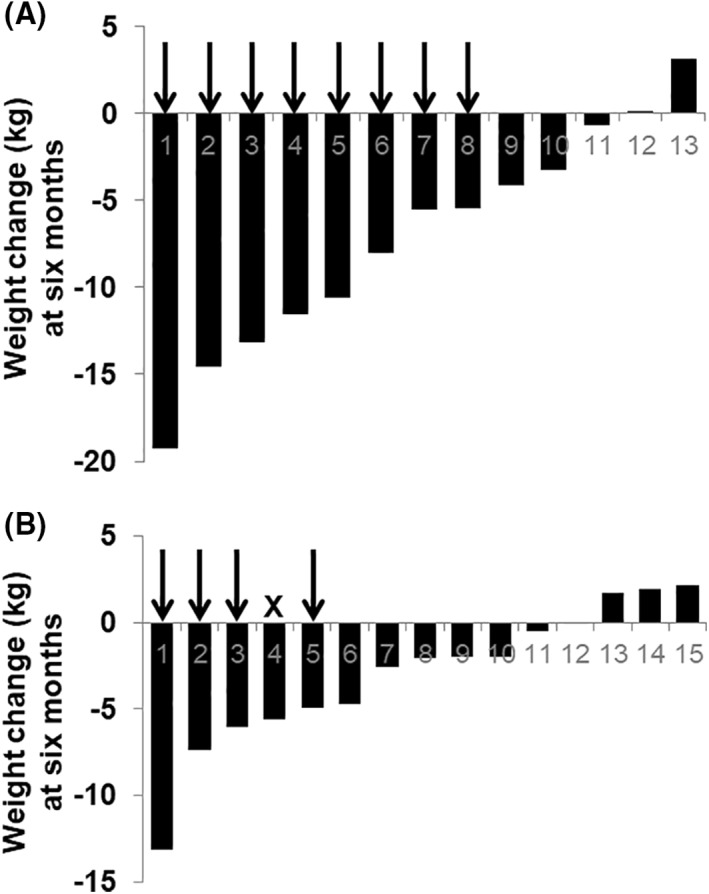
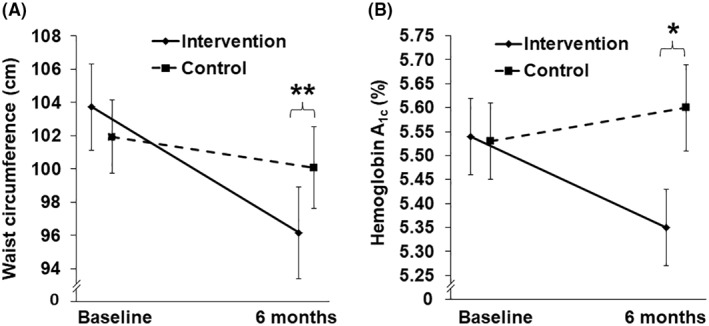
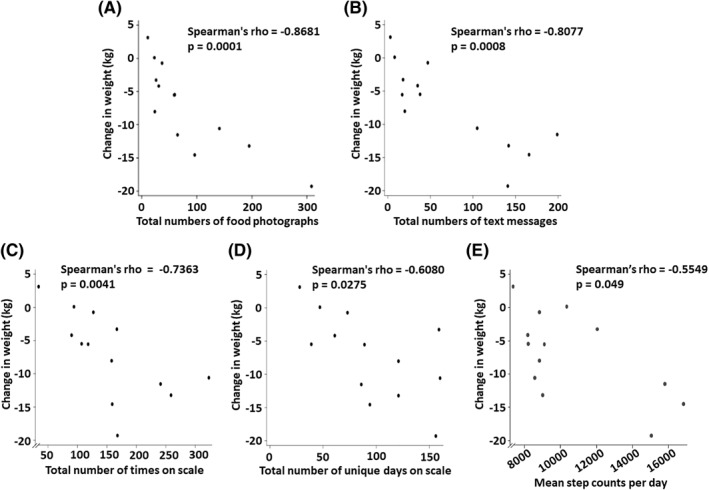
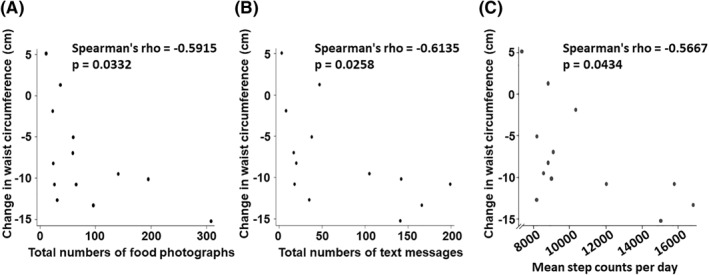
Results: At 6 months, the intervention group experienced a statistically significant weight change of -7.16 ± 1.78 kg (mean ± SE, 95% CI -11.05 to -3.26, p < 0.01), which differed from the weight change in controls by -4.16 ± 2.01 kg (95% CI -8.29 to -0.02, p < 0.05, prespecified primary outcome). Weight change in the control group was -3.00 ± 1.05 kg (95% CI -5.27 to -0.73, p < 0.05). Waist circumference and hemoglobin A1c significantly improved (intervention vs. control: p < 0.01, p < 0.05, respectively, prespecified secondary outcomes). Weight change in the intervention group correlated with numbers of food photographs participants shared (rho = -0.86, p < 0.01), numbers of their text messages (rho = -0.80, p < 0.01), number of times and days each participant stepped on the smartscale (rho = -0.73, p < 0.01; rho = -0.608, p < 0.05, respectively), and mean daily step counts (rho = -0.55, p < 0.05).
Conclusion: This app-based electronically delivered lifestyle intervention produced statistically significant, clinically meaningful weight loss and improved metabolic health. Engagement with the intervention correlated strongly with weight loss. Given the limited sample size, larger and longer studies of this intervention are needed.
Keywords: lifestyle intervention; smartphone app; weight loss.
© 2021 The Authors. Obesity Science & Practice published by World Obesity and The Obesity Society and John Wiley & Sons Ltd.
Conflict of interest statement
Kevin Jon Williams reports an ownership interest in Hygieia, Inc., and in Gemphire Therapeutics, Inc., and recently served on the Medical and Scientific Advisory Board of Gemphire Therapeutics, Inc. The other authors have no conflict of interest to declare. Portions of this work were presented at the American Diabetes Association Scientific Sessions in 2018.
Figures
References
-
- Admiraal WM, Vlaar EM, Nierkens V, et al. Intensive lifestyle intervention in general practice to prevent type 2 diabetes among 18 to 60‐year‐old South Asians: 1‐year effects on the weight status and metabolic profile of participants in a randomized controlled trial. PLoS One. 2013;8(7):e68605. 10.1371/journal.pone.0068605 - DOI - PMC - PubMed
-
- Hartmann‐Boyce J, Johns DJ, Jebb SA, Summerbell C, Aveyard P. Behavioural weight management review group. Behavioural weight management programmes for adults assessed by trials conducted in everyday contexts: systematic review and meta‐analysis. Obes Rev. 2014;15(11):920‐932. 10.1111/obr.12220 - DOI - PMC - PubMed
LinkOut - more resources
Full Text Sources