

Dynamics of coronavirus pandemic: effects of community awareness and global information campaigns
- PMID: 34631341
- PMCID: PMC8488933
- DOI: 10.1140/epjp/s13360-021-01997-6
Dynamics of coronavirus pandemic: effects of community awareness and global information campaigns
Abstract
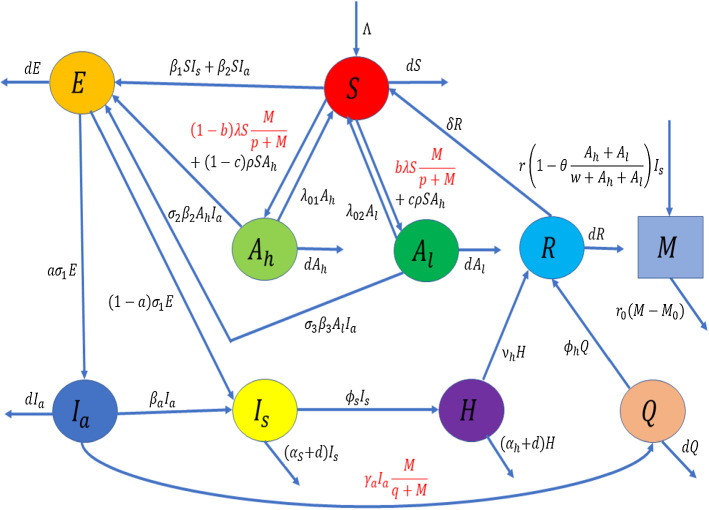
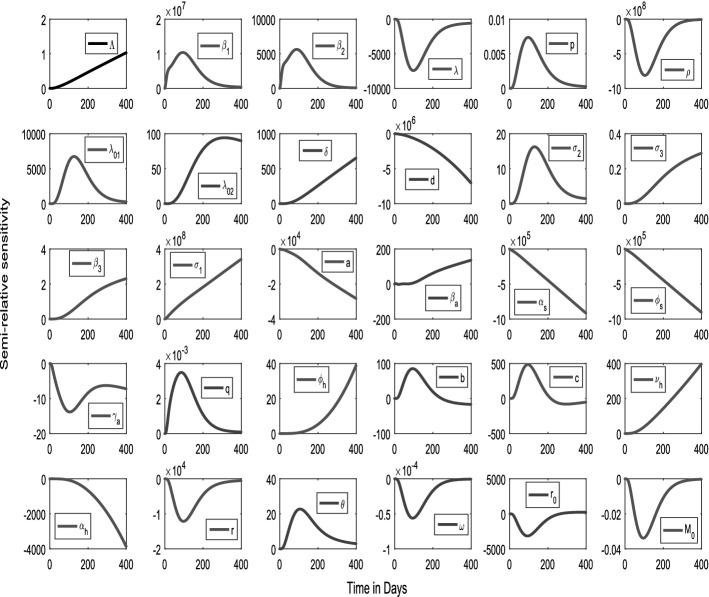
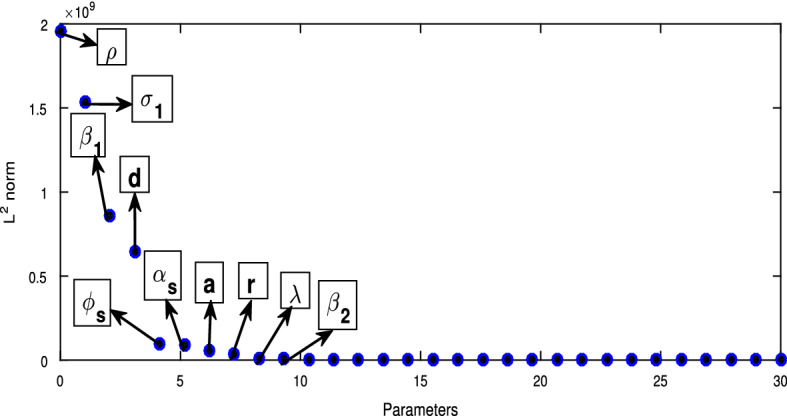
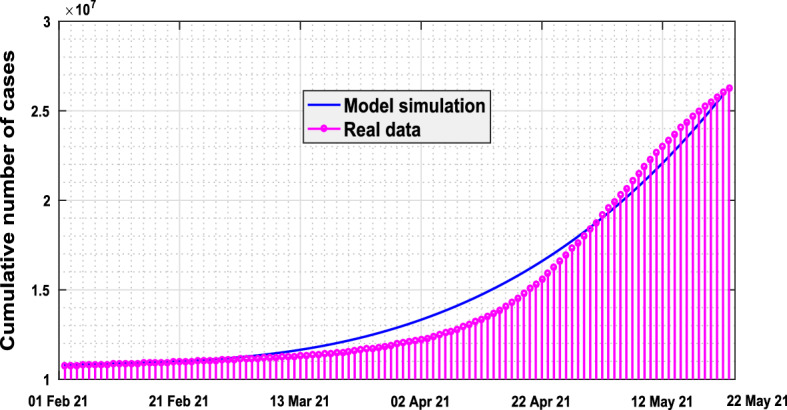
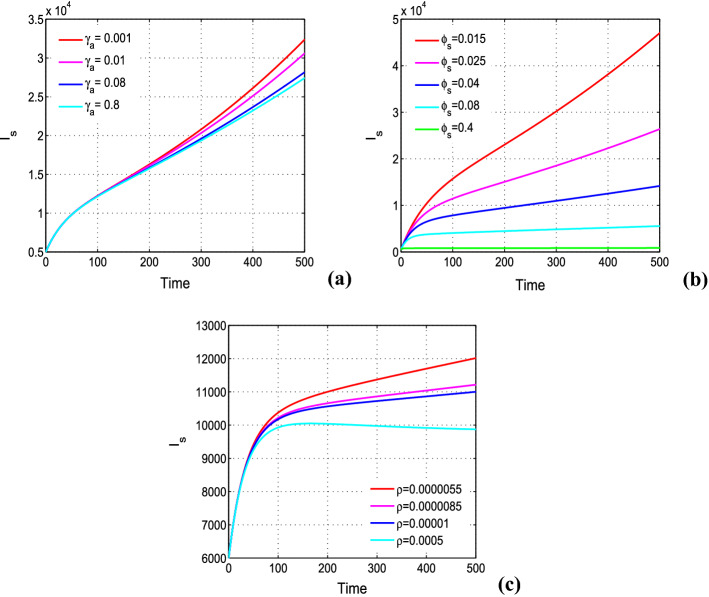
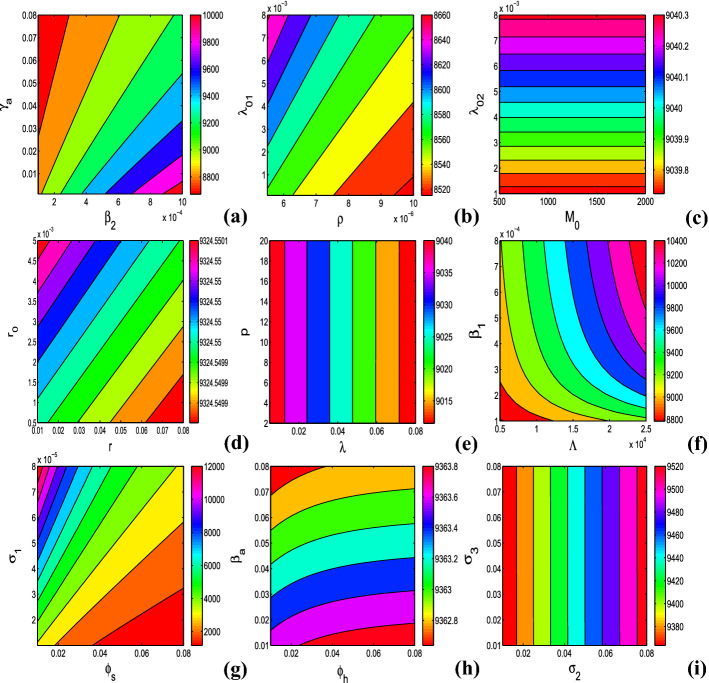
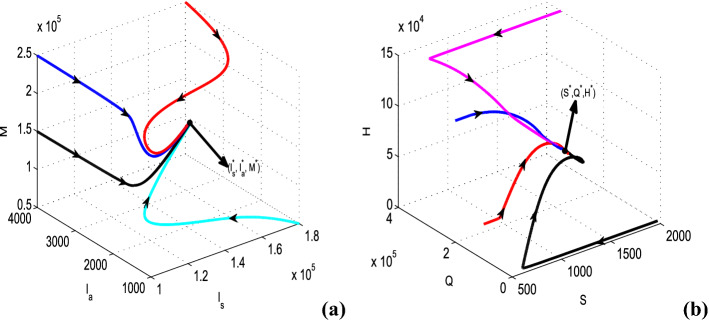
The effects of social media advertisements together with local awareness in controlling COVID-19 are explored in the present investigation by means of a mathematical model. The expression for the basic reproduction number is derived. Sufficient conditions for the global stability of endemic equilibrium are obtained. We perform sensitivity analysis to identify the key parameters of the model having great impacts on the prevalence and control of COVID-19. We calibrate the proposed model to fit the data set of COVID-19 cases for India. Our simulation results show that dissemination rate of awareness among susceptible individuals at community level and individual level plays pivotal role in curtailing the COVID-19 disease. Moreover, we observe that the global information distributing from social media and local awareness coming from mouth-to-mouth communication between unaware susceptible and aware people, together with hospitalization of symptomatic individuals and quarantine of asymptomatic individuals, are much beneficial in reducing COVID-19 cases in India. Our study suggests that both global and local awareness must be implemented effectively to manage the burden of COVID-19 pandemic.
© The Author(s), under exclusive licence to Società Italiana di Fisica and Springer-Verlag GmbH Germany, part of Springer Nature 2021.
Conflict of interest statement
Conflict of interestThe authors declare that there is no conflict of interests regarding the publication of this article.
Figures
References
-
- WHO, World Health Organization, coronavirus disease (COVID-19) pandemic. https://www.who.int/emergencies/diseases/novel-coronavirus-2019 (2020)
-
- K. Harris, Tracking the global impact of the coronavirus outbreak, Bain Macro Trends group analysis. https://www.bain.com/insights/tracking-the-global-impact-of-the-coronavi... (2020)
-
- Misra AK, Rai RK. A mathematical model for the control of infectious diseases: effects of TV and radio advertisements. Int. J. Bifurc. Chaos. 2018;28(03):1850037. doi: 10.1142/S0218127418500372. - DOI
-
- Misra AK, Rai RK. Impacts of TV and radio advertisements on the dynamics of an infectious disease: a modeling study. Math. Meth. Appl. Sci. 2019;42(4):1262–1282. doi: 10.1002/mma.5438. - DOI
LinkOut - more resources
Full Text Sources