

Scouting for common genes in the heterogenous hypoxic tumor microenvironment and their validation in glioblastoma
- PMID: 34631352
- PMCID: PMC8473528
- DOI: 10.1007/s13205-021-02987-2
Scouting for common genes in the heterogenous hypoxic tumor microenvironment and their validation in glioblastoma
Abstract
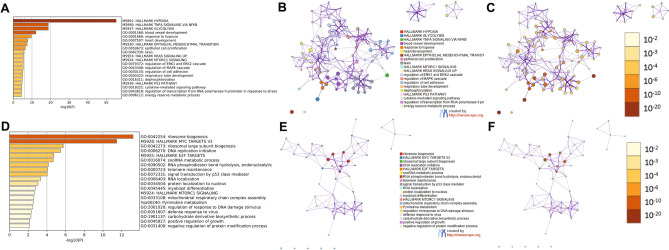
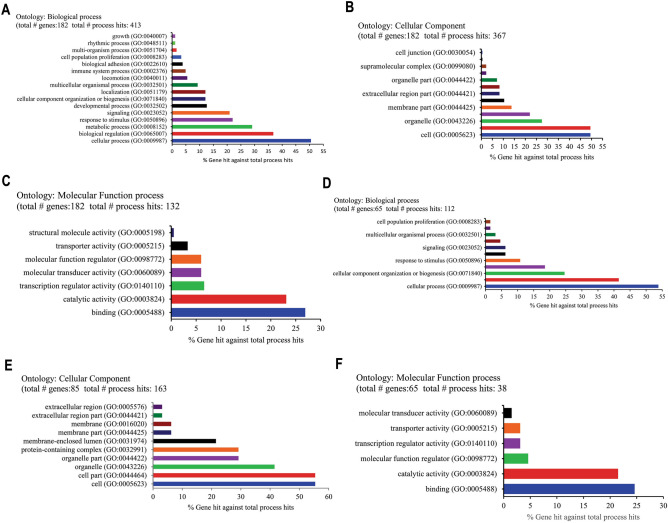
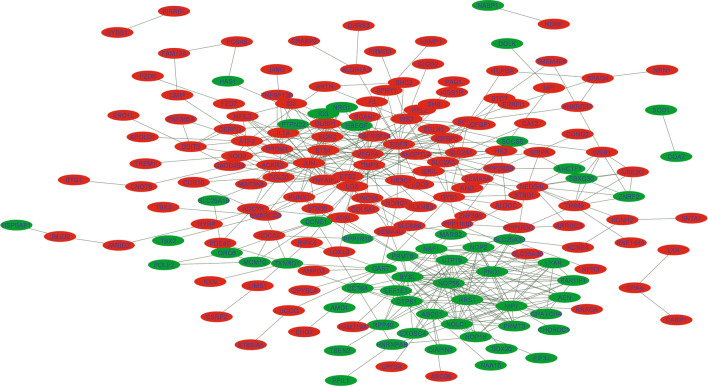
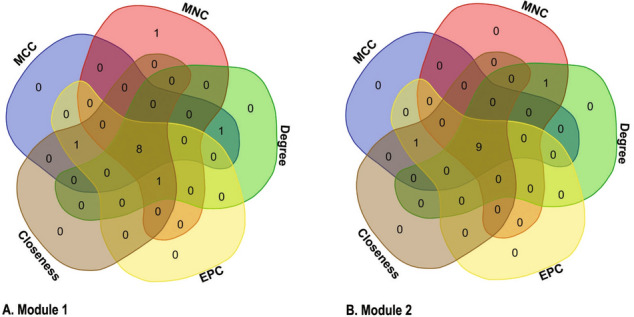
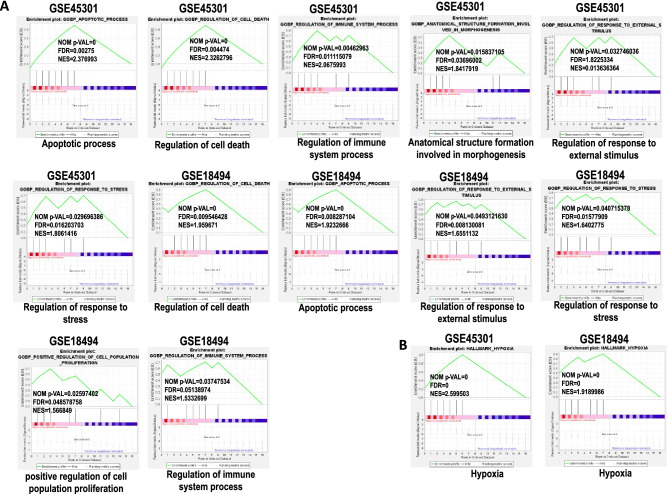
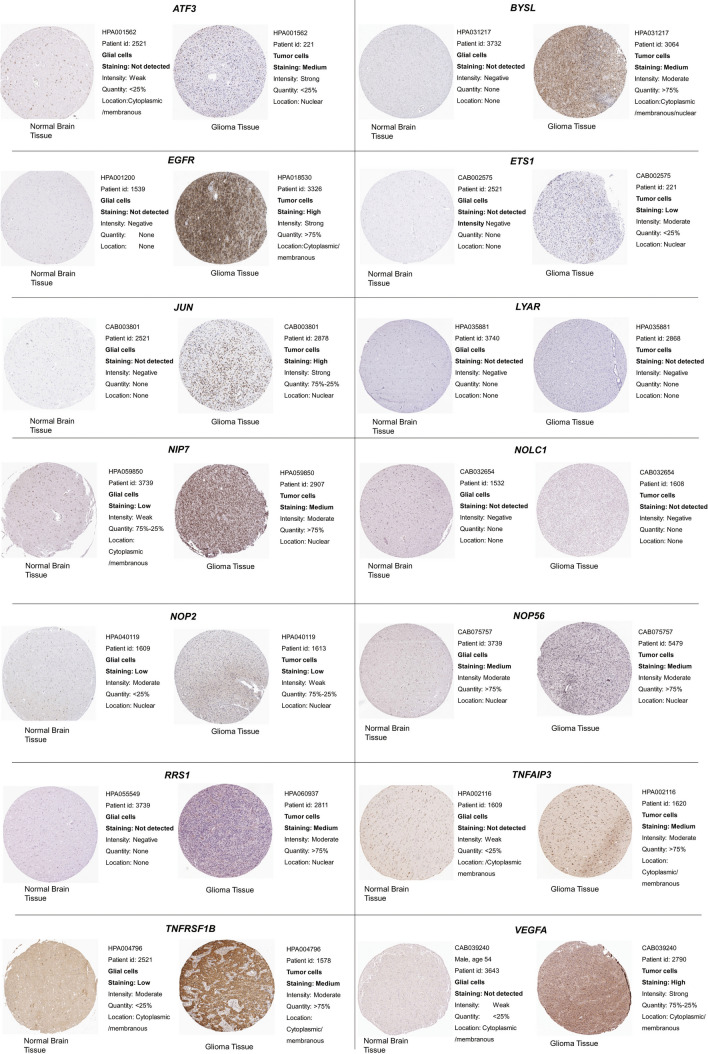
Investigating the therapeutic and prognostic potential of genes in the heterogeneous hypoxic niche of glioblastoma. We have analyzed RNA expression of U87MG cells cultured in hypoxia compared to normoxia. Common differentially expressed genes (DEGs) from GSE45301 and GSE18494 and their functional enrichment was performed using MetaScape and PANTHER. Hub genes and their ontology were identified using MCode cytoHubba and ClueGO and validated with GlioVis, Oncomine, HPA and PrognoScan. Using the GEO2R analysis of GSE45301 and GSE18494 datasets, we have found a total of 246 common DEGs (180 upregulated and 66 downregulated) and identified 2 significant modules involved in ribosome biogenesis and TNF signaling. Meta-analysis of key genes of each module in cytoHubba identified 17 hub genes (ATF3, BYSL, DUSP1, EGFR, JUN, ETS1, LYAR, NIP7, NOLC1, NOP2, NOP56, PNO1, RRS1, TNFAIP3, TNFRSF1B, UTP15, VEGFA). Of the 17 hub genes, ATF3, BYSL, EGFR, JUN, NIP7, NOLC1, PNO1, RRS1, TNFAIP3 and VEGFA were identified as hypoxia signatures associated with poor prognosis in Glioma. Ribosome biogenesis emerged as a vital contender of possible therapeutic potential with BYSL, NIP7, NOLC1, PNO1 and RRS1 showing prognostic value.
Supplementary information: The online version contains supplementary material available at 10.1007/s13205-021-02987-2.
Keywords: GEO2R; Glioma; Hub genes; Hypoxia; PPI network; Ribosome biogenesis.
© King Abdulaziz City for Science and Technology 2021.
Conflict of interest statement
Conflict of interestThe authors declare no competing interest.
Figures


Similar articles
-
Screening the Significant Hub Genes by Comparing Tumor Cells, Normoxic and Hypoxic Glioblastoma Stem-like Cell Lines Using Co-Expression Analysis in Glioblastoma.Genes (Basel). 2022 Mar 15;13(3):518. doi: 10.3390/genes13030518. Genes (Basel). 2022. PMID: 35328072 Free PMC article.
-
Identification of novel prognostic targets in glioblastoma using bioinformatics analysis.Biomed Eng Online. 2022 Apr 18;21(1):26. doi: 10.1186/s12938-022-00995-8. Biomed Eng Online. 2022. PMID: 35436915 Free PMC article.
-
Identification of hub genes and regulators associated with pancreatic ductal adenocarcinoma based on integrated gene expression profile analysis.Discov Med. 2019 Sep;28(153):159-172. Discov Med. 2019. PMID: 31926587
-
High gene expression levels of VEGFA and CXCL8 in the peritumoral brain zone are associated with the recurrence of glioblastoma: A bioinformatics analysis.Oncol Lett. 2019 Dec;18(6):6171-6179. doi: 10.3892/ol.2019.10988. Epub 2019 Oct 14. Oncol Lett. 2019. PMID: 31788092 Free PMC article.
-
Integrated bioinformatics analysis for the screening of hub genes and therapeutic drugs in ovarian cancer.J Ovarian Res. 2020 Jan 27;13(1):10. doi: 10.1186/s13048-020-0613-2. J Ovarian Res. 2020. PMID: 31987036 Free PMC article.
Cited by
-
Ribosomes and Ribosomal Proteins Promote Plasticity and Stemness Induction in Glioma Cells via Reprogramming.Cells. 2022 Jul 7;11(14):2142. doi: 10.3390/cells11142142. Cells. 2022. PMID: 35883585 Free PMC article. Review.
-
Identification of Candidate lncRNA and Pseudogene Biomarkers Associated with Carbon-Nanotube-Induced Malignant Transformation of Lung Cells and Prediction of Potential Preventive Drugs.Int J Environ Res Public Health. 2022 Mar 2;19(5):2936. doi: 10.3390/ijerph19052936. Int J Environ Res Public Health. 2022. PMID: 35270630 Free PMC article.
-
The roles of NOP56 in cancer and SCA36.Pathol Oncol Res. 2023 Jan 19;29:1610884. doi: 10.3389/pore.2023.1610884. eCollection 2023. Pathol Oncol Res. 2023. PMID: 36741964 Free PMC article. Review.
-
Molecular landscapes of glioblastoma cell lines revealed a group of patients that do not benefit from WWOX tumor suppressor expression.Front Neurosci. 2023 Sep 15;17:1260409. doi: 10.3389/fnins.2023.1260409. eCollection 2023. Front Neurosci. 2023. PMID: 37781246 Free PMC article.
-
Identification and validation of ubiquitination-related signature and subgroups in immune microenvironment of tuberculosis.Aging (Albany NY). 2023 Nov 9;15(21):12570-12587. doi: 10.18632/aging.205198. Epub 2023 Nov 9. Aging (Albany NY). 2023. PMID: 37950733 Free PMC article.
References
LinkOut - more resources
Full Text Sources
Research Materials
Miscellaneous
