

A Focal Adhesion-Related Gene Signature Predicts Prognosis in Glioma and Correlates With Radiation Response and Immune Microenvironment
- PMID: 34631528
- PMCID: PMC8493301
- DOI: 10.3389/fonc.2021.698278
A Focal Adhesion-Related Gene Signature Predicts Prognosis in Glioma and Correlates With Radiation Response and Immune Microenvironment
Abstract
Background: Glioma is the most frequent brain malignancy presenting very poor prognosis and high recurrence rate. Focal adhesion complexes play pivotal roles in cell migration and act as hubs of several signaling pathways.
Methods: We used bioinformatic databases (CGGA, TCGA, and GEO) and identified a focal adhesion-related differential gene expression (FADG) signature by uniCox and LASSO regression analysis. We calculated the risk score of every patient using the regression coefficient value and expression of each gene. Survival analysis, receiver operating characteristic curve (ROC), principal component analysis (PCA), and stratified analysis were used to validate the FADG signature. Then, we conducted GSEA to identify the signaling pathways related to the FADG signature. Correlation analysis of risk scores between the immune checkpoint was performed. In addition, the correlation of risk scores and genes related with DNA repair was performed. CIBERSORT and ssGSEA were used to explore the tumor microenvironment (TME). A nomogram that involved our FADG signature was also constructed.
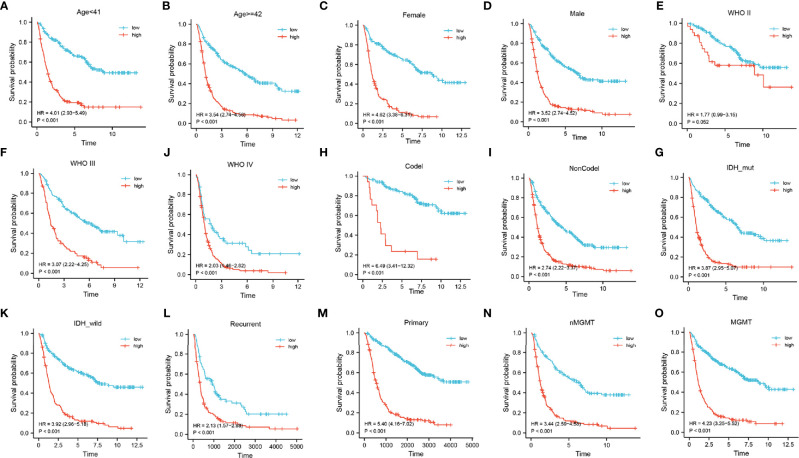
Results: In total, 1,726 (528 patients diagnosed with WHO II, 591 WHO III, and 603 WHO IV) cases and 23 normal samples were included in our study. We identified 29 prognosis-related genes in the LASSO analysis and constructed an eight FADG signature. The results from the survival analysis, stratified analysis, ROC curve, and univariate and multivariate regression analysis revealed that the prognosis of the high-risk group was significantly worse than the low-risk group. Correlation analysis between risk score and genes that related with DNA repair showed that the risk score was positively related with BRCA1, BRCA2, RAD51, TGFB1, and TP53. Besides, we found that the signature could predict the prognosis of patients who received radiation therapy. SsGSEA indicated that the high-risk score was positively correlated with the ESTIMATE, immune, and stromal scores but negatively correlated with tumor purity. Notably, patients in the high-risk group had a high infiltration of immunocytes. The correlation analysis revealed that the risk score was positively correlated with B7-H3, CTLA4, LAG3, PD-L1, and TIM3 but inversely correlated with PD-1.
Conclusion: The FADG signature we constructed could provide a sensitive prognostic model for patients with glioma and contribute to improve immunotherapy management guidelines.
Keywords: focal adhesion; glioma; immune checkpoints; prognosis; radiation response; tumor microenvironment.
Copyright © 2021 Li, Wang, Wang, Pan, Zhou, Han, Su, Ma, Hou and Xue.
Conflict of interest statement
The authors declare that the research was conducted in the absence of any commercial or financial relationships that could be construed as a potential conflict of interest.
Figures


Similar articles
-
Pyroptosis-Related Gene Signature Predicts Prognosis and Indicates Immune Microenvironment Infiltration in Glioma.Front Cell Dev Biol. 2022 Apr 25;10:862493. doi: 10.3389/fcell.2022.862493. eCollection 2022. Front Cell Dev Biol. 2022. PMID: 35547808 Free PMC article.
-
MELK is a prognostic biomarker and correlated with immune infiltration in glioma.Front Neurol. 2022 Oct 24;13:977180. doi: 10.3389/fneur.2022.977180. eCollection 2022. Front Neurol. 2022. PMID: 36353126 Free PMC article.
-
Identification of prognostic gene signature associated with microenvironment of lung adenocarcinoma.PeerJ. 2019 Nov 29;7:e8128. doi: 10.7717/peerj.8128. eCollection 2019. PeerJ. 2019. PMID: 31803536 Free PMC article.
-
A Prognostic DNA Damage Repair Genes Signature and Its Impact on Immune Cell Infiltration in Glioma.Front Oncol. 2021 May 28;11:682932. doi: 10.3389/fonc.2021.682932. eCollection 2021. Front Oncol. 2021. PMID: 34123852 Free PMC article.
-
A Prognostic Microenvironment-Related Immune Signature via ESTIMATE (PROMISE Model) Predicts Overall Survival of Patients With Glioma.Front Oncol. 2020 Dec 7;10:580263. doi: 10.3389/fonc.2020.580263. eCollection 2020. Front Oncol. 2020. PMID: 33425732 Free PMC article.
Cited by
-
The oncogenic role of CCDC34 in lower-grade gliomas: prognostic significance and therapeutic potential.J Neurooncol. 2025 Oct;175(1):71-89. doi: 10.1007/s11060-025-05090-1. Epub 2025 Jun 16. J Neurooncol. 2025. PMID: 40522566 Free PMC article.
-
The basement membrane-related gene signature is associated with immunity and predicts survival accurately in hepatocellular carcinoma.J Cancer Res Clin Oncol. 2023 Aug;149(9):5751-5760. doi: 10.1007/s00432-022-04549-2. Epub 2022 Dec 27. J Cancer Res Clin Oncol. 2023. PMID: 36575345 Free PMC article.
-
PD-L2 Serves as a Potential Prognostic Biomarker That Correlates With Immune Infiltration and May Predict Therapeutic Sensitivity in Lower-Grade Gliomas.Front Oncol. 2022 Jun 8;12:860640. doi: 10.3389/fonc.2022.860640. eCollection 2022. Front Oncol. 2022. PMID: 35756621 Free PMC article.
-
Mutational accumulation drives pathway dysregulation to predict glioma patient survival.Sci Rep. 2025 Jul 22;15(1):26656. doi: 10.1038/s41598-025-12346-3. Sci Rep. 2025. PMID: 40696074 Free PMC article.
-
Integrative Disulfidptosis-Based Risk Assessment for Prognostic Stratification and Immune Profiling in Glioma.J Cell Mol Med. 2025 Feb;29(4):e70429. doi: 10.1111/jcmm.70429. J Cell Mol Med. 2025. PMID: 39993959 Free PMC article.
References
LinkOut - more resources
Full Text Sources
Research Materials
Miscellaneous