

CDT1 Is a Novel Prognostic and Predictive Biomarkers for Hepatocellular Carcinoma
- PMID: 34631549
- PMCID: PMC8497762
- DOI: 10.3389/fonc.2021.721644
CDT1 Is a Novel Prognostic and Predictive Biomarkers for Hepatocellular Carcinoma
Erratum in
-
Corrigendum: CDT1 is a Novel Prognostic and Predictive Biomarkers for Hepatocellular Carcinoma.Front Oncol. 2021 Nov 9;11:801970. doi: 10.3389/fonc.2021.801970. eCollection 2021. Front Oncol. 2021. PMID: 34900749 Free PMC article.
Abstract
Objective: Hepatocellular carcinoma (HCC) is one of the most common malignant tumors endangering human health and life in the 21st century. Chromatin licensing and DNA replication factor 1 (CDT1) is an important regulator of DNA replication licensing, which is essential for initiation of DNA replication. CDT1 overexpression in several human cancers reportedly leads to abnormal cell replication, activates DNA damage checkpoints, and predisposes malignant transformation. However, the abnormal expression of CDT1 in HCC and its diagnostic and prognostic value remains to be elucidated.
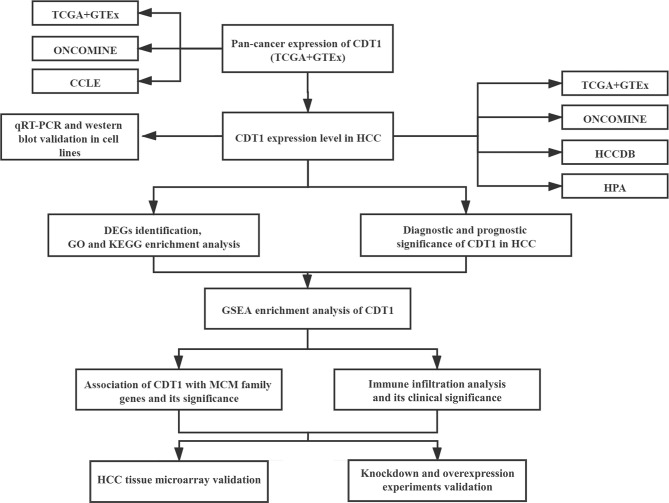
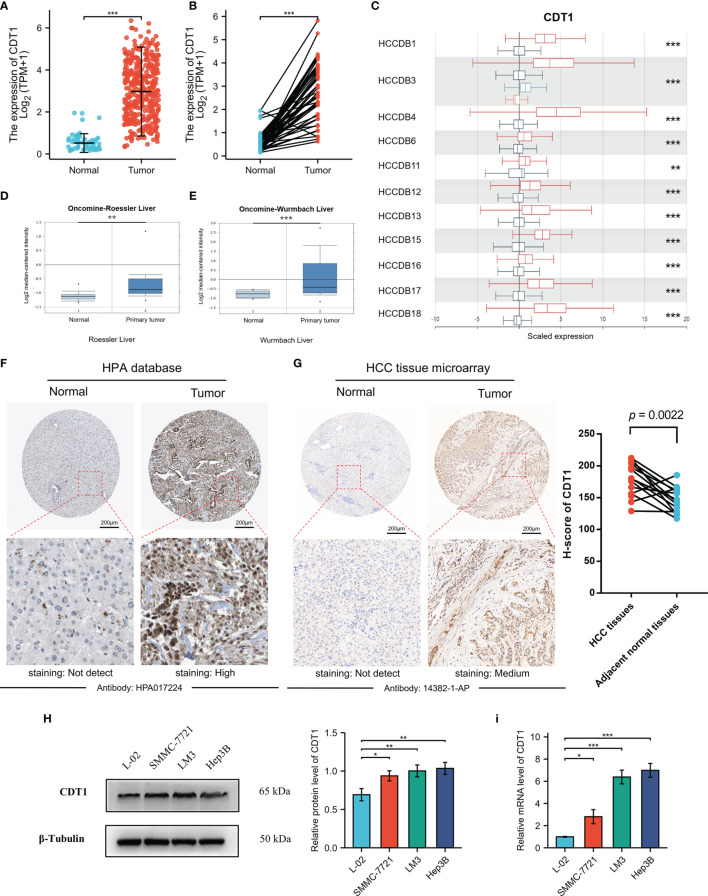
Methods: TCGA, ONCOMINE, UALCAN, HCCDB, HPA, Kaplan-Meier plotter, STRING, GEPIA, GeneMANIA, and TIMER were conducted for bioinformatics analysis. CDT1 protein expression was evaluated by immunohistochemistry in HCC tissues through a tissue microarray. qRT-PCR, western blot and a cohort of functional experiments were performed for in vitro validation.
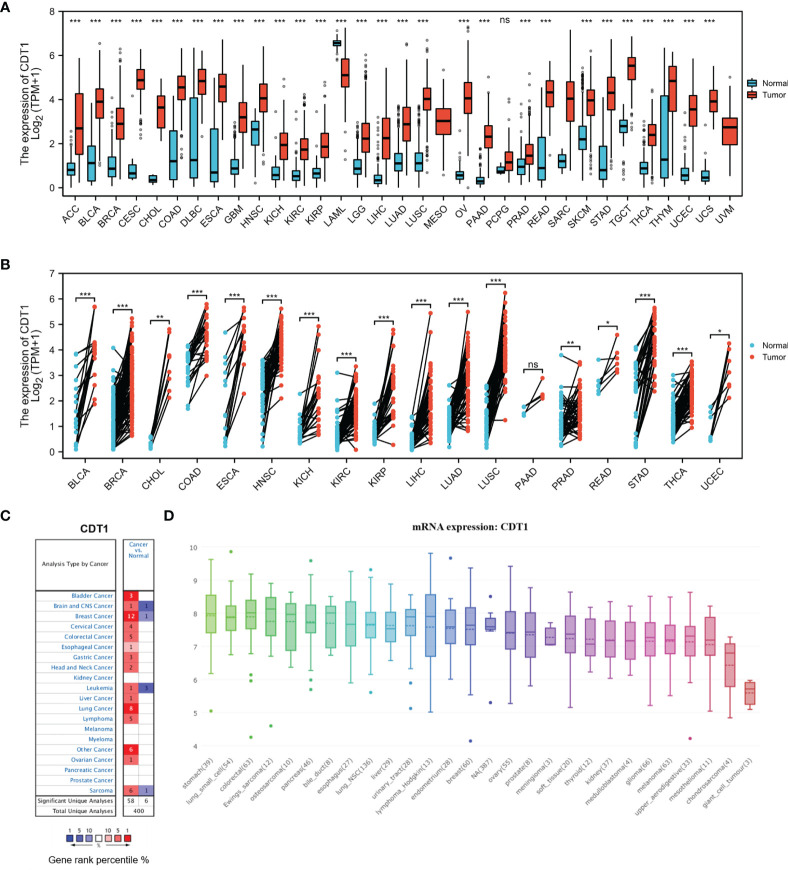
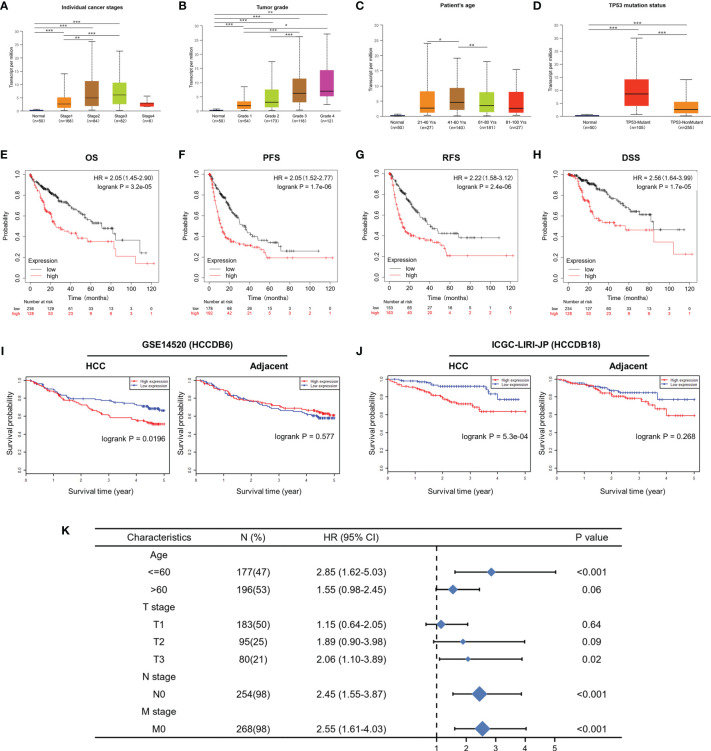
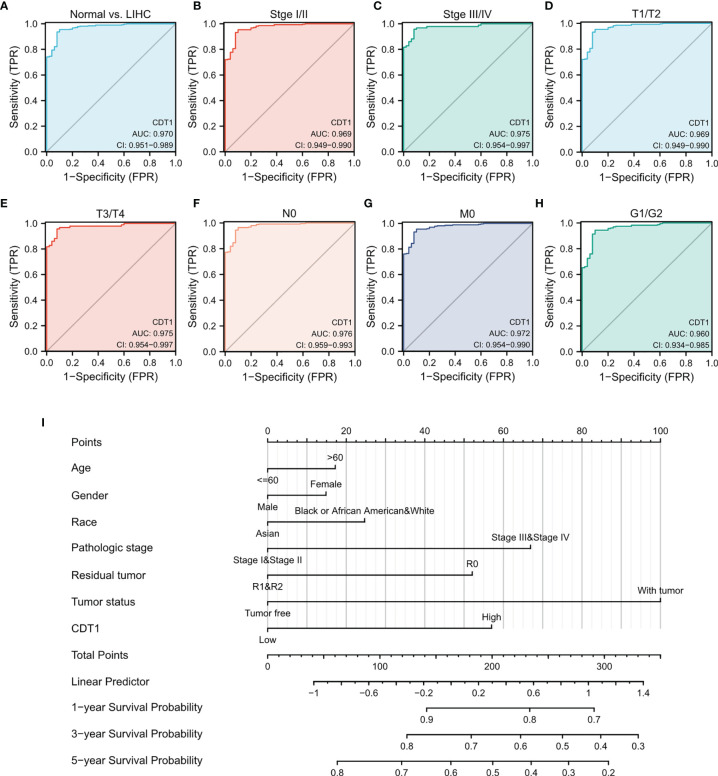
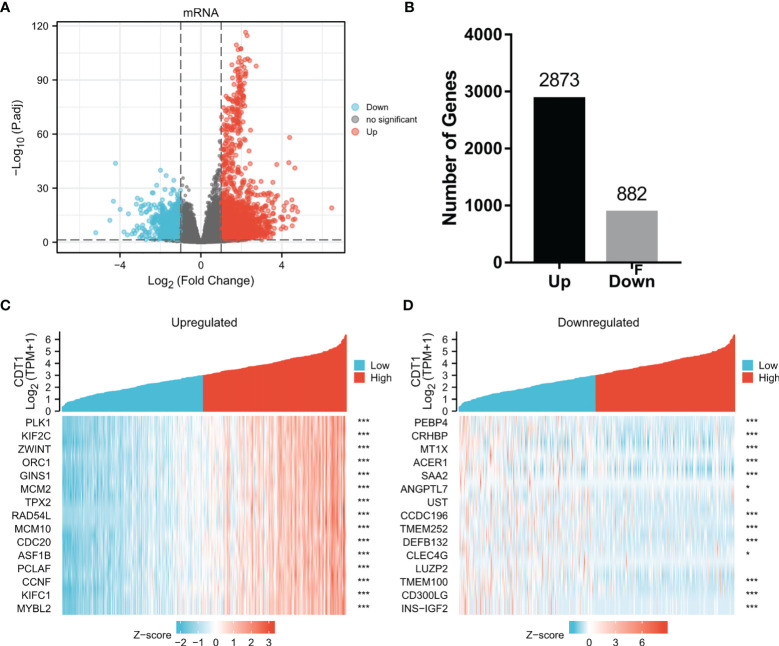
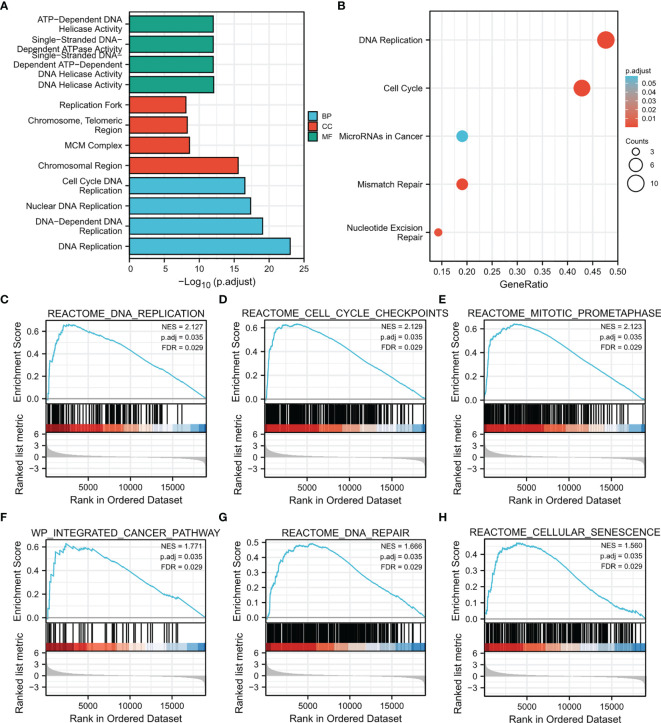
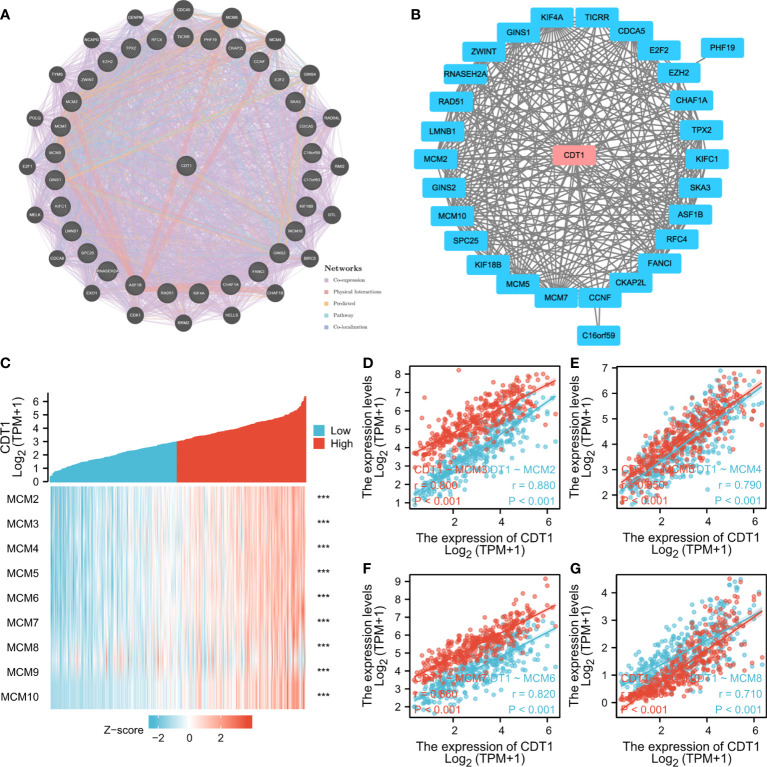
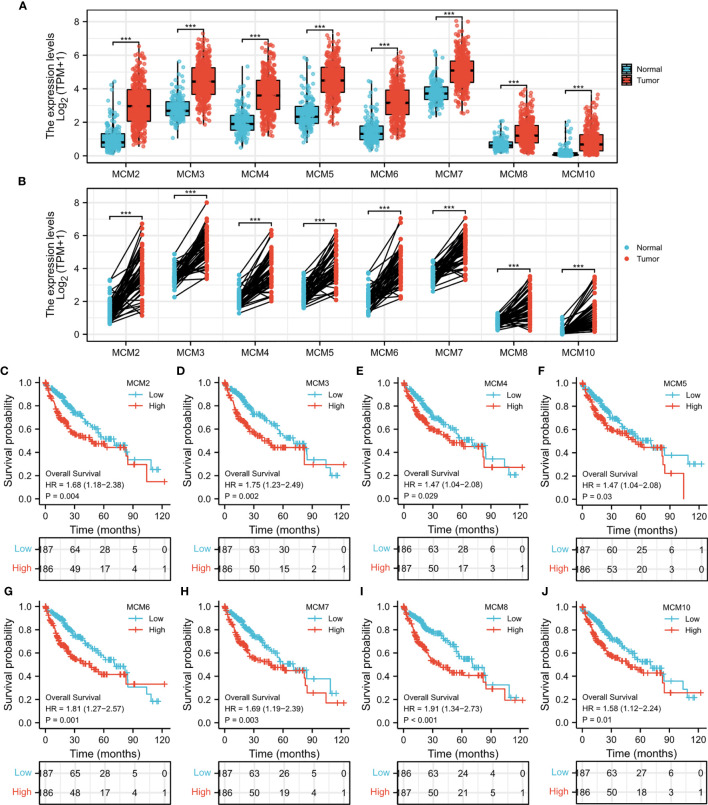
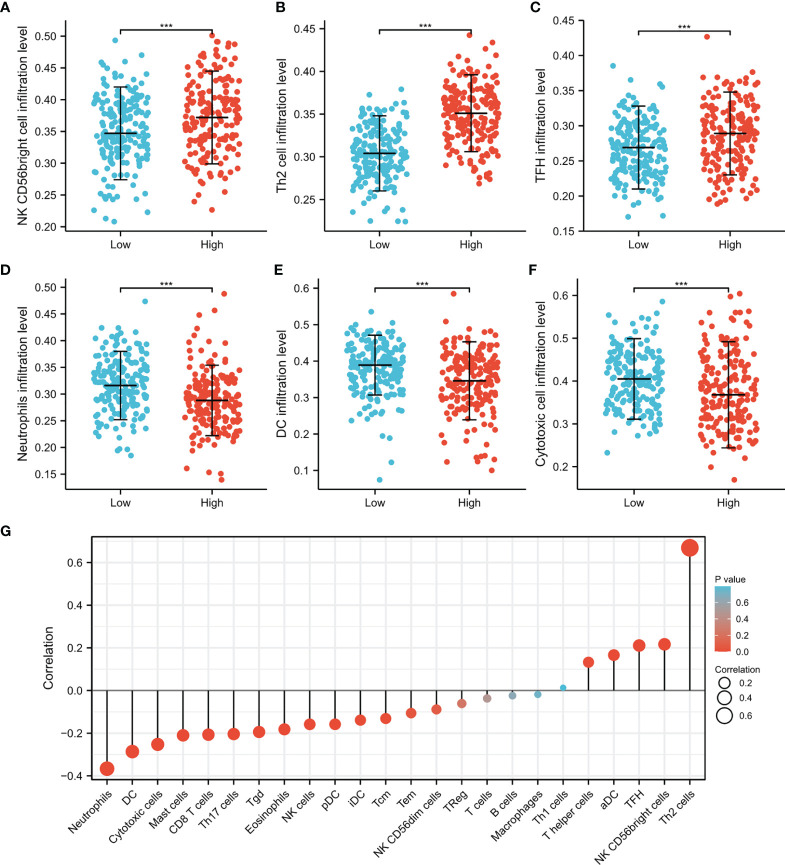
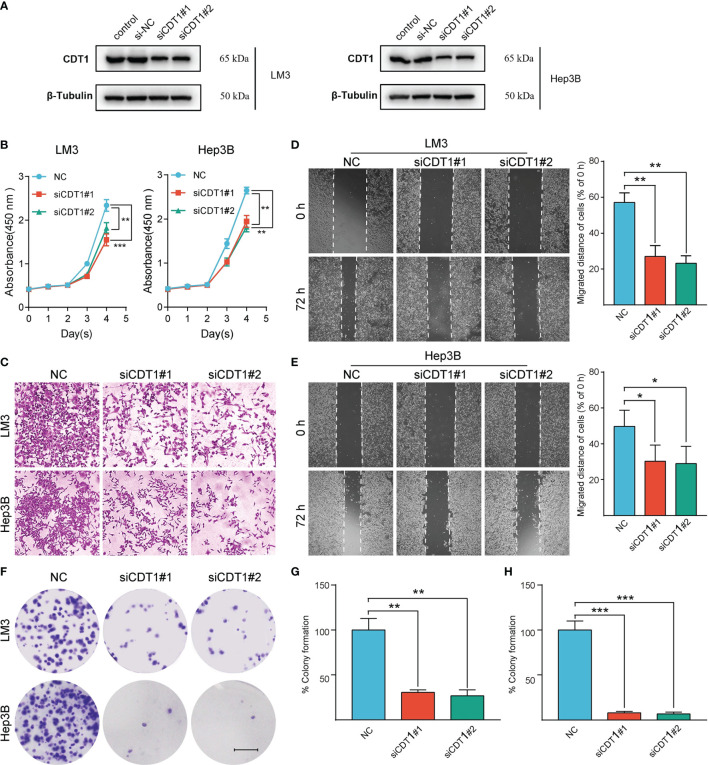
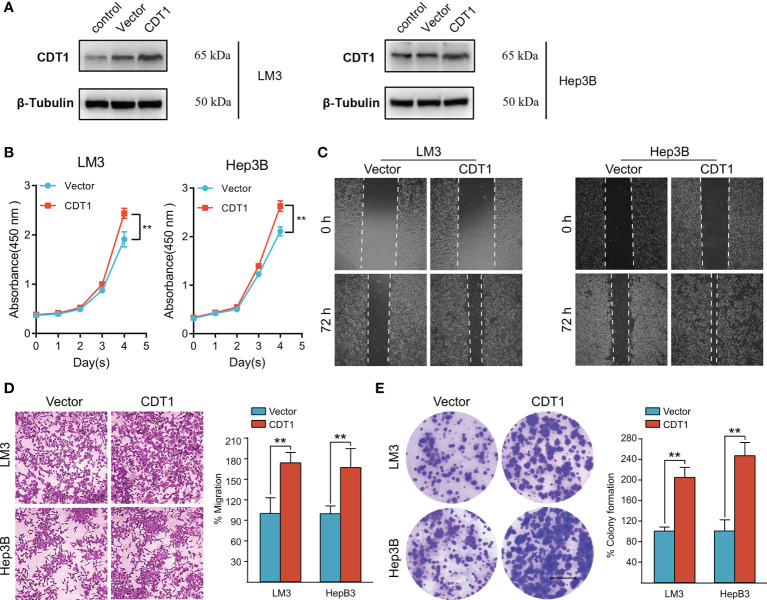
Results: In this study, we discovered remarkably upregulated transcription of CDT1 in HCC samples relative to normal liver samples through bioinformatic analysis, which was further verified in clinical tissue microarray samples and in vitro experiments. Moreover, the transcriptional level of CDT1 in HCC samples was positively associated with clinical parameters such as clinical tumor stage. Survival, logistic regression, and Cox regression analyses revealed the significant clinical prognostic value of CDT1 expression in HCC. The receiver operating characteristic curve and nomogram analysis results demonstrated the strong predictive ability of CDT1 in HCC. Kyoto Encyclopedia of Genes and Genomes and gene set enrichment analyses indicated that CDT1 was mainly associated with the cell cycle, DNA repair, and DNA replication. We further demonstrated the significant correlation between CDT1 and minichromosome maintenance (MCM) family genes, revealing abnormal expression and prognostic significance of MCMs in HCC. Immune infiltration analysis indicated that CDT1 was significantly associated with immune cell subsets and affected the survival of HCC patients. Finally, knockdown of CDT1 decreased, whereas overexpression of CDT1 promoted the proliferation, migration, invasion of HCC cells in vitro.
Conclusions: Our study findings demonstrate the potential diagnostic and prognostic significance of CDT1 expression in HCC, and elucidate the potential molecular mechanism underlying its role in promoting the occurrence and development of liver cancer. These results may provide new opportunities and research paths for targeted therapies in HCC.
Keywords: CDT1; bioinformatics analysis; immune infiltration; liver hepatocellular carcinoma; prognostic value.
Copyright © 2021 Cai, Zhang, Hu, Hu, Yang, Qiu and Chu.
Conflict of interest statement
The authors declare that the research was conducted in the absence of any commercial or financial relationships that could be construed as a potential conflict of interest.
Figures
Similar articles
-
Spindle and Kinetochore-associated Family Genes are Prognostic and Predictive Biomarkers in Hepatocellular Carcinoma.J Clin Transl Hepatol. 2022 Aug 28;10(4):627-641. doi: 10.14218/JCTH.2021.00216. Epub 2022 Jan 4. J Clin Transl Hepatol. 2022. PMID: 36062274 Free PMC article.
-
High expression of PDZ-binding kinase is correlated with poor prognosis and immune infiltrates in hepatocellular carcinoma.World J Surg Oncol. 2022 Jan 22;20(1):22. doi: 10.1186/s12957-021-02479-w. World J Surg Oncol. 2022. PMID: 35065633 Free PMC article.
-
Bioinformatics analysis of the transcriptional expression of minichromosome maintenance proteins as potential indicators of survival in patients with cervical cancer.BMC Cancer. 2021 Aug 18;21(1):928. doi: 10.1186/s12885-021-08674-y. BMC Cancer. 2021. PMID: 34404366 Free PMC article.
-
MCM family in HCC: MCM6 indicates adverse tumor features and poor outcomes and promotes S/G2 cell cycle progression.BMC Cancer. 2018 Feb 20;18(1):200. doi: 10.1186/s12885-018-4056-8. BMC Cancer. 2018. PMID: 29463213 Free PMC article. Review.
-
Systematic summarization of the expression profiles and prognostic roles of the dishevelled gene family in hepatocellular carcinoma.Mol Genet Genomic Med. 2020 Sep;8(9):e1384. doi: 10.1002/mgg3.1384. Epub 2020 Jun 26. Mol Genet Genomic Med. 2020. PMID: 32588988 Free PMC article.
Cited by
-
The proliferation of atypical hepatocytes and CDT1 expression in noncancerous tissue are associated with the postoperative recurrence of hepatocellular carcinoma.Sci Rep. 2022 Nov 28;12(1):20508. doi: 10.1038/s41598-022-25201-6. Sci Rep. 2022. PMID: 36443564 Free PMC article.
-
Gene co-expression network analysis revealed novel biomarkers for ovarian cancer.Front Genet. 2022 Oct 19;13:971845. doi: 10.3389/fgene.2022.971845. eCollection 2022. Front Genet. 2022. PMID: 36338962 Free PMC article.
-
Establishment and validation of a ferroptosis-related prognostic signature for hepatocellular carcinoma.Front Oncol. 2023 Apr 18;13:1149370. doi: 10.3389/fonc.2023.1149370. eCollection 2023. Front Oncol. 2023. PMID: 37143953 Free PMC article.
-
Clinical Significance and Potential Role of LSM4 Overexpression in Hepatocellular Carcinoma: An Integrated Analysis Based on Multiple Databases.Front Genet. 2022 Jan 13;12:804916. doi: 10.3389/fgene.2021.804916. eCollection 2021. Front Genet. 2022. PMID: 35096017 Free PMC article.
-
A novel tumor 4-driver gene signature for the prognosis of hepatocellular carcinoma.Heliyon. 2023 Jun 7;9(6):e17054. doi: 10.1016/j.heliyon.2023.e17054. eCollection 2023 Jun. Heliyon. 2023. PMID: 37484410 Free PMC article.
References
LinkOut - more resources
Full Text Sources