

Systematic Characterization of Novel Immune Gene Signatures Predicts Prognostic Factors in Hepatocellular Carcinoma
- PMID: 34631695
- PMCID: PMC8494981
- DOI: 10.3389/fcell.2021.686664
Systematic Characterization of Novel Immune Gene Signatures Predicts Prognostic Factors in Hepatocellular Carcinoma
Abstract
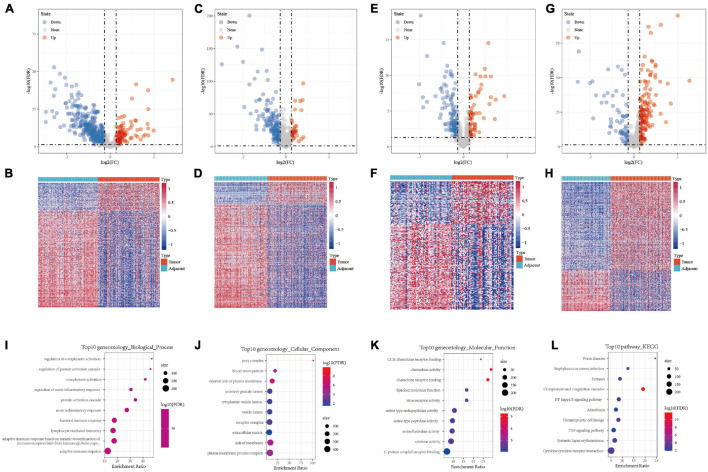
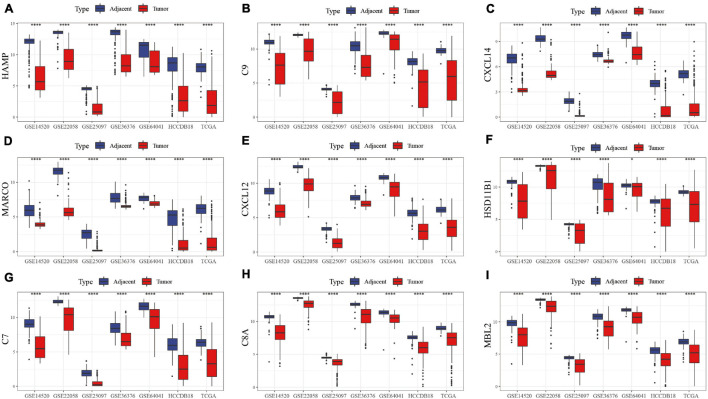
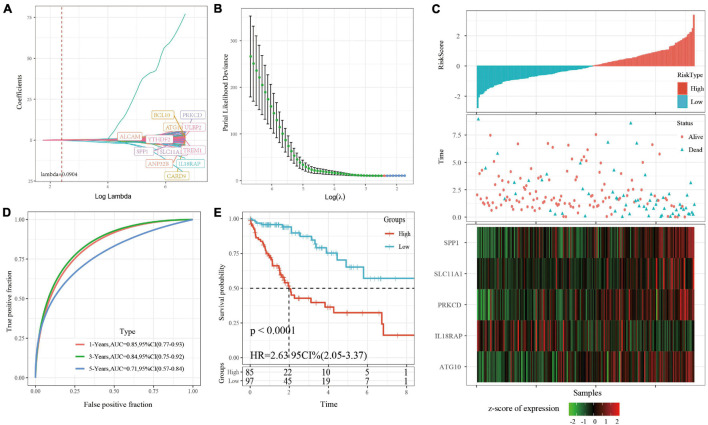
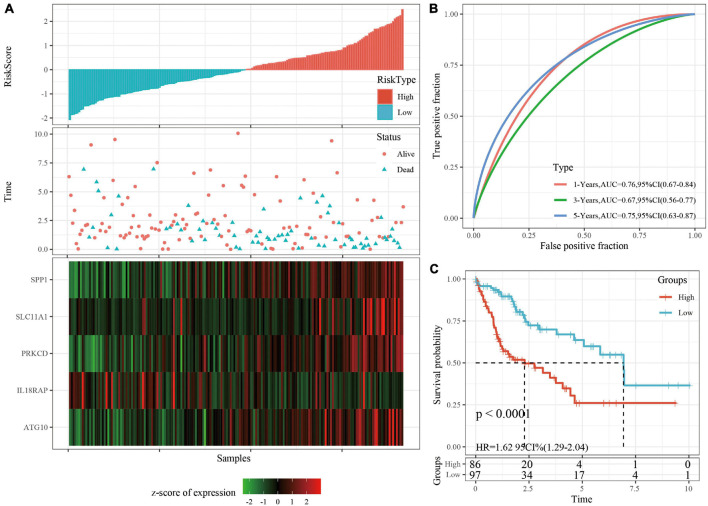
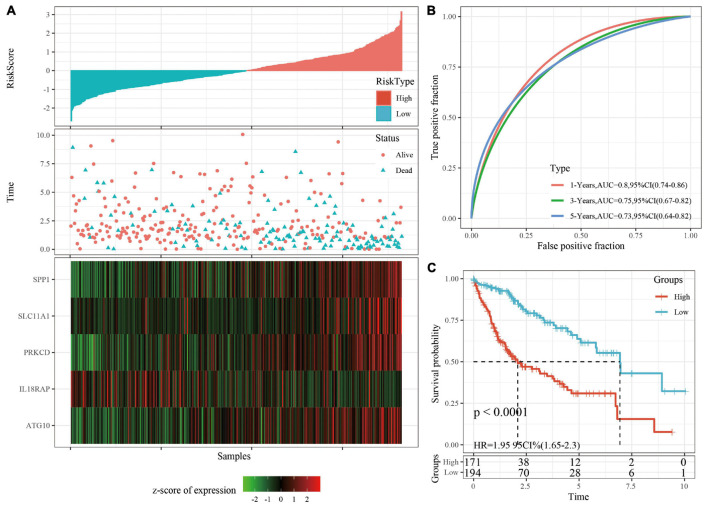
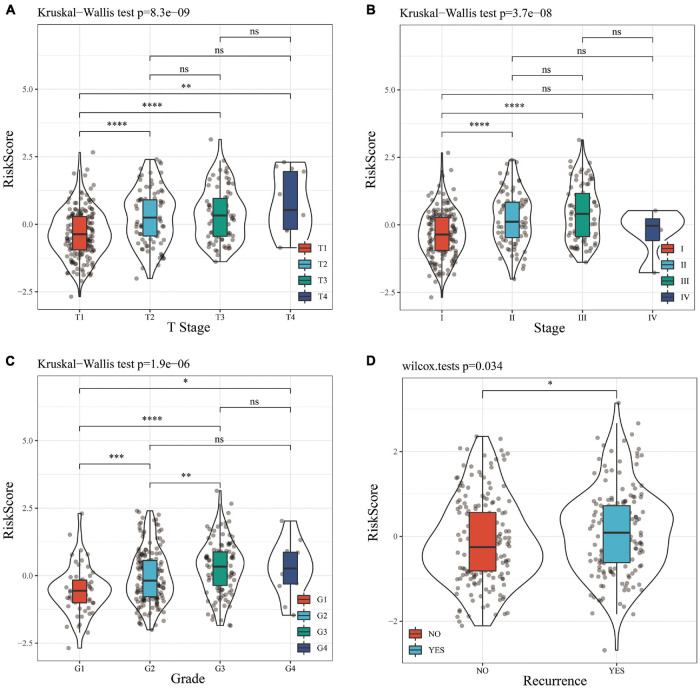
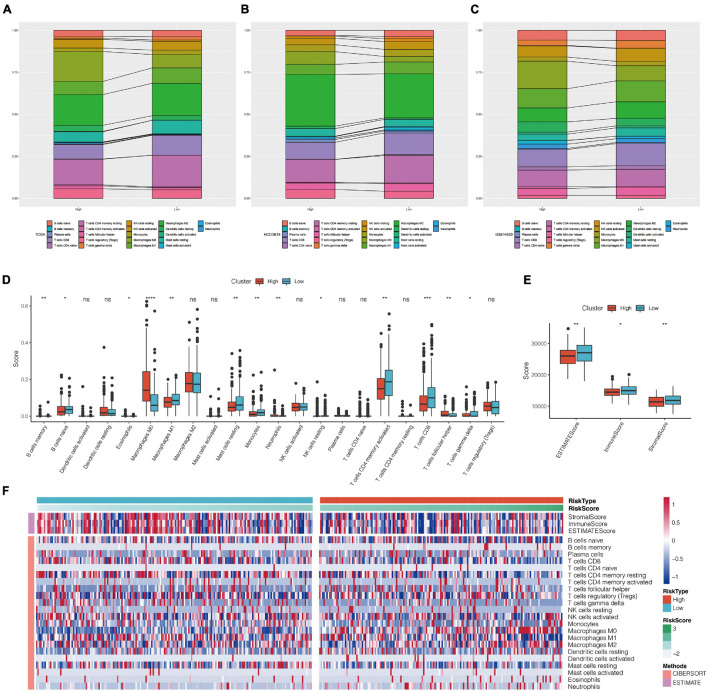
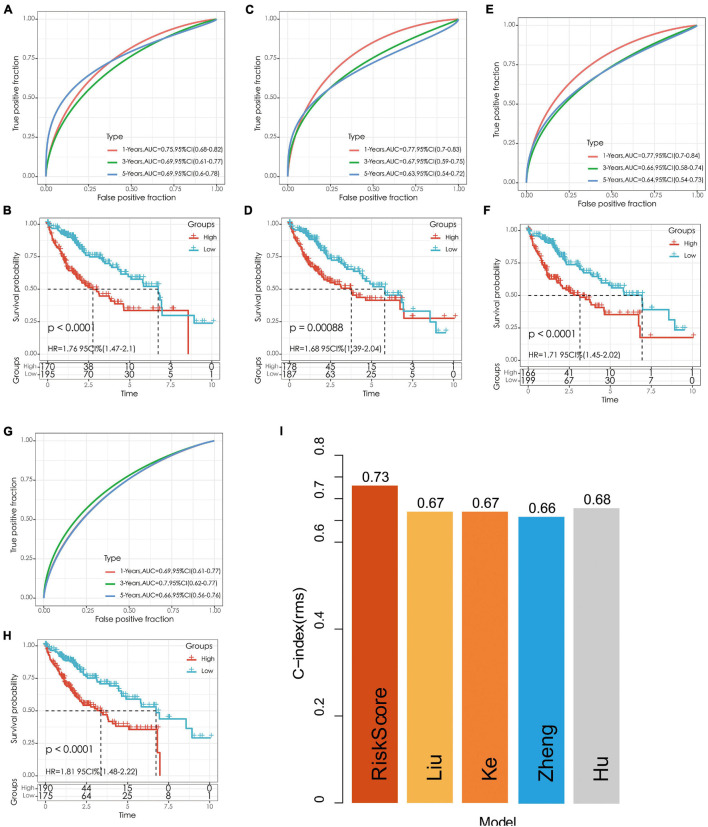
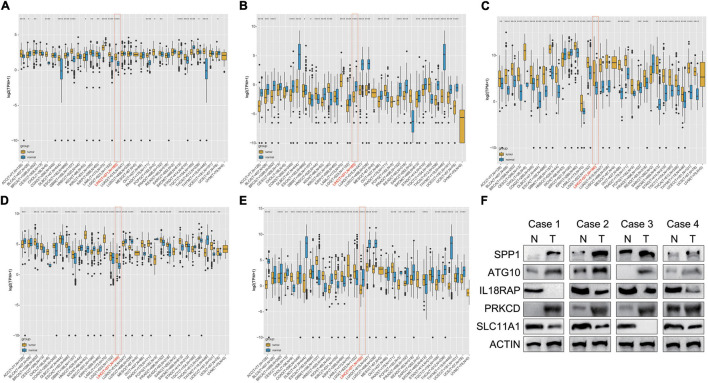
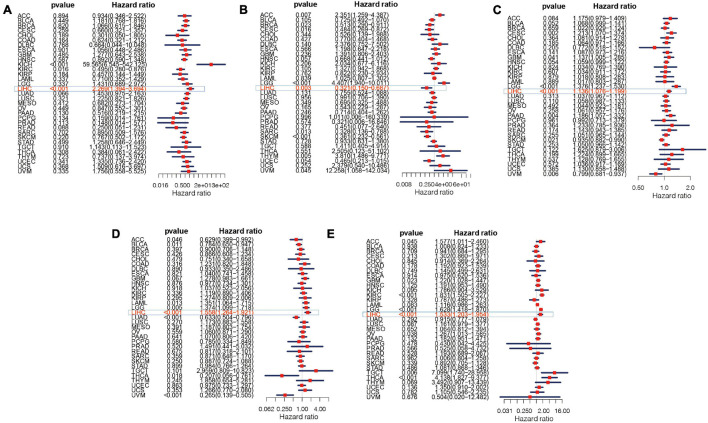
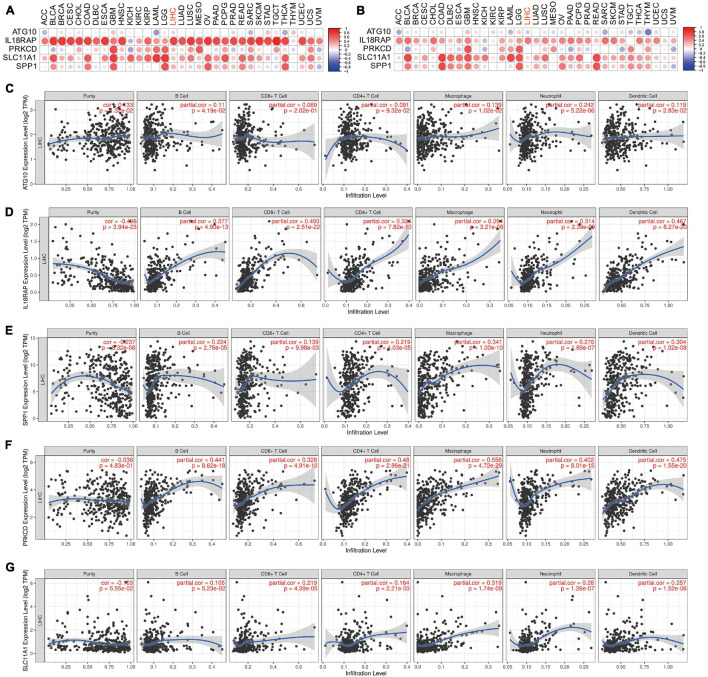
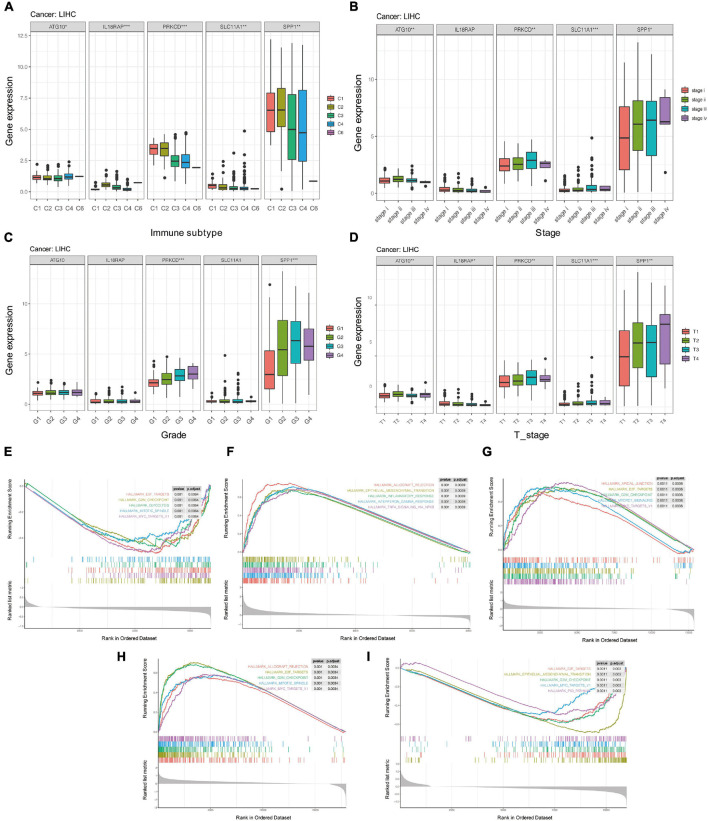
Background: The prognosis of patients with hepatocellular carcinoma (HCC) is negatively affected by the lack of effective prognostic indicators. The change of tumor immune microenvironment promotes the development of HCC. This study explored new markers and predicted the prognosis of HCC patients by systematically analyzing immune characteristic genes. Methods: Immune-related genes were obtained, and the differentially expressed immune genes (DEIGs) between tumor and para-cancer samples were identified and analyzed using gene expression profiles from TCGA, HCCDB, and GEO databases. An immune prognosis model was also constructed to evaluate the predictive performance in different cohorts. The high and low groups were divided based on the risk score of the model, and different algorithms were used to evaluate the tumor immune infiltration cell (TIIC). The expression and prognosis of core genes in pan-cancer cohorts were analyzed, and gene enrichment analysis was performed using clusterProfiler. Finally, the expression of the hub genes of the model was validated by clinical samples. Results: Based on the analysis of 730 immune-related genes, we identified 64 common DEIGs. These genes were enriched in the tumor immunologic related signaling pathways. The first 15 genes were selected using RankAggreg analysis, and all the genes showed a consistent expression trend across multi-cohorts. Based on lasso cox regression analysis, a 5-gene signature risk model (ATG10, IL18RAP, PRKCD, SLC11A1, and SPP1) was constructed. The signature has strong robustness and can stabilize different cohorts (TCGA-LIHC, HCCDB18, and GSE14520). Compared with other existing models, our model has better performance. CIBERSORT was used to assess the landscape maps of 22 types of immune cells in TCGA, GSE14520, and HCCDB18 cohorts, and found a consistent trend in the distribution of TIIC. In the high-risk score group, scores of Macrophages M1, Mast cell resting, and T cells CD8 were significantly lower than those of the low-risk score group. Different immune expression characteristics, lead to the different prognosis. Western blot demonstrated that ATG10, PRKCD, and SPP1 were highly expressed in cancer tissues, while IL18RAP and SLC11A1 expression in cancer tissues was lower. In addition, IL18RAP has a highly positive correlation with B cell, macrophage, Neutrophil, Dendritic cell, CD8 cell, and CD4 cell. The SPP1, PRKCD, and SLC11A1 genes have the strongest correlation with macrophages. The expression of ATG10, IL18RAP, PRKCD, SLC11A1, and SPP1 genes varies among different immune subtypes and between different T stages. Conclusion: The 5-immu-gene signature constructed in this study could be utilized as a new prognostic marker for patients with HCC.
Keywords: HCC; immune gene signatures; pan-cancer; prognosis; tumor immune infiltration cell.
Copyright © 2021 Xu, Wang, Wu, Zhang, Liu, Chen and Zheng.
Conflict of interest statement
The authors declare that the research was conducted in the absence of any commercial or financial relationships that could be construed as a potential conflict of interest.
Figures
Similar articles
-
Immune landscape of hepatocellular carcinoma tumor microenvironment identifies a prognostic relevant model.Heliyon. 2024 Jan 24;10(3):e24861. doi: 10.1016/j.heliyon.2024.e24861. eCollection 2024 Feb 15. Heliyon. 2024. PMID: 38317886 Free PMC article.
-
Identification and Validation of a Tumor Microenvironment-Related Gene Signature in Hepatocellular Carcinoma Prognosis.Front Genet. 2021 Nov 26;12:717319. doi: 10.3389/fgene.2021.717319. eCollection 2021. Front Genet. 2021. PMID: 34899826 Free PMC article.
-
Identification and Analysis of Immune-Related Gene Signature in Hepatocellular Carcinoma.Genes (Basel). 2022 Oct 11;13(10):1834. doi: 10.3390/genes13101834. Genes (Basel). 2022. PMID: 36292719 Free PMC article.
-
Identification of molecular subtypes and prognostic signatures based on transient receptor potential channel-related genes to predict the prognostic risk of hepatocellular carcinoma: A review.Medicine (Baltimore). 2023 Mar 10;102(10):e33228. doi: 10.1097/MD.0000000000033228. Medicine (Baltimore). 2023. PMID: 36897679 Free PMC article. Review.
-
Immune gene signatures as prognostic criteria for cancer patients.Ther Adv Med Oncol. 2023 Aug 2;15:17588359231189436. doi: 10.1177/17588359231189436. eCollection 2023. Ther Adv Med Oncol. 2023. PMID: 37547445 Free PMC article. Review.
Cited by
-
Molecular Subtyping of Hepatocellular Carcinoma via Lysosome-Related Genes for Prognosis and Therapy Prediction.Int J Gen Med. 2025 Jul 16;18:3933-3950. doi: 10.2147/IJGM.S490019. eCollection 2025. Int J Gen Med. 2025. PMID: 40692584 Free PMC article.
-
Integrated Machine Learning and Bioinformatic Analyses Constructed a Novel Stemness-Related Classifier to Predict Prognosis and Immunotherapy Responses for Hepatocellular Carcinoma Patients.Int J Biol Sci. 2022 Jan 1;18(1):360-373. doi: 10.7150/ijbs.66913. eCollection 2022. Int J Biol Sci. 2022. PMID: 34975338 Free PMC article.
-
The solute carrier family 11 transporters: a bridge between iron homeostasis and tumor biology.Cell Commun Signal. 2025 Jul 10;23(1):332. doi: 10.1186/s12964-025-02293-x. Cell Commun Signal. 2025. PMID: 40640903 Free PMC article. Review.
-
Construction and validation of a prognostic and therapeutic cuproptosis- and immune-related gene signature in hepatocellular carcinoma.Transl Cancer Res. 2024 Jun 30;13(6):2629-2646. doi: 10.21037/tcr-23-2182. Epub 2024 Jun 27. Transl Cancer Res. 2024. PMID: 38988938 Free PMC article.
References
-
- Chen R. X., Xia Y. H., Cui J. F., Xue T. C., Ye S. L. (2010). Osteopontin, a single marker for predicting the prognosis of patients with tumor-node-metastasis stage I hepatocellular carcinoma after surgical resection. J. Gastroenterol. Hepatol. 25 1435–1442. 10.1111/j.1440-1746.2010.06277.x - DOI - PubMed
LinkOut - more resources
Full Text Sources
Research Materials
Miscellaneous