A KDM4-DBC1-SIRT1 Axis Contributes to TGF-b Induced Mesenchymal Transition of Intestinal Epithelial Cells
- PMID: 34631698
- PMCID: PMC8493255
- DOI: 10.3389/fcell.2021.697614
A KDM4-DBC1-SIRT1 Axis Contributes to TGF-b Induced Mesenchymal Transition of Intestinal Epithelial Cells
Abstract
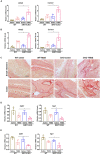
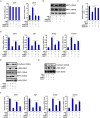
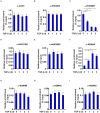
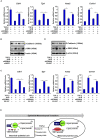
Intestinal fibrosis is one of the common pathophysiological processes in inflammatory bowel diseases (IBDs). Previously it has been demonstrated that epithelial-mesenchymal transition (EMT) can contribute to the development of intestinal fibrosis. Here we report that conditional ablation of SIRT1, a class III lysine deacetylase, in intestinal epithelial cells exacerbated 2, 4, 6-trinitro-benzene sulfonic acid (TNBS) induced intestinal fibrosis in mice. SIRT1 activity, but not SIRT1 expression, was down-regulated during EMT likely due to up-regulation of its inhibitor deleted in breast cancer 1 (DBC1). TGF-β augmented the recruitment of KDM4A, a histone H3K9 demethylase, to the DBC1 promoter in cultured intestinal epithelial cells (IEC-6) leading to DBC1 trans-activation. KDM4A depletion or inhibition abrogated DBC1 induction by TGF-β and normalized SIRT1 activity. In addition, KDM4A deficiency attenuated TGF-β induced EMT in IEC-6 cells. In conclusion, our data identify a KDM4-DBC1-SIRT1 pathway that regulates EMT to contribute to intestinal fibrosis.
Keywords: SIRT1; epigenetics; epithelial-mesenchymal transition; histone demethylase; intestinal fibrosis; transcriptional regulation.
Copyright © 2021 Chen, Dong, Shao, Miao, Guo, Liu and Feng.
Conflict of interest statement
The authors declare that the research was conducted in the absence of any commercial or financial relationships that could be construed as a potential conflict of interest.
Figures


Similar articles
-
miR-133b and miR-199b knockdown attenuate TGF-β1-induced epithelial to mesenchymal transition and renal fibrosis by targeting SIRT1 in diabetic nephropathy.Eur J Pharmacol. 2018 Oct 15;837:96-104. doi: 10.1016/j.ejphar.2018.08.022. Epub 2018 Aug 17. Eur J Pharmacol. 2018. PMID: 30125566
-
Salvianolic acid B attenuates epithelial-mesenchymal transition in renal fibrosis rats through activating Sirt1-mediated autophagy.Biomed Pharmacother. 2020 Aug;128:110241. doi: 10.1016/j.biopha.2020.110241. Epub 2020 May 22. Biomed Pharmacother. 2020. PMID: 32450523
-
Celecoxib and sulindac inhibit TGF-β1-induced epithelial-mesenchymal transition and suppress lung cancer migration and invasion via downregulation of sirtuin 1.Oncotarget. 2016 Aug 30;7(35):57213-57227. doi: 10.18632/oncotarget.11127. Oncotarget. 2016. PMID: 27528025 Free PMC article.
-
Total flavone of Abelmoschus manihot suppresses epithelial-mesenchymal transition via interfering transforming growth factor-β1 signaling in Crohn's disease intestinal fibrosis.World J Gastroenterol. 2018 Aug 14;24(30):3414-3425. doi: 10.3748/wjg.v24.i30.3414. World J Gastroenterol. 2018. PMID: 30122880 Free PMC article.
-
Narrower insight to SIRT1 role in cancer: A potential therapeutic target to control epithelial-mesenchymal transition in cancer cells.J Cell Physiol. 2018 Jun;233(6):4443-4457. doi: 10.1002/jcp.26302. Epub 2018 Jan 15. J Cell Physiol. 2018. PMID: 29194618 Review.
Cited by
-
Hypoxia-induced proteasomal degradation of DBC1 by SIAH2 in breast cancer progression.Elife. 2022 Aug 1;11:e81247. doi: 10.7554/eLife.81247. Elife. 2022. PMID: 35913115 Free PMC article.
-
HES5-mediated repression of LIGHT transcription may contribute to apoptosis in hepatocytes.Cell Death Discov. 2021 Oct 23;7(1):308. doi: 10.1038/s41420-021-00707-6. Cell Death Discov. 2021. PMID: 34689159 Free PMC article.
-
Zinc finger transcription factor Egf1 promotes non-alcoholic fatty liver disease.JHEP Rep. 2023 Mar 9;5(6):100724. doi: 10.1016/j.jhepr.2023.100724. eCollection 2023 Jun. JHEP Rep. 2023. PMID: 37234276 Free PMC article.
-
Role of the epithelial barrier in intestinal fibrosis associated with inflammatory bowel disease: relevance of the epithelial-to mesenchymal transition.Front Cell Dev Biol. 2023 Sep 26;11:1258843. doi: 10.3389/fcell.2023.1258843. eCollection 2023. Front Cell Dev Biol. 2023. PMID: 37822869 Free PMC article. Review.
References
LinkOut - more resources
Full Text Sources
Molecular Biology Databases
Research Materials

