. 2021 Sep 23:9:703969.
doi: 10.3389/fcell.2021.703969. eCollection 2021.

A Risk Score Model Incorporating Three m6A RNA Methylation Regulators and a Related Network of miRNAs-m6A Regulators-m6A Target Genes to Predict the Prognosis of Patients With Ovarian Cancer

Affiliations

A Risk Score Model Incorporating Three m6A RNA Methylation Regulators and a Related Network of miRNAs-m6A Regulators-m6A Target Genes to Predict the Prognosis of Patients With Ovarian Cancer

Qian Li et al. Front Cell Dev Biol. .

Abstract

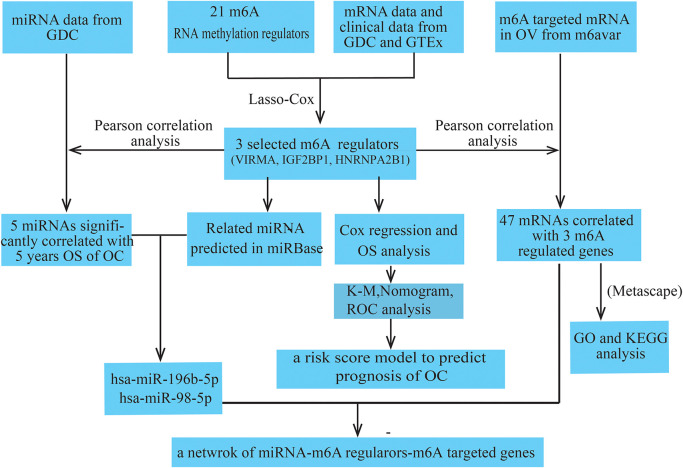
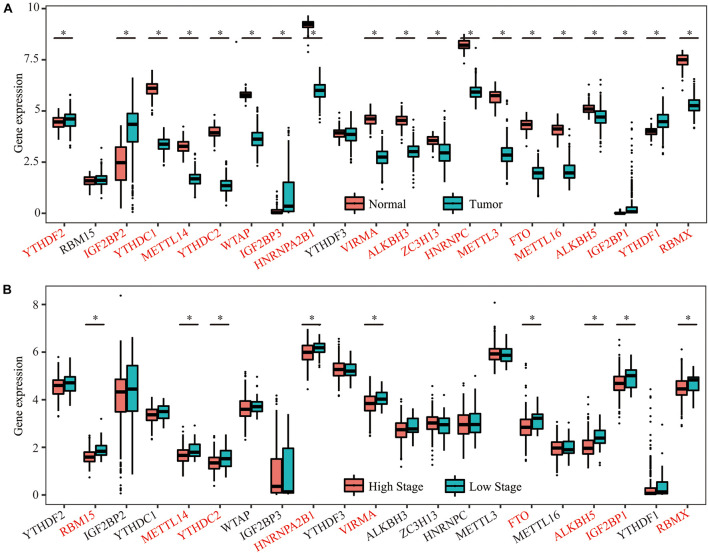
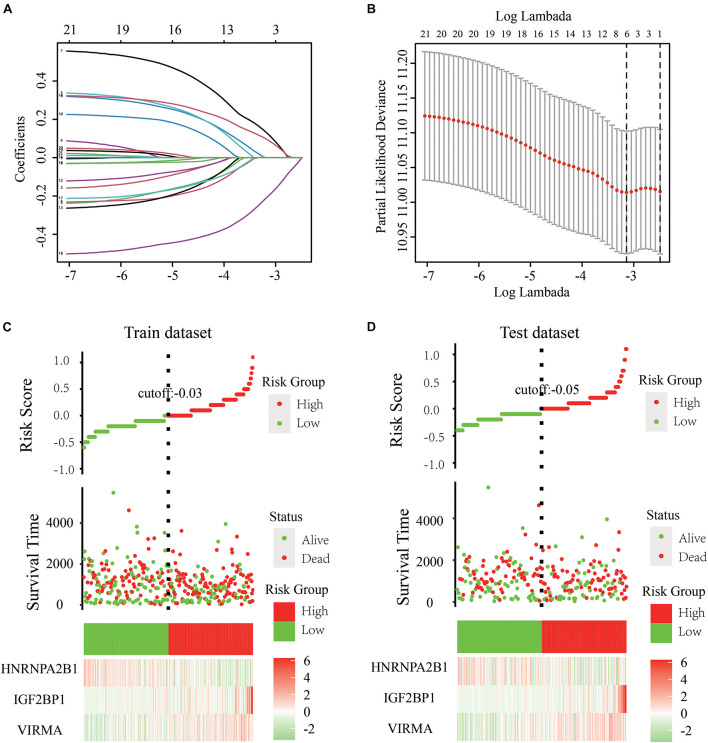
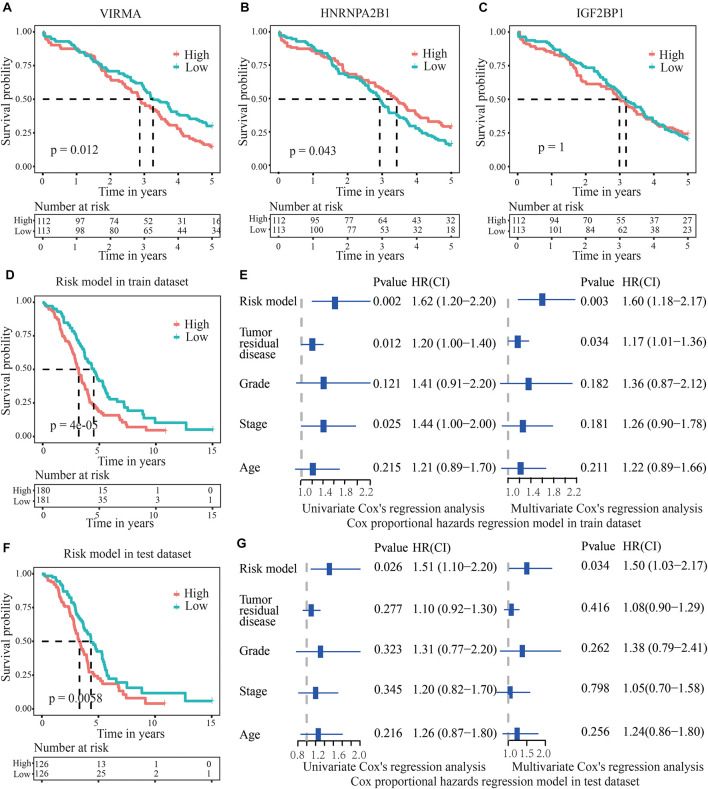
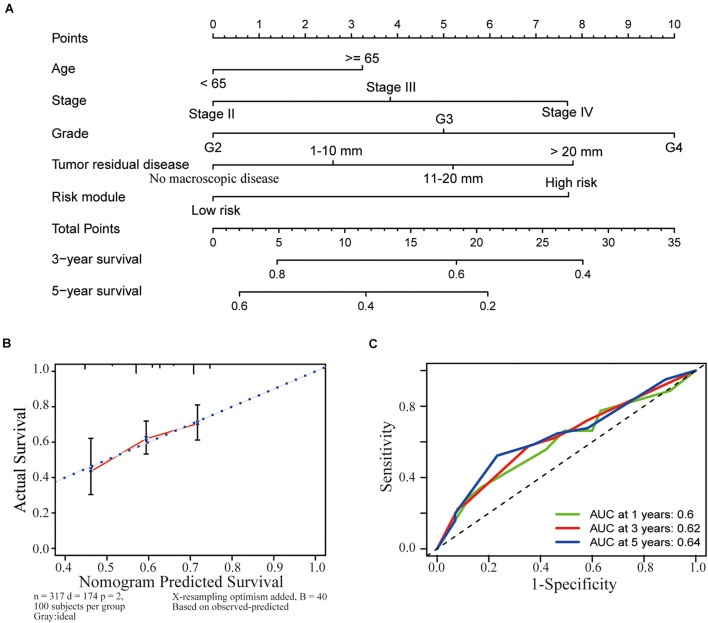
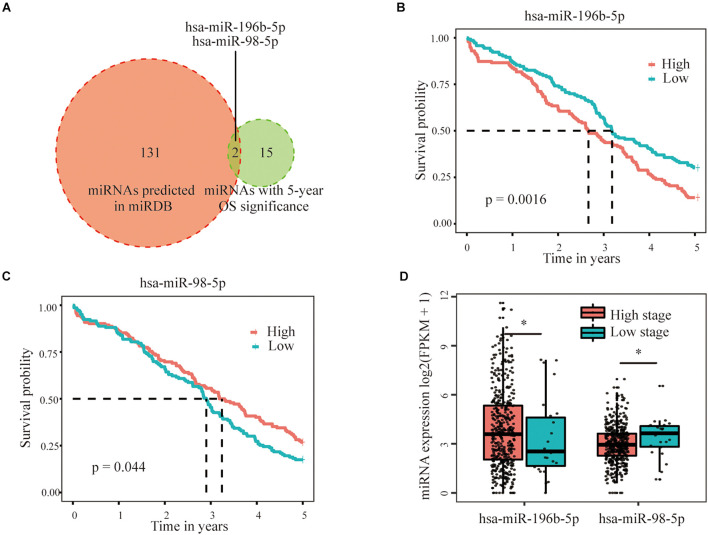
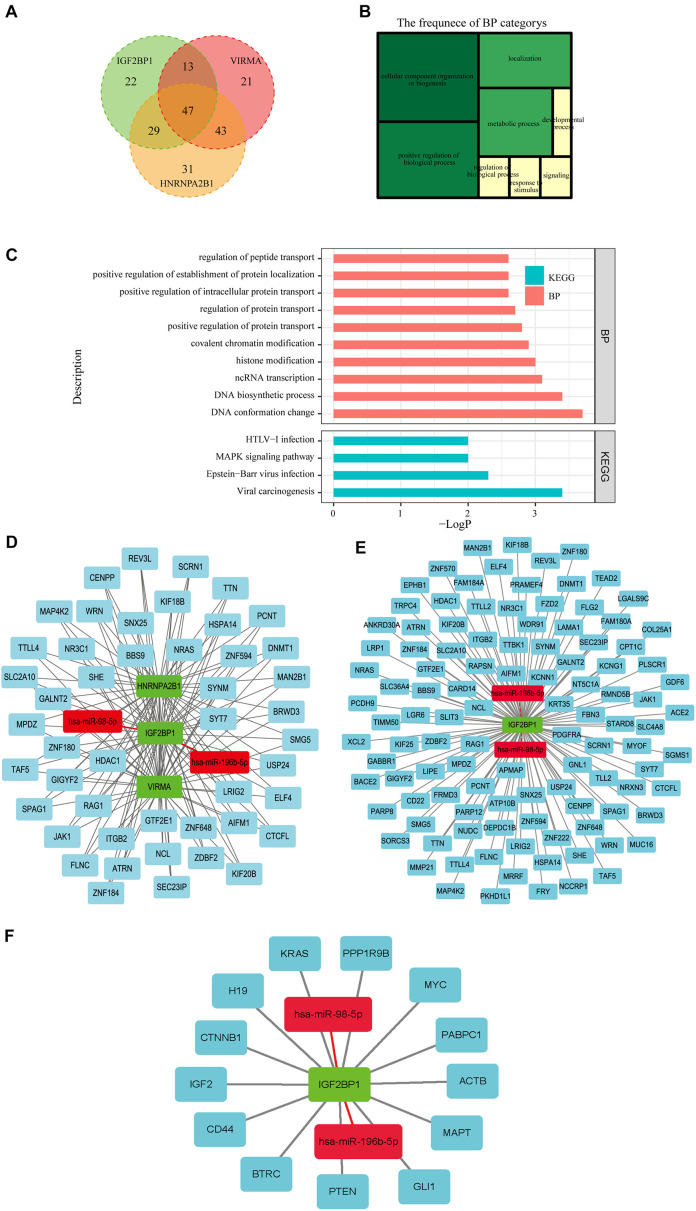
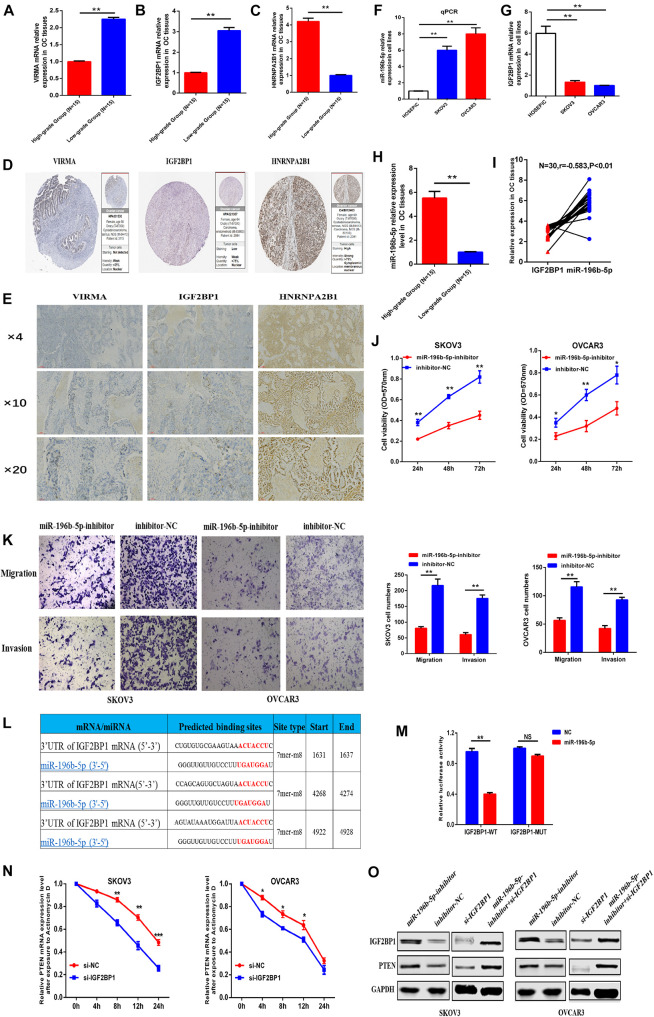
Ovarian cancer (OC) is the leading cause of cancer-related death among all gynecological tumors. N6-methyladenosine (m6A)-related regulators play essential roles in various tumors, including OC. However, the expression of m6A RNA methylation regulators and the related regulatory network in OC and their correlations with prognosis remain largely unknown. In the current study, we obtained the genome datasets of OC from GDC and GTEx database and analyzed the mRNA levels of 21 key m6A regulators in OC and normal human ovarian tissues. The expression levels of 7 m6A regulators were lower in both the OC tissues and the high-stage group. Notably, the 5-year survival rate of patients with OC presenting low VIRMA expression or high HNRNPA2B1 expression was higher than that of the controls. Next, a risk score model based on the three selected m6A regulators (VIRMA, IGF2BP1, and HNRNPA2B1) was built by performing a LASSO regression analysis, and the moderate accuracy of the risk score model to predict the prognosis of patients with OC was examined by performing ROC curve, nomogram, and univariate and multivariate Cox regression analyses. In addition, a regulatory network of miRNAs-m6A regulators-m6A target genes, including 2 miRNAs, 3 m6A regulators, and 47 mRNAs, was constructed, and one of the pathways, namely, miR-196b-5p-IGF2BP1-PTEN, was initially validated based on bioinformatic analysis and assay verification. These results demonstrated that the risk score model composed of three m6A RNA methylation regulators and the related network of miRNAs-m6A regulators-m6A target genes is valuable for predicting the prognosis of patients with OC, and these molecules may serve as potential biomarkers or therapeutic targets in the future.

Keywords: RNA methylation; m6A; ovarian cancer; prognosis; risk model.


Conflict of interest statement

The authors declare that the research was conducted in the absence of any commercial or financial relationships that could be construed as a potential conflict of interest.

Figures

FIGURE 1
FIGURE 1
Workflow and analysis strategy used in the current study.
FIGURE 2
FIGURE 2
Expression of 21 m6A RNA methylation regulators in OC tissues and normal human ovarian tissues. (A) Five m6A regulators (YTHDF1, YTHDF2, IGF2BP1, IGF2BP2, and IGF2BP3) were upregulated, and 14 m6A regulators (METTL3, METTL14, METTL16, ZC3H13, WTAP, VIRMA, RBMX, YTHDC1, YTHDC2, HNRNPC, HNRNPA2B1, FTO, ALKBH3, and ALKBH5) were downregulated in the OC tissues compared with the control tissues. (B) Nine of the 21 m6A regulators (METTL14, YTHDC2, FTO, ALKBH5, HNRNPA2B1, VIRMA, IGF2BP1, RBM15, and RBMX) were significantly differentially expressed in the two groups, and all of them were downregulated in the high-stage group compared with the low-stage group *P < 0.05.
FIGURE 3
FIGURE 3
Development of a risk signature consisting of three m6A RNA methylation regulators to predict the prognosis of patients with OC. (A,B) LASSO Cox regression algorithm for the 21 regulators in the GDC dataset and obtained risk scores based on three m6A regulators (VIRMA, IGF2BP1, and HNRNPA2B1) as variables. (C) Using the median risk score (–0.03) as the cutoff point, all the 361 patients in the train dataset were divided into two groups, namely, the high-risk group and the low-risk group. (D) Using the median risk score (–0.05) as the cutoff point, 252 patients in the test dataset were also divided into two groups as previously described. A KM survival analysis was subsequently performed to evaluate the effectiveness of the three selected m6A regulators and to construct a risk model for the survival rate of patients with OC both in the train and test dataset.
FIGURE 4
FIGURE 4
Validation of the accuracy of the risk score model to predict the prognosis of patients with OC. (A,B) The survival time of OC patients with 50% survival rate presenting low VIRMA expression or high HNRNPA2B1 expression was longer than that of the controls. (C) IGF2BP1 expression was not related to the 5-year survival rate of patients with OC. (D) In the train dataset, the survival time of OC patients with 50% survival rate in the low-risk group were obviously longer than those of patients in the high-risk group. (E) Univariate and multivariate analyses of patients with OC were executed to appraise whether clinicopathological characteristics were independent prognostic factors of patient outcomes. The univariate analysis indicated that the risk score model, stage and tumor residual disease were all independent factors predicting a poor prognosis for patients with OC. (F) In the test dataset, the survival time of OC patients with 50% survival rate in the low-risk group were also longer than those of patients in the high-risk group. (G) In the test dataset, the univariate analysis demonstrated that the risk model was also an independent factor predicting a poor prognosis for OC patients, which is consistent with the results from the train dataset.
FIGURE 5
FIGURE 5
Establishment of a nomogram based on clinicopathological characteristics, including the risk model. (A) A nomogram was established to identify the relationship between the survival time and clinicopathological characteristics (including age, stage, grade, residual tumor disease, and risk model). The survival probability of patients with OC at 3 and 5 years was estimated by calculating the total points corresponding to the nomogram. (B) The nomogram had favorable predictive power for the 3-year and 5-year survival of patients with OC. (C) A ROC curve analysis was conducted to determine the accuracy of the prediction obtained from the risk score model. The calculation of the area under the curve (AUC) was 0.6 for 1 year, 0.62 for 3 years, and 0.64 for 5 years.
FIGURE 6
FIGURE 6
Predicted miRNAs targeted the three selected m6A RNA methylation regulators. (A) Two miRNAs, namely, hsa-miR-196b-5p and hsa-miR-98-5p, with potential binding sites in the IGF2BP1 sequence that were significantly related to the prognosis of patients with OC were selected based on miRbase and survival relationships. (B) Patients with OC presenting high hsa-miR-196b-5p expression showed an obviously decreased survival rate compared with those with low hsa-miR-196b-5p expression, indicating its oncogenic role in OC. (C) Patients with OC presenting high hsa-miR-98-5p expression showed an increased survival rate compared with those with low hsa-miR-98-5p expression, suggesting its potential tumor-suppressive function in OC. (D) The expression of hsa-miR-196b-5p was increased, but hsa-miR-98-5p expression was decreased in the high-stage group compared with the low-stage group *P < 0.05.
FIGURE 7
FIGURE 7
Construction of a network of miRNAs-m6A regulators-m6A target genes. (A) Forty-seven m6A target genes potentially coregulated by the three m6A regulators (VIRMA, IGF2BP1, and HNRNPA2B1) were obtained from m6Avar, an updated database of functional variants involved in RNA modifications. (B,C) The GO analysis showed that the biological processes of the 47 genes were mainly enriched in cellular components organization and biogenesis, and positively regulated biological processes such as protein transport and localization. The KEGG pathway analysis indicated that these genes were mainly enriched in viral carcinogenesis and the MAPK signaling pathway. (D) A regulatory network of miRNAs-m6A regulators-m6A target genes was constructed, which was composed of two miRNAs, three m6A regulators, and forty-seven mRNAs. (E) A regulatory network composed of two miRNAs, IGF2BP1, and110 m6A target genes was constructed. (F) A regulatory network of two miRNAs, IGF2BP1, and 10 target genes that has been reported previously.
FIGURE 8
FIGURE 8
One of the miRNA-m6A regulator-m6A targeted gene pathways was chosen for preliminary verification. (A–C) mRNA expression of VIRMA, IGF2BP1, and HNRNPA2B1 in the high-stage and low-stage OC tissues by PCR. (D) Protein expression of VIRMA, IGF2BP1, and HNRNPA2B1 in OC tissues by IHC. (E) Protein expression of VIRMA, IGF2BP1, and HNRNPA2B1 in OC tissues from public database of The Human Protein Atlas. (F,G) miR-196b-5p was upregulated, and IGF2BP1 was downregulated in ovarian cancer cells compared with control cells. (H,I) miR-196b-5p, negatively correlated with IGF2BP1(r = –0.583, P < 0.05), was upregulated in the OC tissues of high-stage group than the controlled. (J) The CCK-8 assay showed that the proliferation of SKOV3 or OVCAR3 cells with decreased miR-196b-5p expression induced by miRNA inhibitor transfection was obviously decreased compared with that of the control group. (K) Transwell assays revealed obvious decreases in the migration and invasion of SKOV3 or OVCAR3 cells with miR-196b-5p knockdown induced by miRNA inhibitor transfection compared with the control group. (L,M) Dual luciferase reporter gene experiments confirmed the predicted binding sites between miR-196b-5p and IGF2BP1. (N) After exposure to Actinomycin D to inhibit the novel mRNA synthesis, the degradation rate of PTEN mRNA was significantly faster in the SKOV3 or OVCAR3 cells transfected with si-IGF2BP1 than that in the cells transfected with si-NC. (O) Downregulation of miR-196b-5p increased the levels of the IGF2BP1 and PTEN proteins. And the protein level of IGF2BP1 and PTEN downregulated by si-IGF2BP1 transfection in the SKOV3 or OVCAR3 cells could be partly relieved by transfection of miR-196b-5p-inhibitor *P < 0.05, **P < 0.01, and ***P < 0.001.

Similar articles

Cited by

References

    1. Alarcón C. R., Goodarzi H., Lee H., Liu X., Tavazoie S., Tavazoie S. F. (2015). HNRNPA2B1 is a mediator of m(6)A-Dependent nuclear RNA processing events. Cell 162 1299–1308. 10.1016/j.cell.2015.08.011 - DOI - PMC - PubMed
    1. Barbieri I. (2020). Role of RNA modifications in cancer. Mol. Cancer 20 303–322. 10.1038/s41568-020-0253-2 - DOI - PubMed
    1. Bi X., Lv X., Liu D., Guo H., Yao G., Wang L., et al. (2021). METTL3-mediated maturation of miR-126-5p promotes ovarian cancer progression via PTEN-mediated PI3K/Akt/mTOR pathway. Cancer Gene Ther. 28 335–349. 10.1038/s41417-020-00222-3 - DOI - PubMed
    1. Bley N., Schott A., Müller S., Misiak D. (2021). IGF2BP1 is a targetable SRC/MAPK-dependent driver of invasive growth in ovarian cancer. RNA Biol. 18 391–403. 10.1080/15476286.2020.1812894 - DOI - PMC - PubMed
    1. Chen X. Y., Zhang J., Zhu J. S. (2019). The role of m(6)A RNA methylation in human cancer. Mol. Cancer 18:103. - PMC - PubMed