. 2021 Sep 23:9:736540.
doi: 10.3389/fcell.2021.736540. eCollection 2021.

Characterization of Molecular Heterogeneity Associated With Tumor Microenvironment in Clear Cell Renal Cell Carcinoma to Aid Immunotherapy

Affiliations

Characterization of Molecular Heterogeneity Associated With Tumor Microenvironment in Clear Cell Renal Cell Carcinoma to Aid Immunotherapy

Weimin Zhong et al. Front Cell Dev Biol. .

Abstract

Clear cell renal cell carcinoma (ccRCC) is the most common type of kidney cancer and has strong immunogenicity. A systematically investigation of the tumor microenvironment (TME) in ccRCC could contribute to help clinicians develop personalized treatment and facilitate clinical decision-making. In this study, we analyzed the immune-related subtype of ccRCC on the basis of immune-related gene expression data in The Cancer Genome Atlas (TCGA, N = 512) and E-MTAB-1980 (N = 101) dataset, respectively. As a result, two subtypes (C1 and C2) were identified by performing non-negative matrix factorization clustering. Subtype C1 was characterized by increased advance ccRCC cases and immune-related pathways. A higher immune score, stromal score, TMB value, Tumor Immune Dysfunction and Exclusion (TIDE) prediction score, and immune checkpoint genes expression level were also observed in C1. In addition, the C1 subtype might benefit from chemotherapy and immunotherapy. The patients in subtype C2 had more metabolism-related pathways, higher tumor purity, and a better prognosis. Moreover, some small molecular compounds for the treatment of ccRCC were identified between the two subtypes by using the Connectivity Map (CMap) database. Finally, we constructed and validated an immune-related (IR) score to evaluate immune modification individually. A high IR score corresponded to a favorable prognosis compared to a low IR score, while more advanced tumor stage and grade cases were enriched in the low IR score group. The two IR score groups also showed a distinct divergence among immune status, TME, and chemotherapy. The external validation dataset (E-MTAB-1980) and another immunotherapy cohort (IMvigor 210) demonstrated that patients in the high IR score group had a significantly prolonged survival time and clinical benefits compared to the low IR score group. Together, characterization of molecular heterogeneity and IR signature may help develop new insights into the TME of ccRCC and provide new strategies for personalized treatment.

Keywords: IR score; chemo drugs; clear cell renal cell carcinoma; immune checkpoint blockade; immunotherapy; molecular subtype; tumor microenvironment.


Conflict of interest statement

The authors declare that the research was conducted in the absence of any commercial or financial relationships that could be construed as a potential conflict of interest.

Figures

FIGURE 1
FIGURE 1
Non-negative matrix factorization clustering analysis to identify potential molecular subtypes of ccRCC based on the immune-related gene expression in TCGA dataset. (A) The cophenetic correlation coefficient for the cluster number from 2 to 7. (B) Consensus matrix heatmap when k = 2. (C) Principal component analysis (PCA) for the 512 ccRCC patients, each dot represents a single sample. (D) KM survival curve analysis for the overall survival of the two subtypes in ccRCC.
FIGURE 2
FIGURE 2
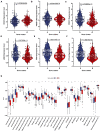
The landscape of immune cell infiltration in the two subtypes. (A) Twenty-eight immune cells’ infiltration levels that were calculated by the ssGSEA algorithm in the two subtypes. The comparisons of stromal score (B), immune score (C) and tumor purity (D) between the two subtypes. ns: not significant, *P < 0.05, **P < 0.01, ***P < 0.001.
FIGURE 3
FIGURE 3
Evaluation of the immunotherapeutic response of the two subtypes in ccRCC. (A–F) The expression level of six immune checkpoint inhibitors including CD274 (PD-L1), PDCD1LG2 (PD-L2), PDCD1 (PD-1), LAG3, TIGIT, and CTLA-4 in the two molecular subtypes. (G) The comparisons of TMB value between the two subtypes. (H) The Tumor Immune Dysfunction and Exclusion (TIDE) prediction score of the two subtypes.
FIGURE 4
FIGURE 4
The IC50 values of four chemo drugs in the two molecular subtypes of ccRCC including Axitinib (A), Pazopanib (B), Sorafenib (C), and Sunitinib (D).
FIGURE 5
FIGURE 5
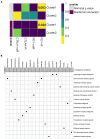
Evaluation of potential compounds and immunotherapy response to the two subtypes. (A) Submap analysis demonstrated that cluster 1 had more sensitivity to the programmed cell death protein 1 inhibitor (Bonferroni-corrected, P = 0.024). (B) CMap database analysis identified candidate drugs targeting the two molecular subtypes based on the DEGs.
FIGURE 6
FIGURE 6
GO (A) and KEGG (B) enrichment analysis was performed to identify potential function and pathway of DEGs.
FIGURE 7
FIGURE 7
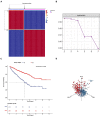
The non-negative matrix factorization (NMF) clustering analysis to identify the genomic subtype of ccRCC based on the 274 DEGs. (A) Consensus matrix heatmap when k = 2. (B) The cophenetic correlation coefficient for the cluster number from 2 to 7. (C) KM survival curve analysis for the overall survival of the two subtypes in ccRCC. (D) Principal component analysis (PCA) for the 512 ccRCC patients, each dot represents a single sample.
FIGURE 8
FIGURE 8
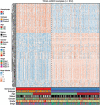
The NMF clustering of DEGs in TCGA cohorts to categorize patients into two genomic subtypes (A and B). The gene clusters, immune-related subtype, tumor stage, age, survival status, gender, grade, and age were termed as patient annotations.
FIGURE 9
FIGURE 9
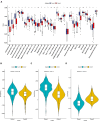
The evaluation of the immune checkpoint and immune cell infiltration in the two genomic clusters. The expression level of six immune checkpoint including CD274 (A), PDCD1LG2 (B), PDCD1 (C), LAG3 (D), TIGIT (E), CTLA4 (F) were showed in the two genomic clusters. (G) Twenty eight immune cells infiltration level were compared in the two genomic clusters. ns: not significant, *P < 0.05, **P < 0.01, ***P < 0.001.
FIGURE 10
FIGURE 10
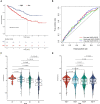
Construction of immune-related (IR) score via principal component analysis. (A) Kaplan–Meier curves for patients with high and low IR score subgroups in TCGA cohort. (B) The receiver operator curve analysis for the IR score. The relationship between IR score and tumor grade (C) and stage (D).
FIGURE 11
FIGURE 11
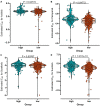
The IC50 values of four chemo drugs in the IR score group of ccRCC including Axitinib (A), Pazopanib (B), Sorafenib (C), and Sunitinib (D).
FIGURE 12
FIGURE 12
Validation of the prognostic value of IR in disease-free survival (A), disease-special survival (B), and progression-free survival (C) of ccRCC, E-MTAB-1980 dataset (D), and IMvigor210 cohort (E), respectively. (F) The proportion of patients with response to PD-L1 blockade immunotherapy in low or high IR score groups. Responder/non-responder: 10%/90% in the low IR score groups and 25%/75% in the high IR score groups.

Similar articles

Cited by

References

    1. Ahmad A., Finelli A. (2019). Renal function outcomes following radical or partial nephrectomy for localized renal cell carcinoma: should urologists rely on preoperative variables to predict renal function in the long term? Eur. Urol. 75 773–774. 10.1016/j.eururo.2018.12.027 - DOI - PubMed
    1. Baig M. A., Lin Y. S., Rasheed J., Mittman N. (2006). Renal medullary carcinoma. J. Natl. Med. Assoc. 98 1171–1174. - PMC - PubMed
    1. Bhattacharya S., Dunn P., Thomas C., Smith B., Schaefer H., Chen J., et al. (2018). ImmPort, toward repurposing of open access immunological assay data for translational and clinical research. Sci. Data 5:180015. 10.1038/sdata.2018.15 - DOI - PMC - PubMed
    1. Buchler T., Bortlicek Z., Poprach A., Pavlík T., Veskrnova V., Honzirkova M., et al. (2015). Outcomes for patients with metastatic renal cell carcinoma achieving a complete response on targeted therapy: a registry-based analysis. Eur. Urol. 70 469–475. 10.1016/j.eururo.2015.12.031 - DOI - PubMed
    1. Cai C., Xu Y.-F., Wu Z.-J., Dong Q., Li M-y, Olson J., et al. (2015). Tim-3 expression represents dysfunctional tumor infiltrating T cells in renal cell carcinoma. World J. Urol. 34 561–567. 10.1007/s00345-015-1656-1657 - DOI - PubMed