

Integrative Predictive Modeling of Metastasis in Melanoma Cancer Based on MicroRNA, mRNA, and DNA Methylation Data
- PMID: 34631789
- PMCID: PMC8495312
- DOI: 10.3389/fmolb.2021.637355
Integrative Predictive Modeling of Metastasis in Melanoma Cancer Based on MicroRNA, mRNA, and DNA Methylation Data
Abstract
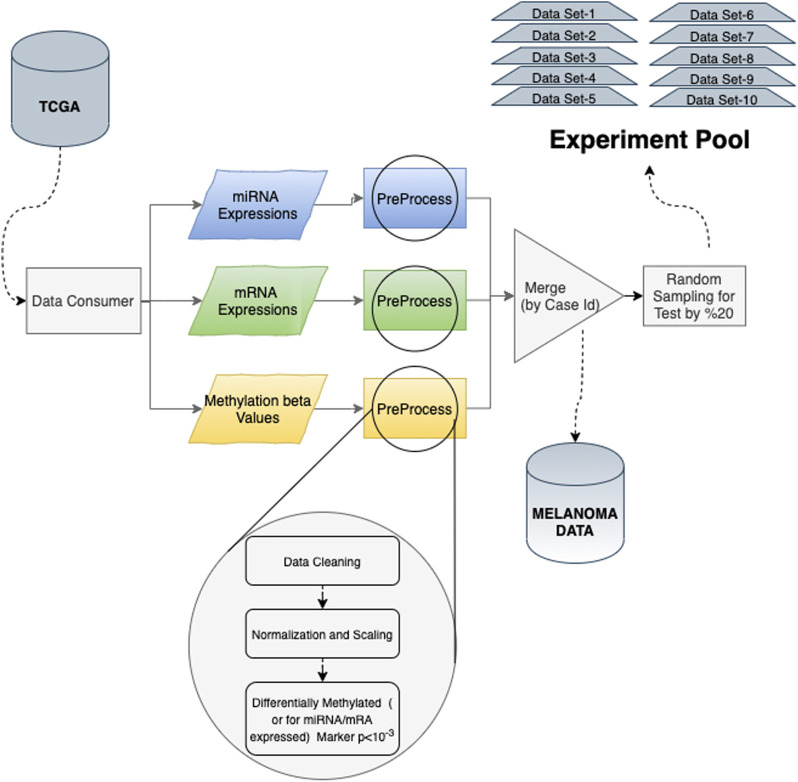
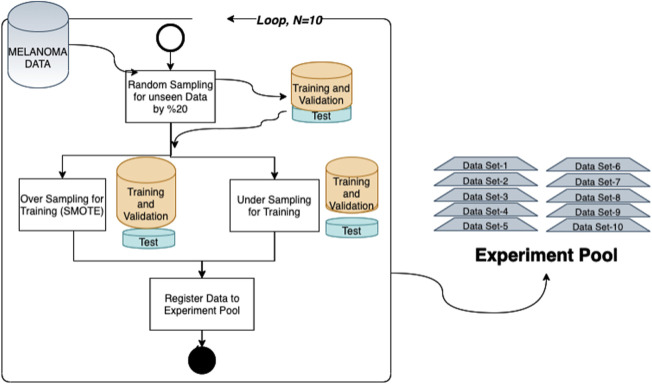
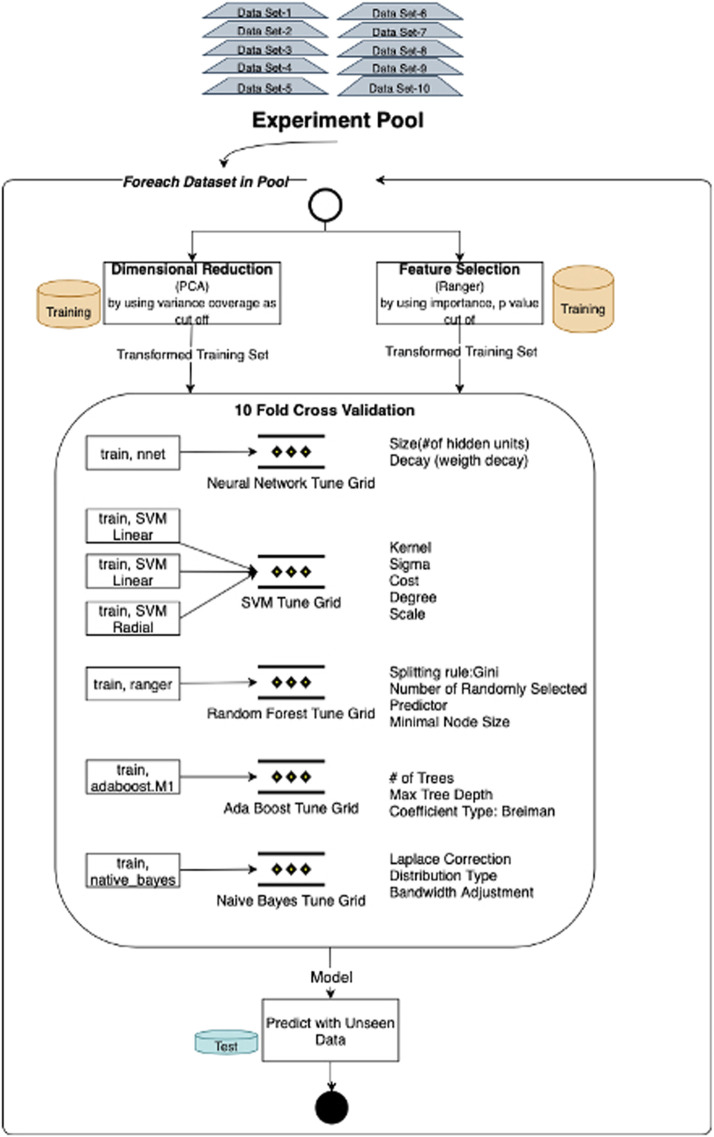
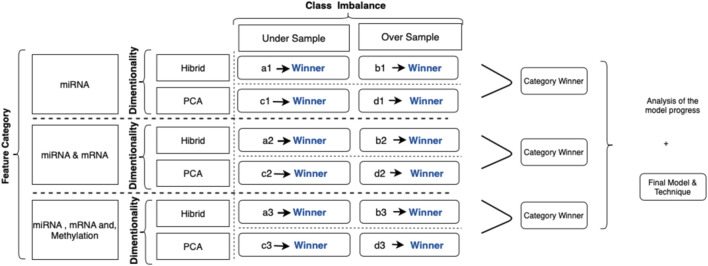
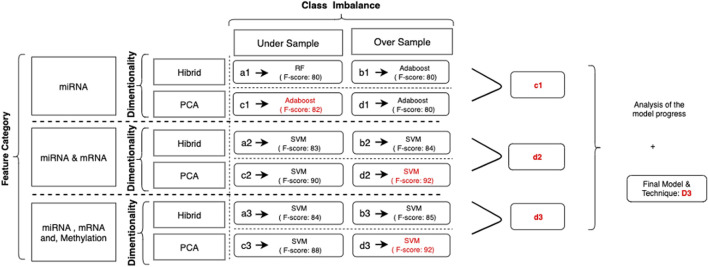
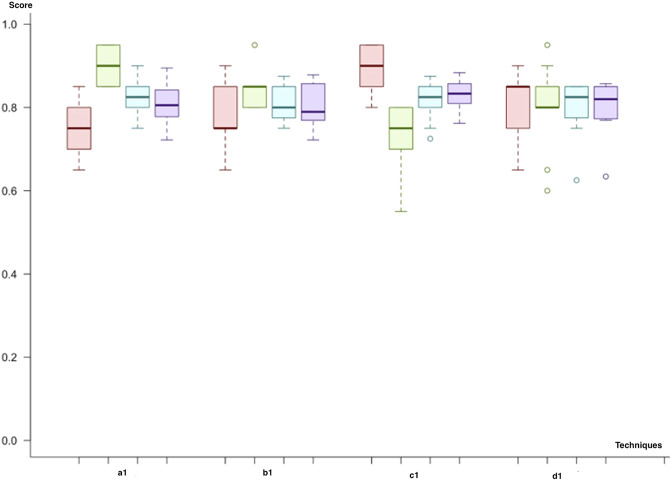
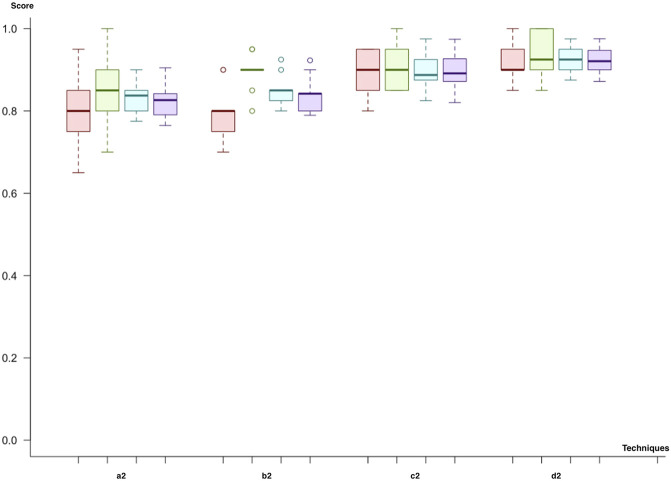
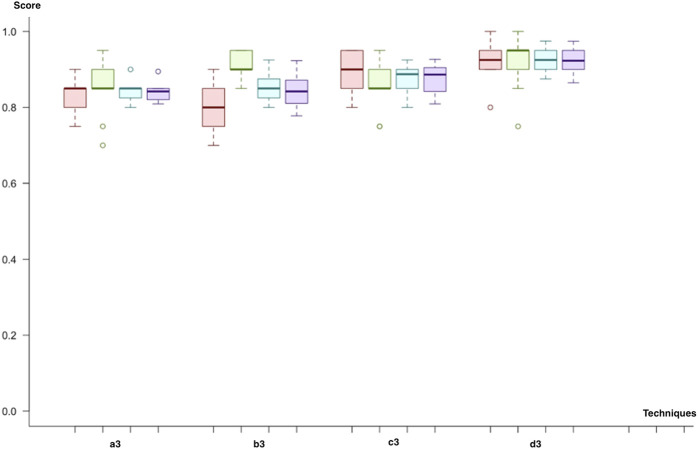
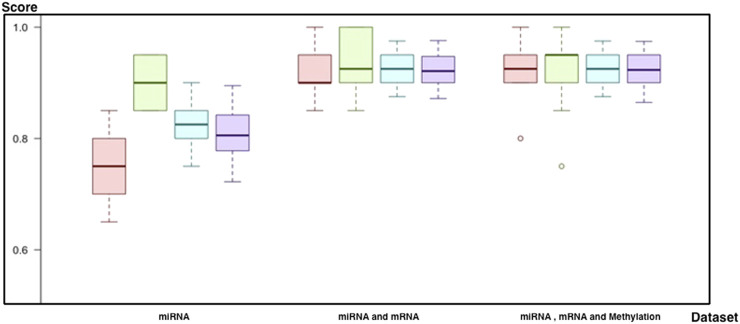
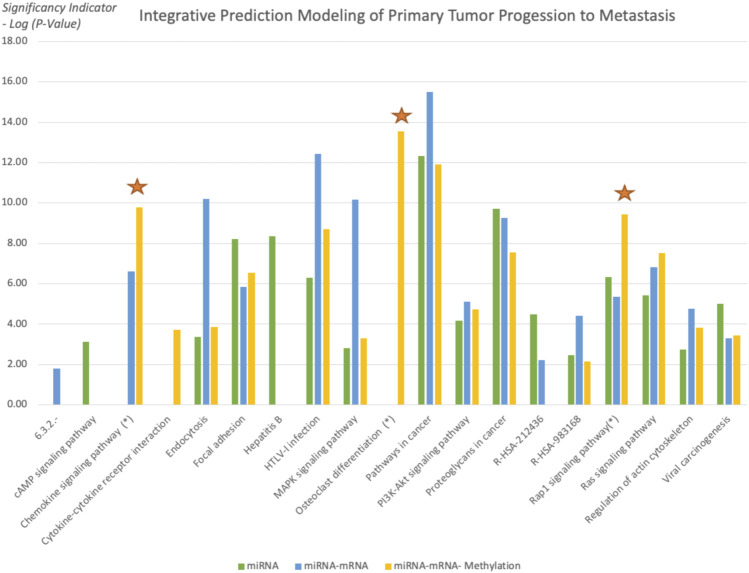
Introduction: Despite the significant progress in understanding cancer biology, the deduction of metastasis is still a challenge in the clinic. Transcriptional regulation is one of the critical mechanisms underlying cancer development. Even though mRNA, microRNA, and DNA methylation mechanisms have a crucial impact on the metastatic outcome, there are no comprehensive data mining models that combine all transcriptional regulation aspects for metastasis prediction. This study focused on identifying the regulatory impact of genetic biomarkers for monitoring metastatic molecular signatures of melanoma by investigating the consolidated effect of miRNA, mRNA, and DNA methylation. Method: We developed multiple machine learning models to distinguish the metastasis by integrating miRNA, mRNA, and DNA methylation markers. We used the TCGA melanoma dataset to differentiate between metastatic melanoma samples by assessing a set of predictive models. For this purpose, machine learning models using a support vector machine with different kernels, artificial neural networks, random forests, AdaBoost, and Naïve Bayes are compared. An iterative combination of differentially expressed miRNA, mRNA, and methylation signatures is used as a candidate marker to reveal each new biomarker category's impact. In each iteration, the performances of the combined models are calculated. During all comparisons, the choice of the feature selection method and under and oversampling approaches are analyzed. Selected biomarkers of the highest performing models are further analyzed for the biological interpretation of functional enrichment. Results: In the initial model, miRNA biomarkers can identify metastatic melanoma with an 81% F-score. The addition of mRNA markers upon miRNA increased the F-score to 92%. In the final integrated model, the addition of the methylation data resulted in a similar F-score of 92% but produced a stable model with low variance across multiple trials. Conclusion: Our results support the role of miRNA regulation in metastatic melanoma as miRNA markers model metastasis outcomes with high accuracy. Moreover, the integrated evaluation of miRNA with mRNA and methylation biomarkers increases the model's power. It populates selected biomarkers on the metastasis-associated pathways of melanoma, such as the "osteoclast", "Rap1 signaling", and "chemokine signaling" pathways. Source Code: https://github.com/aysegul-kt/MelonomaMetastasisPrediction/.
Keywords: DNA methylation; mRNA; machine learning; melanoma; metastasis; metastatic molecular signatures; miRNA.
Copyright © 2021 Kutlay and Aydin Son.
Conflict of interest statement
The authors declare that the research was conducted in the absence of any commercial or financial relationships that could be construed as a potential conflict of interest.
Figures
Similar articles
-
Comprehensive analysis of tumor necrosis factor receptor TNFRSF9 (4-1BB) DNA methylation with regard to molecular and clinicopathological features, immune infiltrates, and response prediction to immunotherapy in melanoma.EBioMedicine. 2020 Feb;52:102647. doi: 10.1016/j.ebiom.2020.102647. Epub 2020 Feb 3. EBioMedicine. 2020. PMID: 32028068 Free PMC article.
-
Integrative Analysis of Long Noncoding RNA (lncRNA), microRNA (miRNA) and mRNA Expression and Construction of a Competing Endogenous RNA (ceRNA) Network in Metastatic Melanoma.Med Sci Monit. 2019 Apr 20;25:2896-2907. doi: 10.12659/MSM.913881. Med Sci Monit. 2019. PMID: 31004080 Free PMC article.
-
miRcorrNet: machine learning-based integration of miRNA and mRNA expression profiles, combined with feature grouping and ranking.PeerJ. 2021 May 19;9:e11458. doi: 10.7717/peerj.11458. eCollection 2021. PeerJ. 2021. PMID: 34055490 Free PMC article.
-
Identification, Review, and Systematic Cross-Validation of microRNA Prognostic Signatures in Metastatic Melanoma.J Invest Dermatol. 2016 Jan;136(1):245-254. doi: 10.1038/JID.2015.355. J Invest Dermatol. 2016. PMID: 26763444 Review.
-
Aberrant miRNA promoter methylation and EMT-involving miRNAs in breast cancer metastasis: Diagnosis and therapeutic implications.J Cell Physiol. 2018 May;233(5):3729-3744. doi: 10.1002/jcp.26116. Epub 2017 Sep 7. J Cell Physiol. 2018. PMID: 28771724 Review.
Cited by
-
Critical Considerations for Investigating MicroRNAs during Tumorigenesis: A Case Study in Conceptual and Contextual Nuances of miR-211-5p in Melanoma.Epigenomes. 2023 Apr 26;7(2):9. doi: 10.3390/epigenomes7020009. Epigenomes. 2023. PMID: 37218870 Free PMC article. Review.
-
Advances in applications of artificial intelligence algorithms for cancer-related miRNA research.Zhejiang Da Xue Xue Bao Yi Xue Ban. 2024 Apr 25;53(2):231-243. doi: 10.3724/zdxbyxb-2023-0511. Zhejiang Da Xue Xue Bao Yi Xue Ban. 2024. PMID: 38650448 Free PMC article. Review. Chinese, English.
-
Prenatal Environmental Stressors and DNA Methylation Levels in Placenta and Peripheral Tissues of Mothers and Neonates Evaluated by Applying Artificial Neural Networks.Genes (Basel). 2023 Mar 30;14(4):836. doi: 10.3390/genes14040836. Genes (Basel). 2023. PMID: 37107594 Free PMC article.
-
A qualitative prognostic biomarker for melanoma based on the relative methylation orderings of CpG loci.Epigenetics. 2025 Dec;20(1):2487316. doi: 10.1080/15592294.2025.2487316. Epub 2025 Apr 3. Epigenetics. 2025. PMID: 40181653 Free PMC article.
References
-
- Alfaro E., Gáamez M., García N. (2013). Adabag: An R Package for Classification with Boosting and Bagging. J. Stat. Softw. 54 (2), 1–35. 10.18637/jss.v054.i02 - DOI
-
- Alfaro E., Gamez M., Garcia N. (2018). CRAN - Package Adabag,” CRAN R Project. Online. Available: https://cran.r-project.org/web/packages/adabag/index.html (Accessed Jun 23, 2021).
-
- American Cancer Society (2016). European Commission Melanoma Skin Cancer. Atlanta.
-
- Cancer Research UK (2017). Melanoma Skin Cancer Incidence Statistics. Online. Available: https://www.cancerresearchuk.org/health-professional/cancer-statistics/s... (Accessed 03 Jun, 2021).
LinkOut - more resources
Full Text Sources
Other Literature Sources