. 2021 Sep 28:2021:3803724.
doi: 10.1155/2021/3803724. eCollection 2021.

Comprehensive Analysis of m5C RNA Methylation Regulator Genes in Clear Cell Renal Cell Carcinoma

Affiliations

Comprehensive Analysis of m5C RNA Methylation Regulator Genes in Clear Cell Renal Cell Carcinoma

Jiajin Wu et al. Int J Genomics. .

Abstract

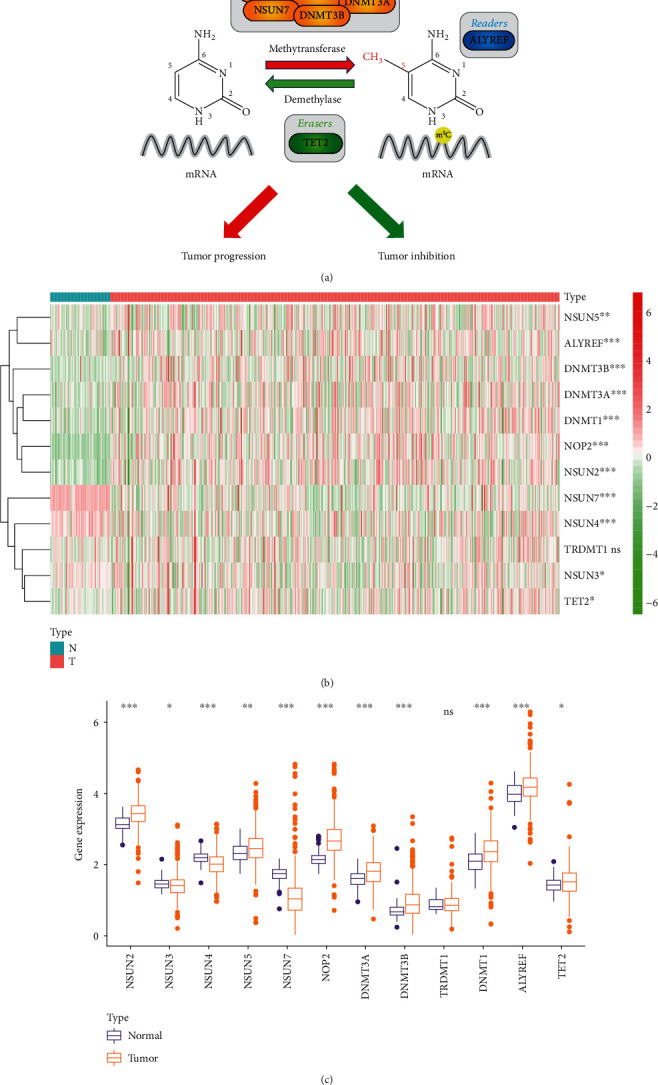
Background: Recent research found that N5-methylcytosine (m5C) was involved in the development and occurrence of numerous cancers. However, the function and mechanism of m5C RNA methylation regulators in clear cell renal cell carcinoma (ccRCC) remains undiscovered. This study is aimed at investigating the predictive and clinical value of these m5C-related genes in ccRCC.

Methods: Based on The Cancer Genome Atlas (TCGA) database, the expression patterns of twelve m5C regulators and matched clinicopathological characteristics were downloaded and analyzed. To reveal the relationships between the expression levels of m5C-related genes and the prognosis value in ccRCC, consensus clustering analysis was carried out. By univariate Cox analysis and last absolute shrinkage and selection operator (LASSO) Cox regression algorithm, a m5C-related risk signature was constructed in the training group and further validated in the testing group and the entire cohort. Then, the predictive ability of survival of this m5C-related risk signature was analyzed by Cox regression analysis and nomogram. Functional annotation and single-sample Gene Set Enrichment Analysis (ssGSEA) were applied to further explore the biological function and potential signaling pathways. Furthermore, we performed qRT-PCR experiments and measured global m5C RNA methylation level to validate this signature in vitro and tissue samples.

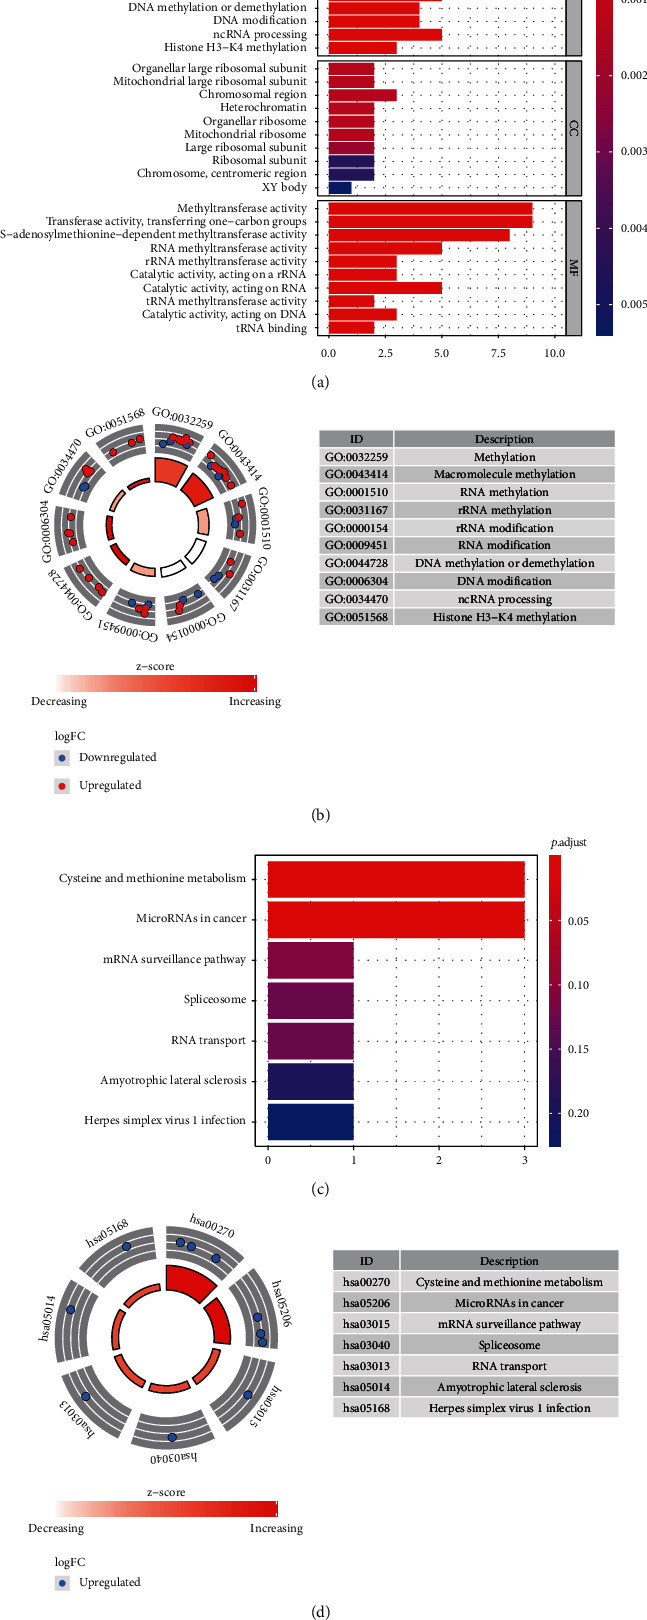
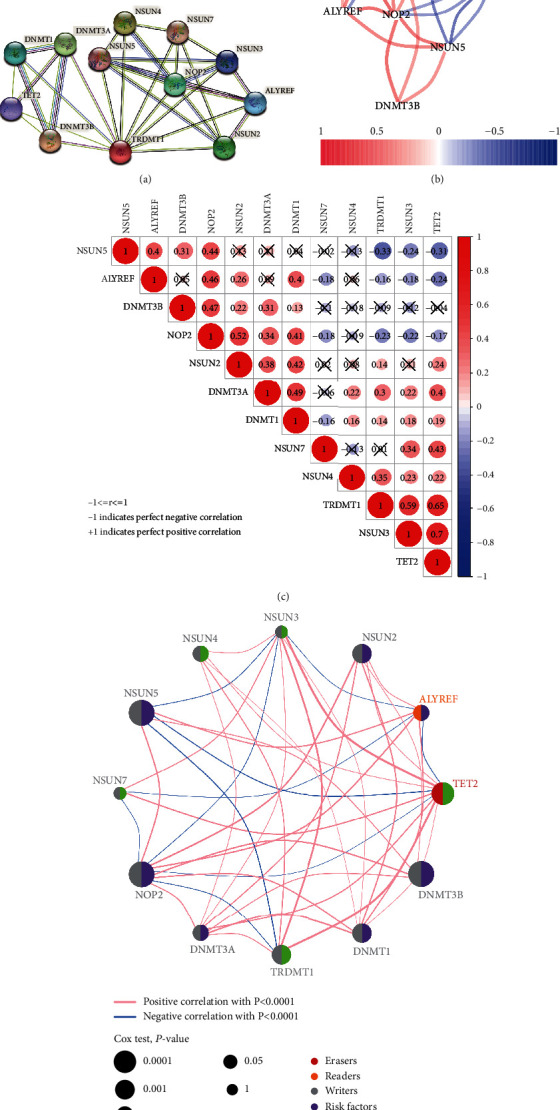
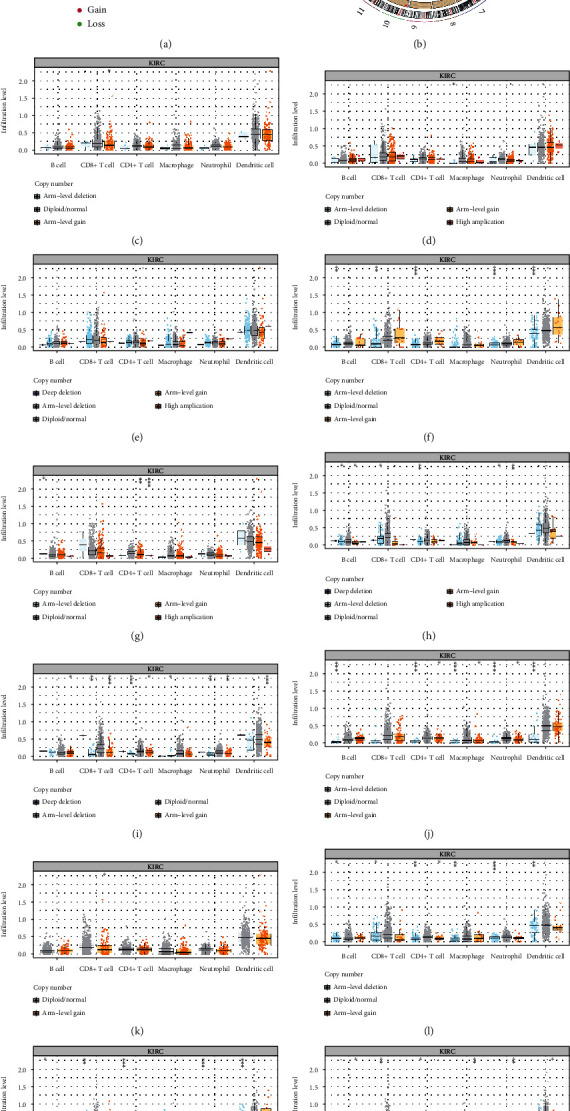
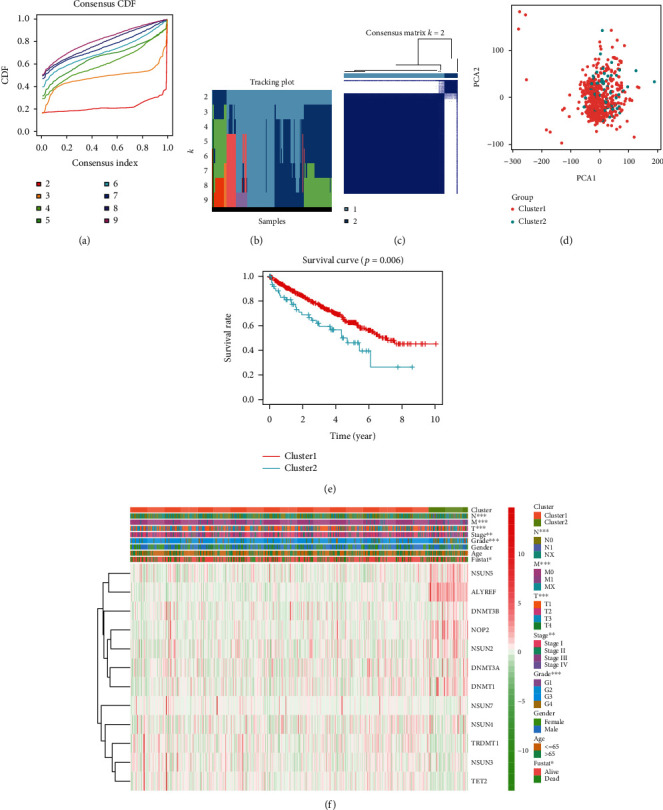
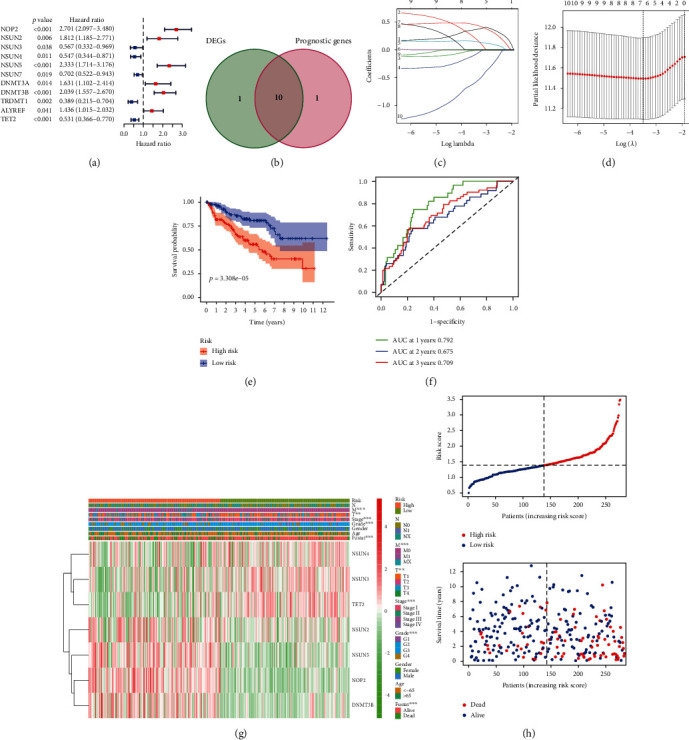
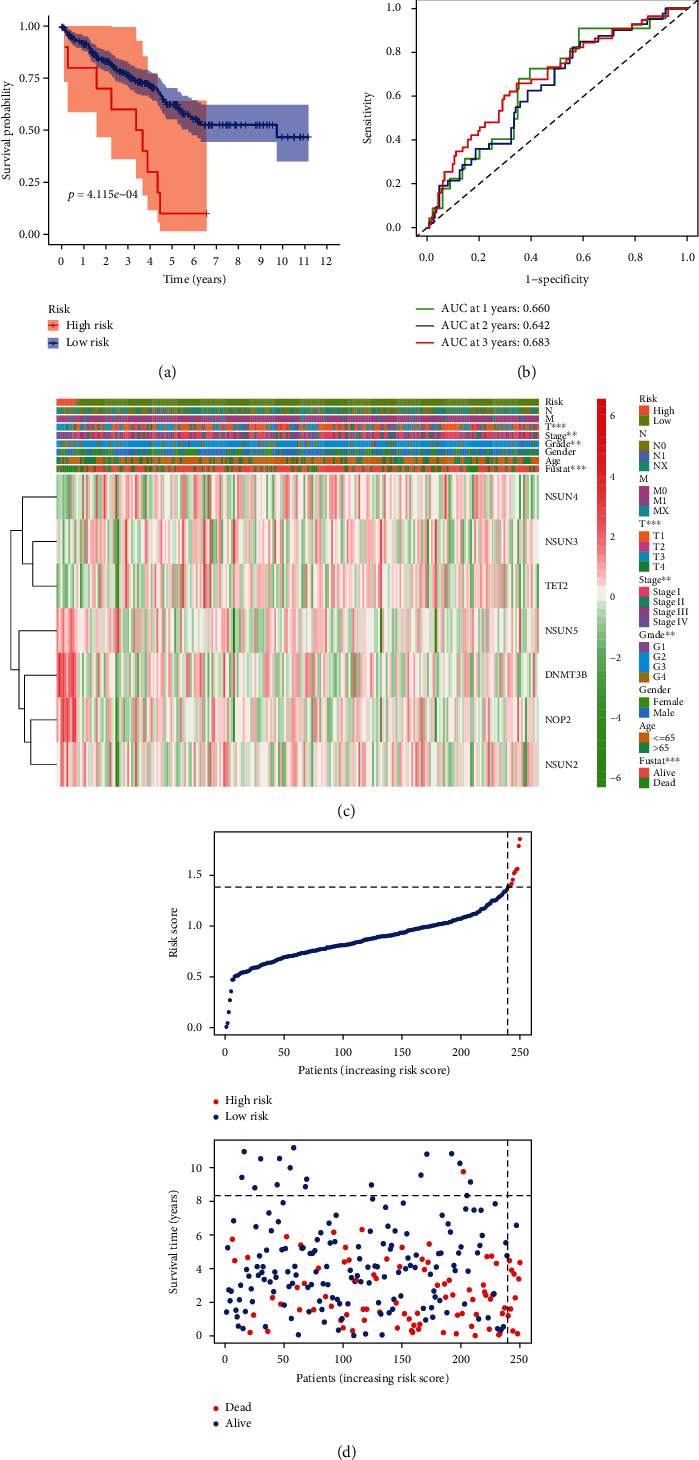
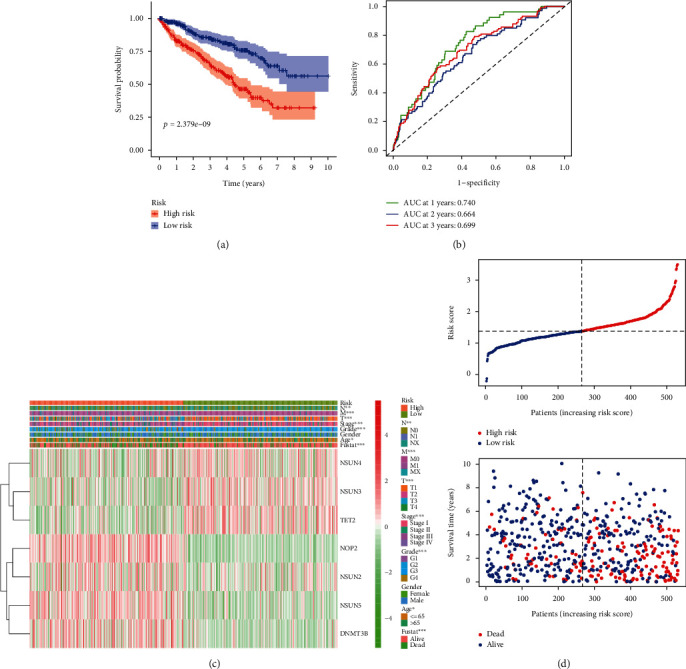
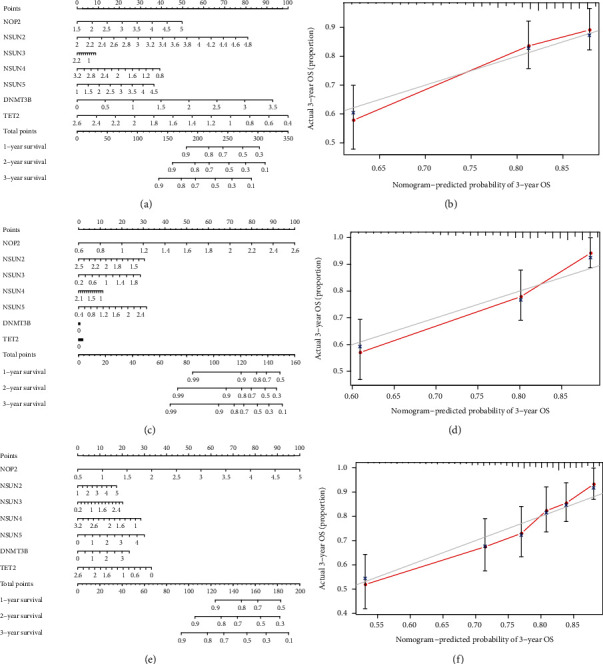
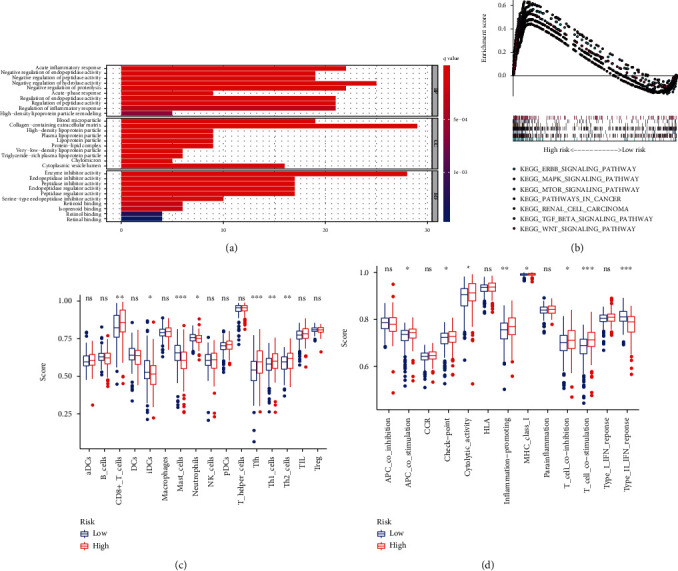
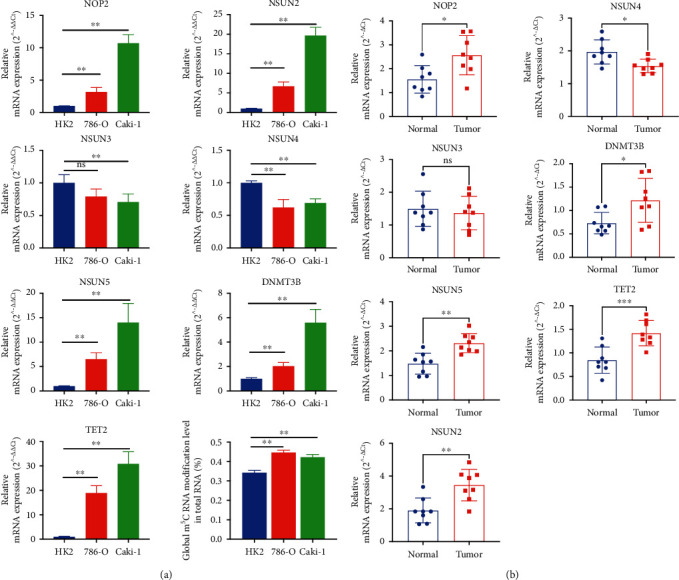
Results: In the TCGA-KIRC cohort, we found significant differences in the expression of m5C RNA methylation-related genes between ccRCC tissues and normal kidney tissues. Consensus cluster analysis was conducted to separate patients into two m5C RNA methylation subtypes. Significantly better outcomes were observed in ccRCC patients in cluster 1 than in cluster 2. m5C RNA methylation-related risk score was calculated to evaluate the prognosis of ccRCC patients by seven screened m5C RNA methylation regulators (NOP2, NSUN2, NSUN3, NSUN4, NSUN5, TET2, and DNMT3B) in the training cohort. The AUC for the 1-, 2-, and 3-year survival in the training cohort were 0.792, 0.675, and 0.709, respectively, indicating that the risk signature had an excellent prognosis prediction in ccRCC. Additionally, univariate and multivariate Cox regression analyses revealed that the risk signature could be an independent prognostic factor in ccRCC. The results of ssGSEA suggested that the immune cells with different infiltration degrees between the high-risk and low-risk groups were T cells including follicular helper T cells, Th1_cells, Th2_cells, and CD8+_T_cells, and the main differences in immune-related functions between the two groups were the interferon response and T cell costimulation. In addition, qRT-PCR experiments confirmed our results in renal cell lines and tissue samples.

Conclusions: According to the seven selected regulatory factors of m5C RNA methylation, a risk signature associated with m5C methylation that can independently predict prognosis in patients with ccRCC was developed and further verified the predictive efficiency.


Conflict of interest statement

The authors declare that they have no conflicts of interest.

Figures

Figure 1
Figure 1
Different expression of m5C RNA methylation-related genes in ccRCC. (a) Schematic flow chart of N5-methylcytosine (m5C) RNA methylation. (b) The heatmap of twelve m5C RNA methylation regulators in 539 ccRCC and 72 normal tissues from the TCGA database. The color bar from red to green denotes high to low gene expression. (c) The expression of twelve m5C RNA methylation regulators in normal tissues and ccRCC from the TCGA database. p < 0.05, ∗∗p < 0.01, and ∗∗∗p < 0.001. ns: no significance.
Figure 2
Figure 2
Enrichment plots of twelve m5C RNA methylation-related genes by performing GSEA. (a) GO enrichment analysis of twelve m5C RNA methylation-related genes in the TCGA-KIRC cohort. (b) KEGG pathway analysis of twelve m5C RNA methylation-related genes in the TCGA-KIRC cohort.
Figure 3
Figure 3
PPI network and correlation analyses of m5C RNA methylation-related genes. (a) PPI network of the eleven differentially expressed m5C RNA methylation regulatory genes. (b) Correlation analysis at the transcriptional level. (c) Pearson's correlation analysis of these m5C RNA methylation-related genes in the TCGA. Note: ‘r' denotes Pearson's correlation coefficient whose value ranges between -1 (perfect negative correlation) and +1 (perfect positive correlation). (d) A network plot of the function and correlation analysis by Cox test.
Figure 4
Figure 4
Correlations between CNV and immune cell infiltrations of twelve m5C modification regulators in ccRCC. (a) The copy number variation (CNV) frequency percentage of m5C regulators in ccRCC. The red dot represents the CNV amplification, and the green dot represents the CNV deletion. (b) The location of CNV of m5C regulators on chromosomes. (c–n) Correlation analysis between the CNV of m5C-related signature and immune cell infiltration. (c) NOP2. (d) NSUN2. (e) NSUN3. (f) NSUN4. (g) NSUN5. (h) NSUN7. (i) DNMT1. (j) DNMT3A. (k) DNMT3B. (l) TRDMT1. (m) ALYREF. (n) TET2. p < 0.05, ∗∗p < 0.01, and ∗∗∗p < 0.001. ns: no significance.
Figure 5
Figure 5
Consensus clustering analysis shows two clusters of ccRCC patients with differential prognosis. (a) Cumulative distribution function (CDF) curves for the consensus score (k = 2 to 9). (b) The tracking plot for k = 2 to 9. (c) Consensus clustering matrix for the optimal cluster number, k = 2. (d) Principal component analysis of the total RNA expression profile. ccRCC in cluster 1 and 2 are marked in red and blue, respectively. (e) Kaplan-Meier overall survival (OS) curve for ccRCC patients in cluster 1 and 2. (f) The expression heatmap of the 12 m5C methylation regulatory genes in cluster 1 and cluster 2 patients that were stratified according to the clinicopathological parameters: namely, N stage (N0, N1, or NX), M stage (M0, M1, or MX), T stage (T1-T4), AJCC stages (stages I, II, III ,or IV), grade (G1-G4), gender (male or female), age (>65 y or <65 y), and survival status (alive or dead). p < 0.05, ∗∗p < 0.01, and ∗∗∗p < 0.001.
Figure 6
Figure 6
Construction and evaluation of the m5C RNA methylation-related prognostic risk signature in the training cohort. (a) Univariate Cox regression analysis results show the p values and hazard ratios (HR) with confidence intervals (CI) of the twelve m5C RNA methylation regulatory genes. (b) The Venn diagram between differentially expressed genes and genes related to OS. (c, d) The 7 prognostic risk signature genes were selected by LASSO Cox regression analysis. (e) Kaplan-Meier survival curves show the overall survival (OS) rates of high-risk (n = 135) and low-risk (n = 132) ccRCC patients of the training cohort. The high-risk group shows shorter OS compared to the low-risk group. (f) The accuracy and reliability of the prognostic risk signature in determining the 1-year, 2-year, and 3-year survival outcomes of the high- and low-risk patients in the training cohort. (g) The expression heatmap of the seven prognostic risk-related m5C RNA methylation regulators in the high-risk (blue) and low-risk (pink) ccRCC patients of the training cohort. ∗∗p < 0.01; ∗∗∗p < 0.001. (h) The distributions of risk scores of the high-risk (red) and low-risk (blue) ccRCC patients and corresponding survival time (the red dots represent the dead patients and the blue dots represent the alive patients) in the training cohort.
Figure 7
Figure 7
Validation of the prognostic risk signature in the testing cohort. (a) Kaplan-Meier curve analysis shows the OS of high-risk (n = 10) and low-risk (n = 236) ccRCC patients in the testing cohort. (b) ROC curve analysis in the testing cohort shows the false positive rate vs. true positive rate plots based on the prognostic risk signature. The AUC values for 1-year (green), 2-year (blue), and 3-year (red) survival rates are also shown. (c) The expression heatmap of the seven prognostic-risk related m5C RNA methylation regulators in the high-risk (blue) and low-risk (pink) ccRCC patients of the testing cohort. ∗∗p < 0.01; ∗∗∗p < 0.001. (d) The distributions of risk scores of the high-risk (red) and low-risk (blue) ccRCC patients and corresponding survival time (the red dots represent the dead patients and the blue dots represent the alive patients) in the testing cohort.
Figure 8
Figure 8
Validation of the prognostic risk signature in the whole TCGA-KIRC cohort. (a) Kaplan-Meier curve analysis shows the OS of high-risk (n = 258) and low-risk (n = 259) ccRCC patients in the entire TCGA cohort. (b) ROC curve analysis in the entire cohort shows the false positive rate vs. true positive rate plots based on the prognostic risk signature. The AUC values for 1-year (green), 2-year (blue), and 3-year (red) survival rates are also shown. (c) The expression heatmap of the seven prognostic-risk related m5C RNA methylation regulators in the high-risk (blue) and low-risk (pink) ccRCC patients of the entire cohort. ∗∗p < 0.01; ∗∗∗p < 0.001. (d) The distributions of risk scores of the high-risk (red) and low-risk (blue) ccRCC patients and corresponding survival time (the red dots represent the dead patients and the blue dots represent the alive patients) in the entire cohort.
Figure 9
Figure 9
Nomograms to predict the survival rate of ccRCC patients in the training cohort, testing cohort, and the entire cohort. (a) The nomogram of used to predict the survival time, and (b) the calibration map used to predict the 3-year rate in the training cohort. (c) The nomogram used to predict the survival time, and (d) the calibration map used to predict the 3-year rate in the testing cohort. (e) The nomogram of used to predict the survival time, and (f) the calibration map used to predict the 3-year rate in the entire cohort.
Figure 10
Figure 10
GSEA enrichment analysis. (a) The results of GO analysis in ccRCC with high-risk (red) and low-risk (blue) patients. (b) The seven most significantly enriched signaling pathways from KEGG. (c, d) Single-sample GSEA (ssGSEA) analysis showing the types of infiltrating immune cells (c) and the immune-related functions (d) in ccRCC with high risk (red) and low risk (blue). p < 0.05, ∗∗p < 0.01, and ∗∗∗p < 0.001. ns: no significance.
Figure 11
Figure 11
Verification of seven m5C RNA methylation-related genes in vitro and tissue samples. qRT-PCR experiment verified in renal cancer cell lines (a) and ccRCC tissue samples (b). NOP2, NSUN2, NSUN5, DNMT3B, and TET2 were significantly upregulated in cell lines and tissue samples, while NSUN4 was downregulated. However, NSUN3 mRNA expression level showed no significant difference. m5C RNA modification levels in the cell lines were measured by Global RNA Methylation Assay Kit (A). The bar graphs represent means ± standard deviation. ∗∗p < 0.05.

Similar articles

Cited by

References

    1. Ljungberg B., Cowan N. C., Hanbury D. C., et al. EAU guidelines on renal cell carcinoma: the 2010 update. European Urology . 2010;58(3):398–406. doi: 10.1016/j.eururo.2010.06.032. - DOI - PubMed
    1. Moch H., Cubilla A. L., Humphrey P. A., Reuter V. E., Ulbright T. M. The 2016 WHO Classification of Tumours of the Urinary System and Male Genital Organs--Part A: Renal, Penile, and Testicular Tumours. European Urology . 2016;70(1):93–105. doi: 10.1016/j.eururo.2016.02.029. - DOI - PubMed
    1. Cavaliere C., D`Aniello C., Pepa C. D., Pisconti S., Berretta M., Facchini G. Current and emerging treatments for metastatic renal cell carcinoma. Current Cancer Drug Targets . 2018;18(5):468–479. doi: 10.2174/1568009617666170209094030. - DOI - PubMed
    1. Miao D., Margolis C. A., Gao W., et al. Genomic correlates of response to immune checkpoint therapies in clear cell renal cell carcinoma. Science . 2018;359(6377):801–806. doi: 10.1126/science.aan5951. - DOI - PMC - PubMed
    1. Stewart S. B., Thompson R. H., Psutka S. P., et al. Evaluation of the National Comprehensive Cancer Network and American Urological Association renal cell carcinoma surveillance guidelines. Journal of Clinical Oncology . 2014;32(36):4059–4065. doi: 10.1200/JCO.2014.56.5416. - DOI - PMC - PubMed