

Quantitative analysis of genome packaging in recombinant AAV vectors by charge detection mass spectrometry
- PMID: 34631929
- PMCID: PMC8476707
- DOI: 10.1016/j.omtm.2021.08.002
Quantitative analysis of genome packaging in recombinant AAV vectors by charge detection mass spectrometry
Abstract
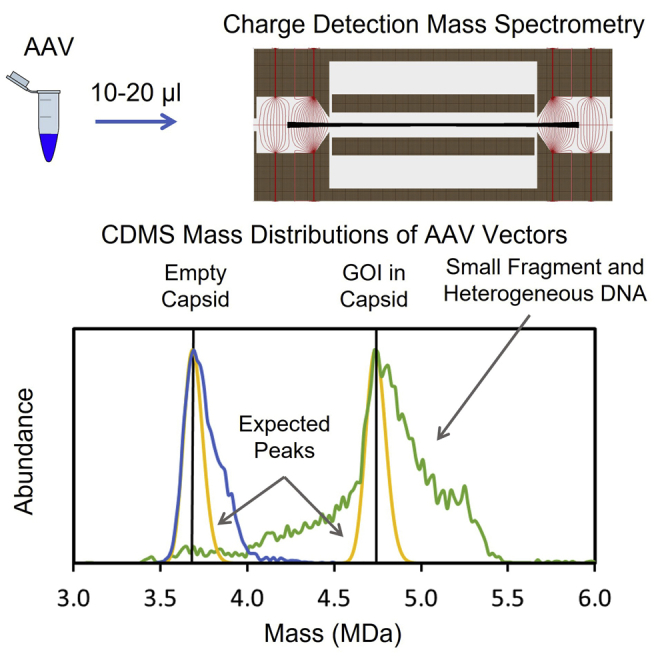
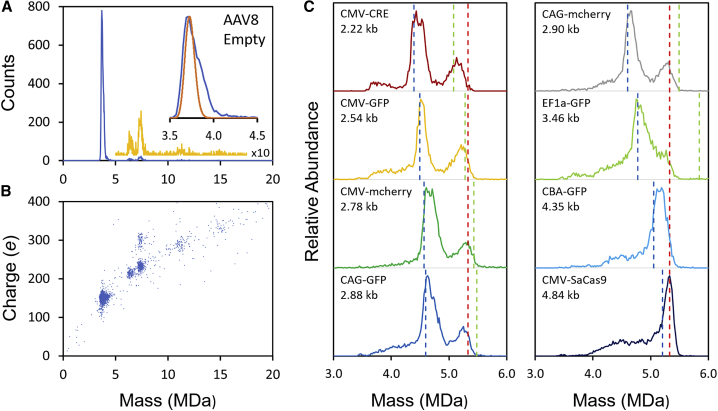
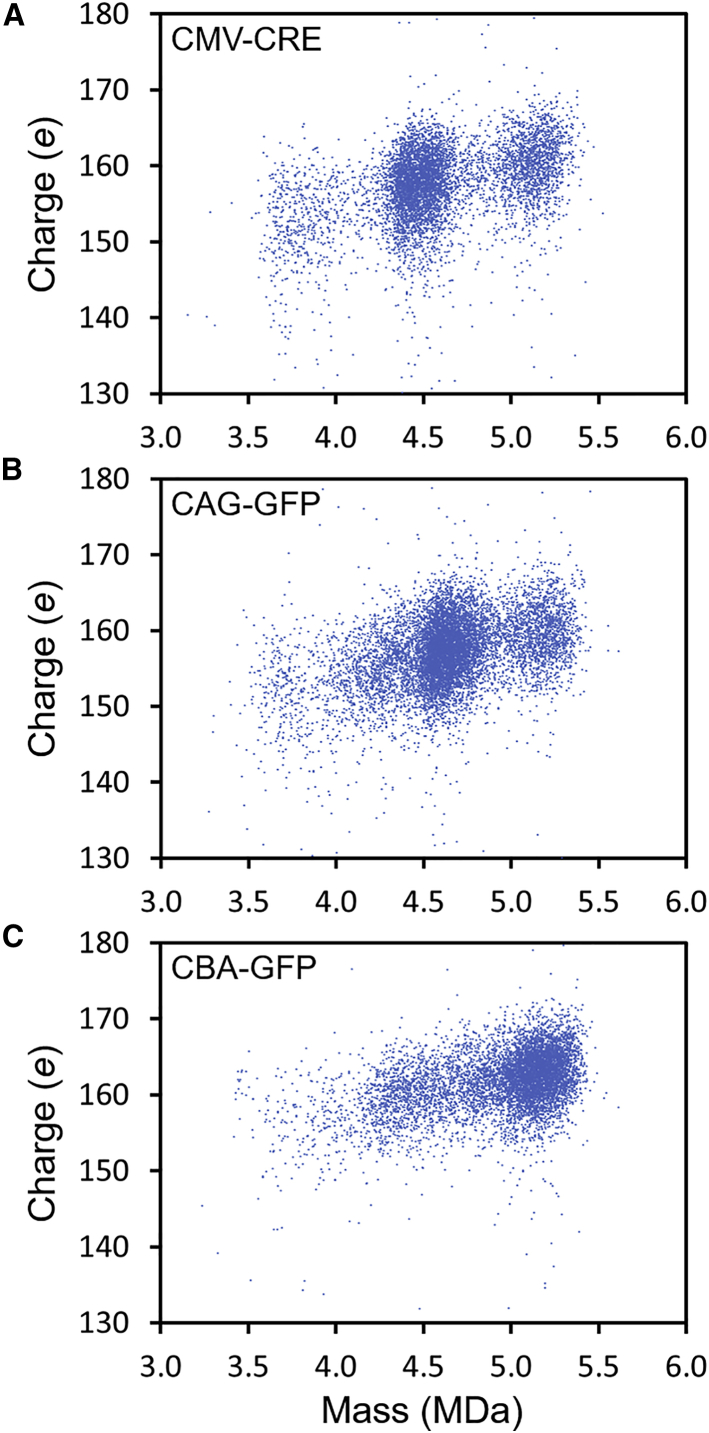
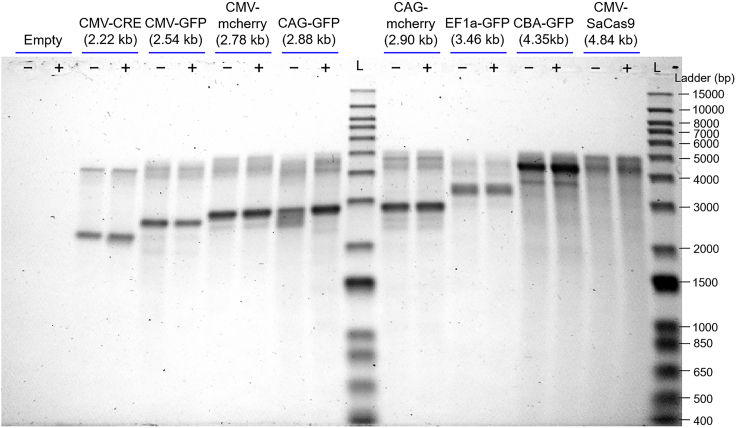
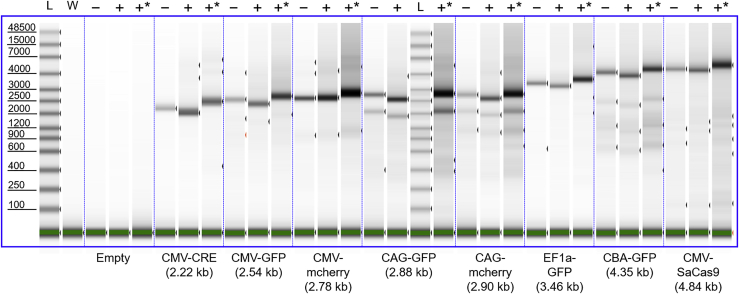
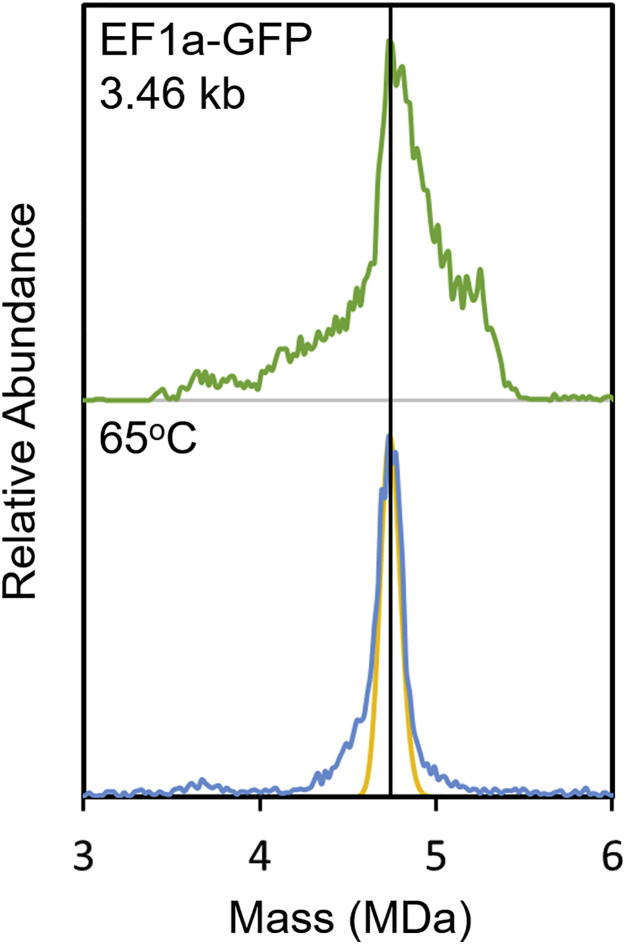
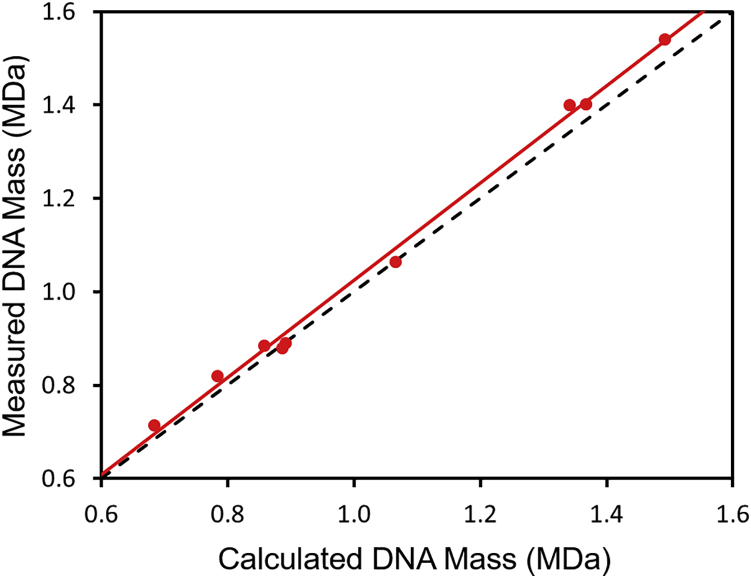
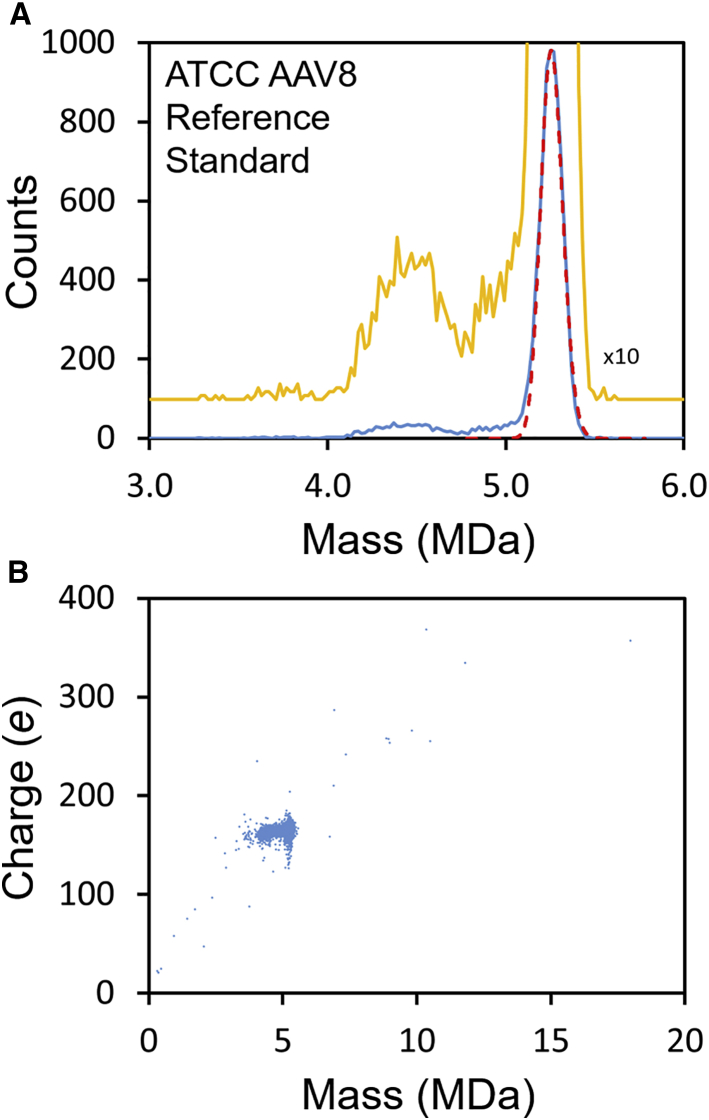
Recombinant adeno-associated virus (rAAV) has emerged as an important gene therapy vector with many clinical trials currently in progress. Analytical characterization and quantitation of particle content remain challenges in both the development and production of rAAV vectors. In this study, charge detection mass spectrometry (CDMS) and gel electrophoresis are used to characterize the DNA content of recombinant AAV8 (rAAV8) vectors with a wide range of target genome sizes. We show that the differences between the masses of empty particles and particles with the genome of interest (GOI) are correlated with the expected genome mass. A small systematic deviation (around 2%) is attributed to the packaging of counterions along with the DNA. In addition to the GOI, a broad distribution of heterogeneous DNA is packaged. The distribution peaks are close to the packaging capacity of the rAAV8 vectors. There is also evidence for the co-packaging of small DNA fragments along with the GOI. Finally, we present evidence that incubation at an elevated temperature can reduce the heterogeneity of the packaged DNA. Taken together, these results show that CDMS is a viable tool for characterization of the packaged genome.
Keywords: AAV; CDMS; GOI; adeno-associated virus; charge detection mass spectrometry; genome; mass spectrometry; rAAV.
© 2021 The Authors.
Conflict of interest statement
B.E.D. and M.F.J. are shareholders in Megadalton Solutions, a company that is engaged in commercializing CDMS. The remaining authors declare no competing interests.
Figures
Similar articles
-
Analysis of thermally driven structural changes, genome release, disassembly, and aggregation of recombinant AAV by CDMS.Mol Ther Methods Clin Dev. 2022 Oct 14;27:327-336. doi: 10.1016/j.omtm.2022.10.008. eCollection 2022 Dec 8. Mol Ther Methods Clin Dev. 2022. PMID: 36381304 Free PMC article.
-
Analysis of AAV-Extracted DNA by Charge Detection Mass Spectrometry Reveals Genome Truncations.Anal Chem. 2023 Mar 7;95(9):4310-4316. doi: 10.1021/acs.analchem.2c04234. Epub 2023 Feb 22. Anal Chem. 2023. PMID: 36880264
-
Resolving Adeno-Associated Viral Particle Diversity With Charge Detection Mass Spectrometry.Anal Chem. 2016 Jul 5;88(13):6718-25. doi: 10.1021/acs.analchem.6b00883. Epub 2016 Jun 16. Anal Chem. 2016. PMID: 27310298 Free PMC article.
-
Expressing Transgenes That Exceed the Packaging Capacity of Adeno-Associated Virus Capsids.Hum Gene Ther Methods. 2016 Feb;27(1):1-12. doi: 10.1089/hgtb.2015.140. Hum Gene Ther Methods. 2016. PMID: 26757051 Free PMC article. Review.
-
Adeno-associated virus as a gene therapy vector: vector development, production and clinical applications.Adv Biochem Eng Biotechnol. 2005;99:119-45. Adv Biochem Eng Biotechnol. 2005. PMID: 16568890 Review.
Cited by
-
Evaluation of a rapid multi-attribute combinatorial high-throughput UV-Vis/DLS/SLS analytical platform for rAAV quantification and characterization.Mol Ther Methods Clin Dev. 2024 Jul 15;32(3):101298. doi: 10.1016/j.omtm.2024.101298. eCollection 2024 Sep 12. Mol Ther Methods Clin Dev. 2024. PMID: 39170800 Free PMC article.
-
Empty and Full AAV Capsid Charge and Hydrophobicity Differences Measured with Single-Particle AFM.Langmuir. 2023 Apr 25;39(16):5641-5648. doi: 10.1021/acs.langmuir.2c02643. Epub 2023 Apr 11. Langmuir. 2023. PMID: 37040364 Free PMC article.
-
Insights into Adeno-Associated Virus Capsid Charge Heterogeneity.Anal Chem. 2025 Aug 12;97(31):17132-17140. doi: 10.1021/acs.analchem.5c03104. Epub 2025 Jul 17. Anal Chem. 2025. PMID: 40673772 Free PMC article.
-
PCR-Based Analytical Methods for Quantification and Quality Control of Recombinant Adeno-Associated Viral Vector Preparations.Pharmaceuticals (Basel). 2021 Dec 24;15(1):23. doi: 10.3390/ph15010023. Pharmaceuticals (Basel). 2021. PMID: 35056080 Free PMC article. Review.
-
Characterizing the Content and Structure of AAV Capsids by Size Exclusion Chromatography and Orbitrap-Based Charge Detection-Mass Spectrometry.J Am Soc Mass Spectrom. 2025 Aug 6;36(8):1659-1668. doi: 10.1021/jasms.5c00074. Epub 2025 Jun 26. J Am Soc Mass Spectrom. 2025. PMID: 40568774 Free PMC article.
References
-
- Atchison R.W., Casto B.C., Hammon W.M. Electron microscopy of adenovirus-associated virus (AAV) in cell cultures. Virology. 1966;29:353–357. - PubMed
LinkOut - more resources
Full Text Sources
Other Literature Sources
