

Analysis of the cerebellar molecular stress response led to first evidence of a role for FKBP51 in brain FKBP52 expression in mice and humans
- PMID: 34632006
- PMCID: PMC8488056
- DOI: 10.1016/j.ynstr.2021.100401
Analysis of the cerebellar molecular stress response led to first evidence of a role for FKBP51 in brain FKBP52 expression in mice and humans
Abstract
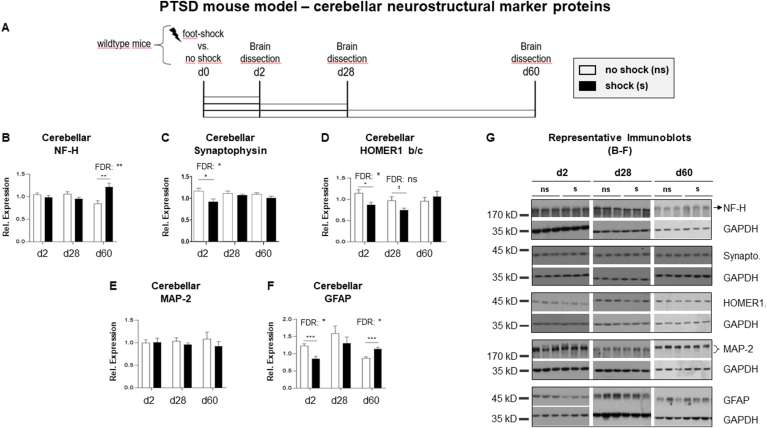
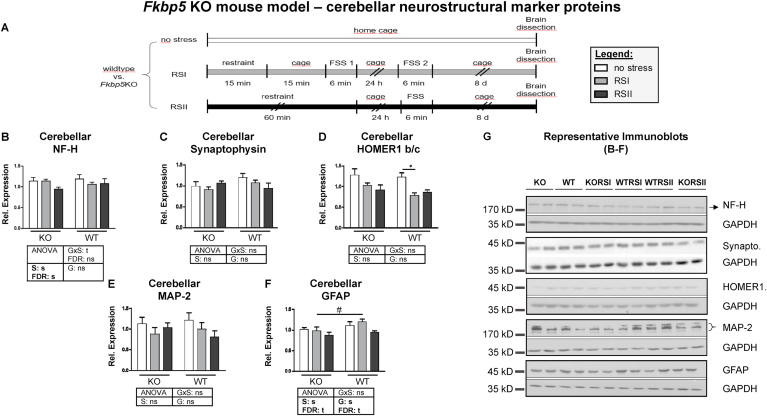
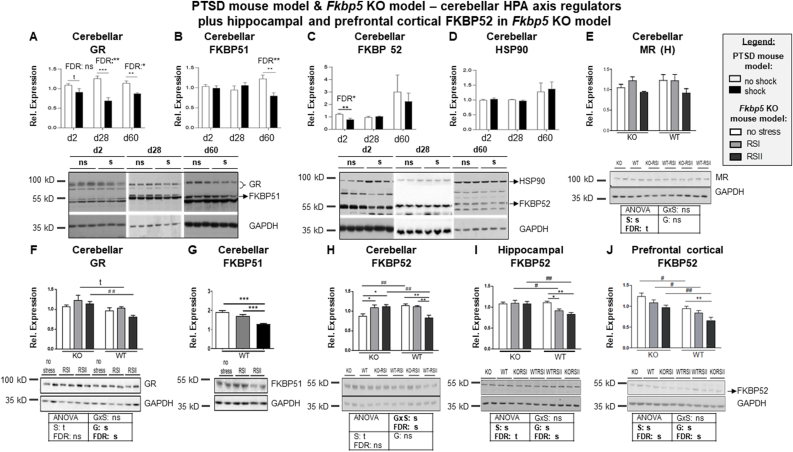
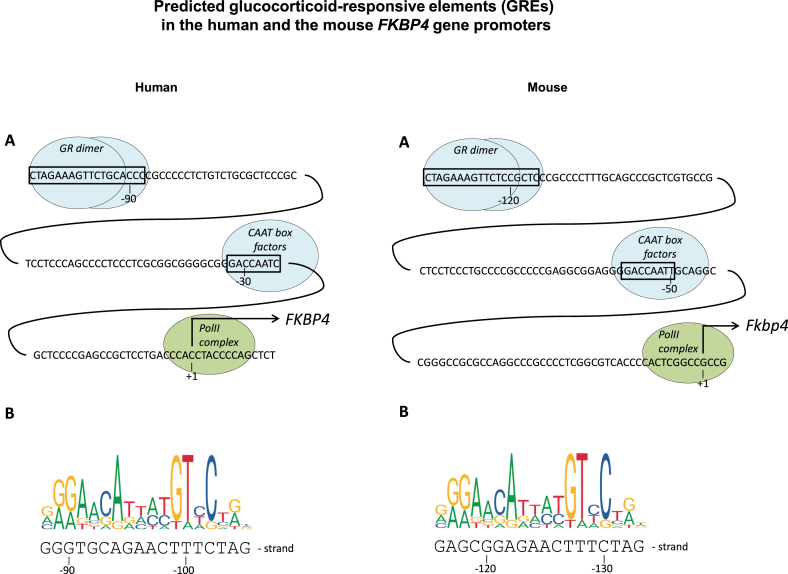
As the cerebellar molecular stress response is understudied, we assessed protein expression levels of hypothalamic-pituitary-adrenal (HPA) axis regulators and neurostructural markers in the cerebellum of a male PTSD mouse model and of unstressed vs. stressed male FK506 binding protein 51 (Fkbp5) knockout (KO) vs. wildtype mice. We explored the translatability of our findings in the Fkbp5 KO model to the situation in humans by correlating mRNA levels of candidates with those of FKBP5 in two whole transcriptome datasets of post-mortem human cerebellum and in blood of unstressed and stressed humans. Fkbp5 deletion rescued the stress-induced loss in hippocampal, prefrontal cortical, and, possibly, also cerebellar FKBP52 expression and modulated post-stress cerebellar expression levels of the glucocorticoid receptor (GR) and possibly (trend) also of glial fibrillary acidic protein (GFAP). Accordingly, expression levels of genes encoding for these three genes correlated with those of FKBP5 in human post-mortem cerebellum, while other neurostructural markers were not related to Fkbp5 either in mouse or human cerebellum. Also, gene expression levels of the two immunophilins correlated inversely in the blood of unstressed and stressed humans. We found transient changes in FKBP52 and persistent changes in GR and GFAP in the cerebellum of PTSD-like mice. Altogether, upon elucidating the cerebellar stress response we found first evidence for a novel facet of HPA axis regulation, i.e., the ability of FKBP51 to modulate the expression of its antagonist FKBP52 in the mouse and, speculatively, also in the human brain and blood and, moreover, detected long-term single stress-induced changes in expression of cerebellar HPA axis regulators and neurostructural markers of which some might contribute to the role of the cerebellum in fear extinction.
Keywords: Cerebellum; FKBP5 knockout; FKBP52; HPA axis; PTSD mouse model.
© 2021 The Authors.
Conflict of interest statement
US and AP are consultants at Boehringer Ingelheim, Ingelheim, Germany. AP has served on advisory boards, given lectures, performed phase 3 studies, or received travel grants within the last 5 years from Eli Lilly and Co, Lundbeck, MEDICE Arzneimittel, Pütter GmbH and Co KG, Novartis, Servier and Shire/Takeda. TR is coinventor of the patent “FKBP51: a novel target for antidepressant therapy” (WO2005054500). TE, LH, HR, BN, CT, MS and NCG declare no conflict of interest.
Figures
Similar articles
-
A role for synapsin in FKBP51 modulation of stress responsiveness: Convergent evidence from animal and human studies.Psychoneuroendocrinology. 2015 Feb;52:43-58. doi: 10.1016/j.psyneuen.2014.11.005. Epub 2014 Nov 11. Psychoneuroendocrinology. 2015. PMID: 25459892
-
FKBP51 mediates resilience to inflammation-induced anxiety through regulation of glutamic acid decarboxylase 65 expression in mouse hippocampus.J Neuroinflammation. 2022 Jun 15;19(1):152. doi: 10.1186/s12974-022-02517-8. J Neuroinflammation. 2022. PMID: 35705957 Free PMC article.
-
FKBP5 Gene Expression Predicts Antidepressant Treatment Outcome in Depression.Int J Mol Sci. 2019 Jan 23;20(3):485. doi: 10.3390/ijms20030485. Int J Mol Sci. 2019. PMID: 30678080 Free PMC article.
-
Genetics of glucocorticoid regulation and posttraumatic stress disorder--What do we know?Neurosci Biobehav Rev. 2016 Apr;63:143-57. doi: 10.1016/j.neubiorev.2016.02.005. Epub 2016 Feb 9. Neurosci Biobehav Rev. 2016. PMID: 26872620 Review.
-
Role of FKBP5 and its genetic mutations in stress-induced psychiatric disorders: an opportunity for drug discovery.Front Psychiatry. 2023 Jun 16;14:1182345. doi: 10.3389/fpsyt.2023.1182345. eCollection 2023. Front Psychiatry. 2023. PMID: 37398599 Free PMC article. Review.
Cited by
-
FKBP52 in Neuronal Signaling and Neurodegenerative Diseases: A Microtubule Story.Int J Mol Sci. 2022 Feb 3;23(3):1738. doi: 10.3390/ijms23031738. Int J Mol Sci. 2022. PMID: 35163662 Free PMC article. Review.
-
Maternal cortisol concentration is associated with reduced brain activation to infant cry and more intrusive parenting behavior.Psychoneuroendocrinology. 2025 Jan;171:107207. doi: 10.1016/j.psyneuen.2024.107207. Epub 2024 Oct 5. Psychoneuroendocrinology. 2025. PMID: 39413527
-
Genetically engineered mouse models of FK506-binding protein 5.J Cell Biochem. 2024 Dec;125(12):e30374. doi: 10.1002/jcb.30374. Epub 2023 Feb 13. J Cell Biochem. 2024. PMID: 36780339 Review.
-
The Role of HSP90 Molecular Chaperones in Depression: Potential Mechanisms.Mol Neurobiol. 2025 Jan;62(1):708-717. doi: 10.1007/s12035-024-04284-4. Epub 2024 Jun 19. Mol Neurobiol. 2025. PMID: 38896156 Review.
-
Post-traumatic stress disorder: clinical and translational neuroscience from cells to circuits.Nat Rev Neurol. 2022 May;18(5):273-288. doi: 10.1038/s41582-022-00635-8. Epub 2022 Mar 29. Nat Rev Neurol. 2022. PMID: 35352034 Free PMC article. Review.
References
-
- Campos A.C., Ferreira F.R., da Silva W.A., Guimarães F.S. Predator threat stress promotes long lasting anxiety-like behaviors and modulates synaptophysin and CB1 receptors expression in brain areas associated with PTSD symptoms. Neurosci. Lett. 2013;533:34–38. doi: 10.1016/j.neulet.2012.11.016. - DOI - PubMed
-
- Carletto S., Borsato T. Neurobiological correlates of post-traumatic stress disorder: a focus on cerebellum role. European Journal of Trauma & Dissociation. 2017;1:153–157. doi: 10.1016/j.ejtd.2017.03.012. - DOI
-
- Chen C., Cheng L., Grennan K., Pibiri F., Zhang C., Badner J.A., Members of the Bipolar Disorder Genome Study (BiGS) Consortium. Gershon E.S., Liu C. Two gene co-expression modules differentiate psychotics and controls. Mol Psychiatry. 2013;18:1308–1314. doi: 10.1038/mp.2012.146. - DOI - PMC - PubMed
LinkOut - more resources
Full Text Sources
Research Materials
Miscellaneous
