. 2021 Jul 10:23:65-81.
doi: 10.1016/j.omto.2021.06.017. eCollection 2021 Dec 17.

R-2HG downregulates ERα to inhibit cholangiocarcinoma via the FTO/m6A-methylated ERα/miR16-5p/YAP1 signal pathway

Affiliations

R-2HG downregulates ERα to inhibit cholangiocarcinoma via the FTO/m6A-methylated ERα/miR16-5p/YAP1 signal pathway

Yuan Gao et al. Mol Ther Oncolytics. .

Abstract

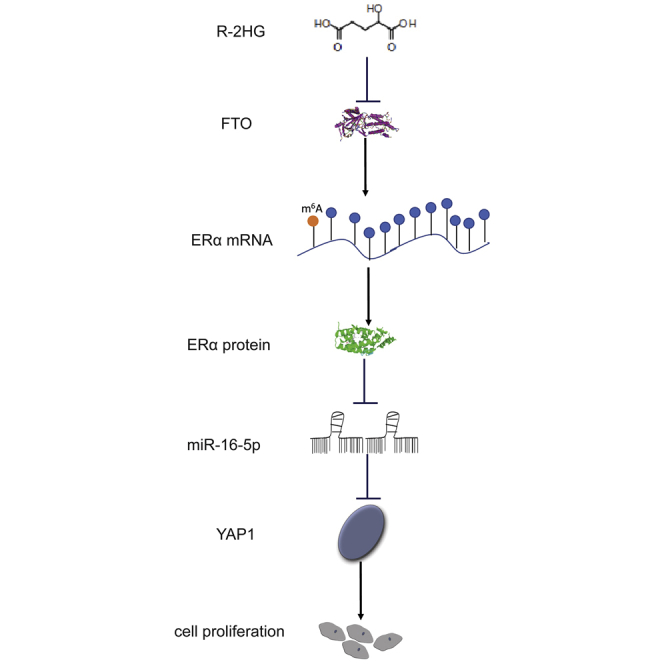
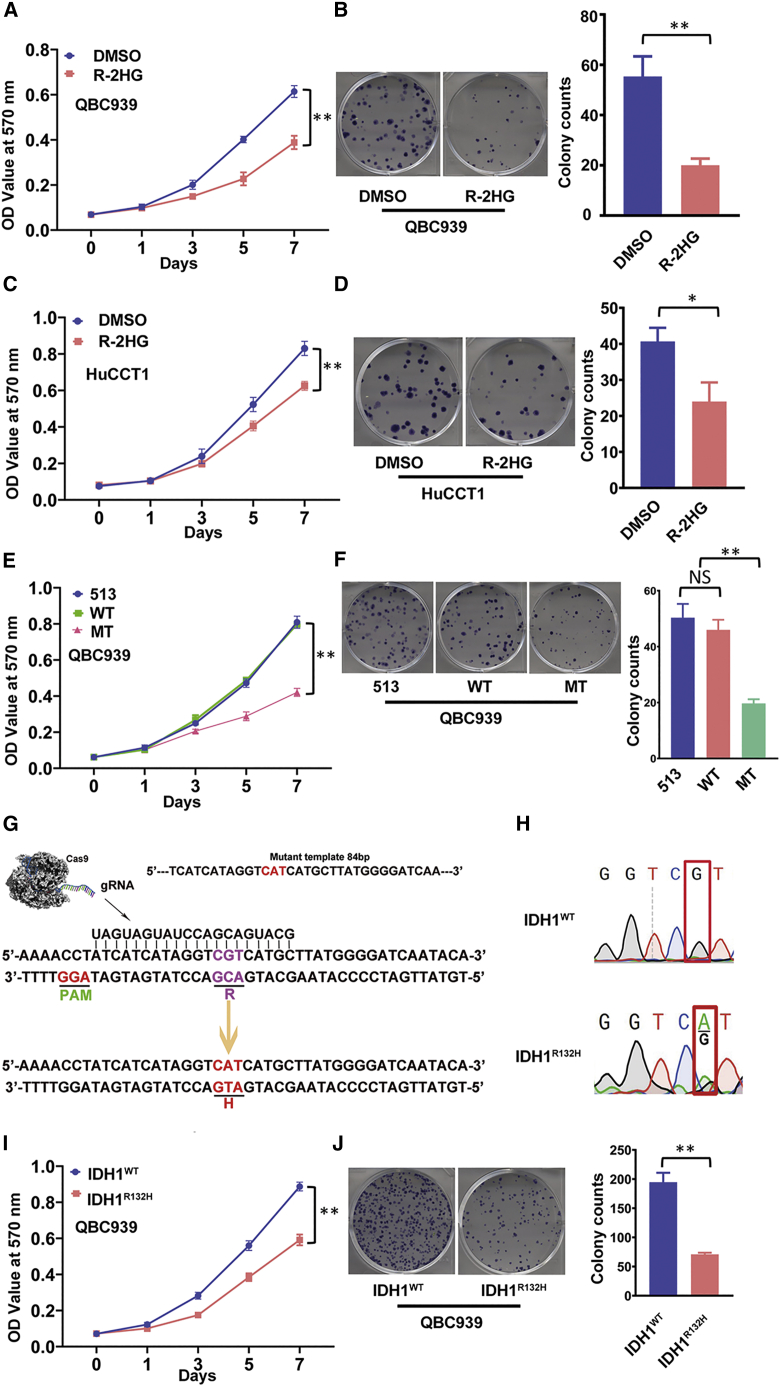
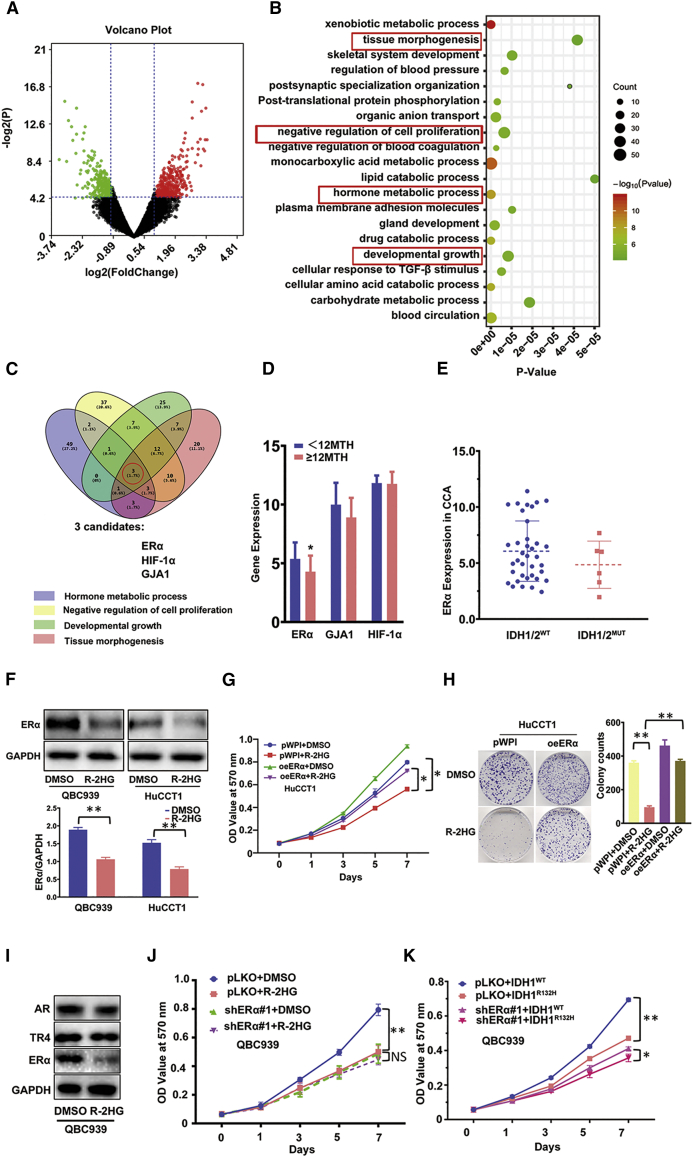
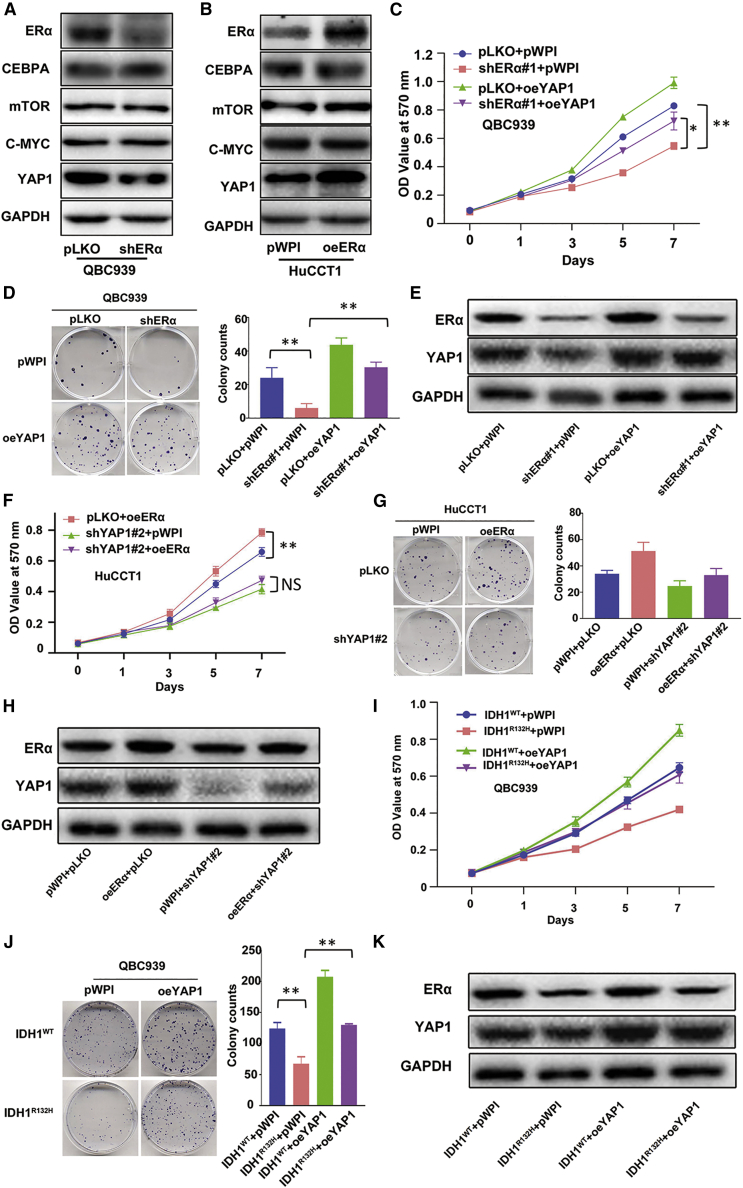
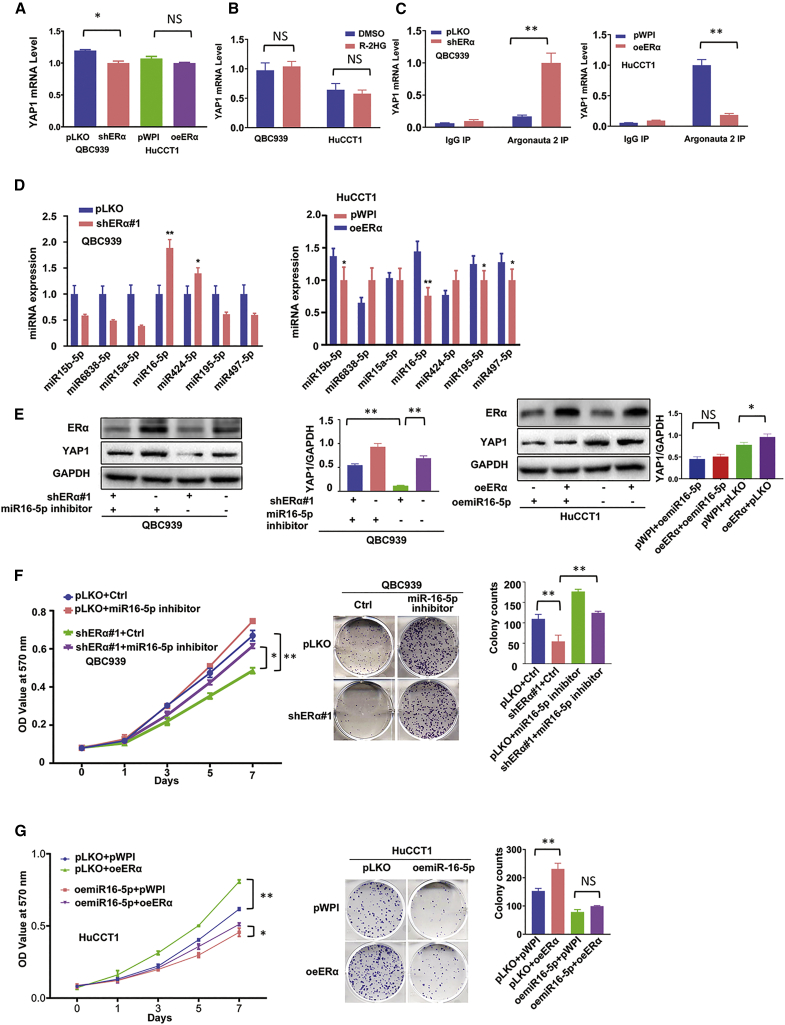
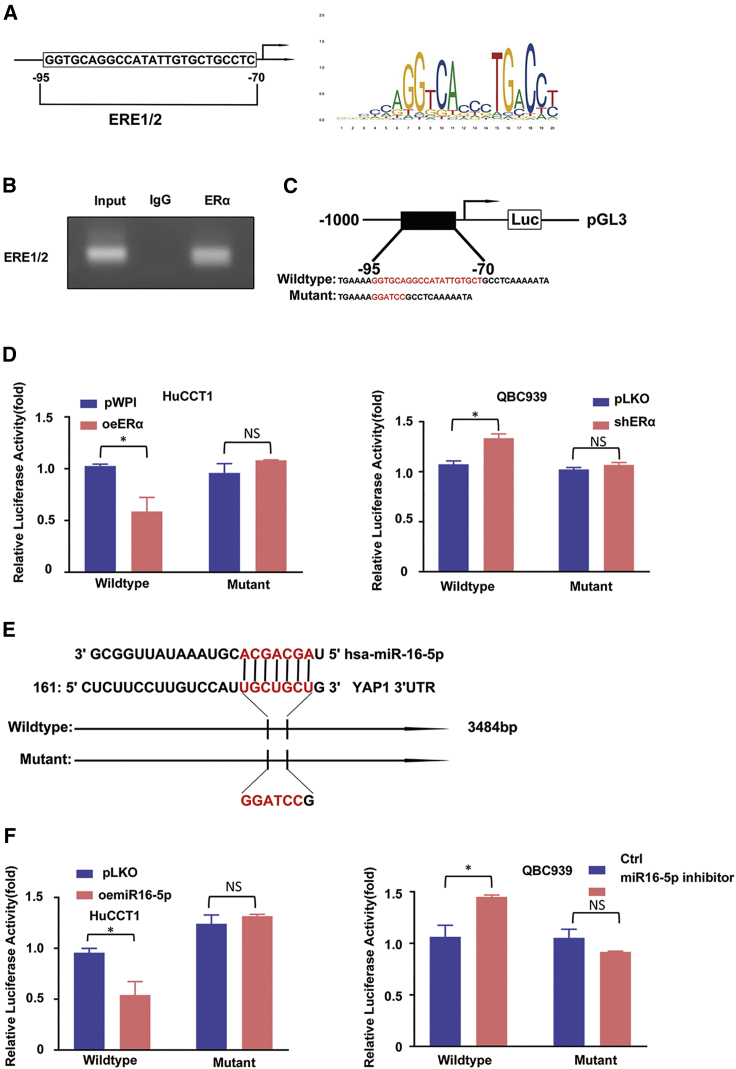
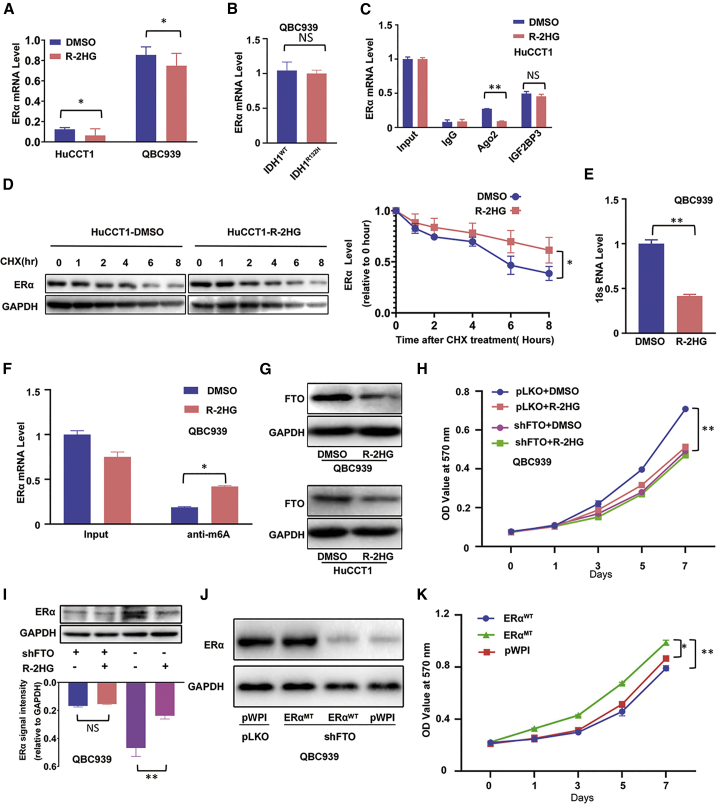
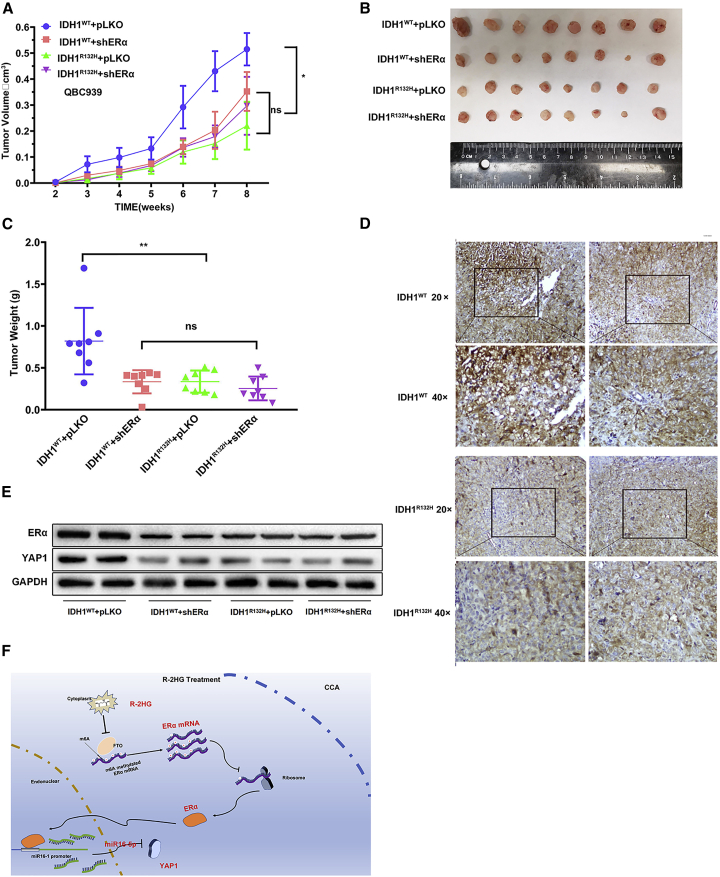
Isocitrate dehydrogenase (IDH) mutations increase (R)-2-hydroxyglutarate (R-2HG) production; however, functional mechanisms of R-2HG in regulating cholangiocarcinoma (CCA) development remain to be further investigated. We first applied the CRISPR-Cas9 gene-editing system to create IDH1R132H-mutated CCA cells. Interestingly, our data showed that R-2HG could function through downregulating estrogen receptor alpha (ERα) and Yes-associated protein 1 (YAP1) pathways to decrease CCA growth. Detailed mechanistic studies revealed that R-2HG could target and degrade the fat mass and obesity-associated protein (FTO), the first identified mRNA demethylase. This reduced FTO can increase the N 6-methyladenosine (m6A) to methylate the mRNA of ERα, and consequently decrease protein translation of the ERα. Further mechanistic studies revealed that ERα could transcriptionally suppress miR-16-5p expression, which could then increase YAP1 expression due to the reduced miR-16-5p binding to the 3' UTR of YAP1. Furthermore, data from the pre-clinical animal model with implantation of IDH1R132H QBC939 cells demonstrated that R-2HG generated by the IDH1 mutation could downregulate ERα and YAP1 to suppress CCA tumor growth. Taken together, our new findings suggested that IDH1 mutation-induced R-2HG could suppress CCA growth via regulating the FTO/m6A-methylated ERα/miR16-5p/YAP1 signaling pathway. Upregulating R-2HG or downregulating the ERα signal by short hairpin RNA ERα (shERα) or antiestrogen could be effective strategies to inhibit CCA.

Keywords: (R)-2-hydroxyglutarate; ERα; YAP1; cholangiocarcinoma; miR16-5p.


Conflict of interest statement

The authors declare no competing interests.

Figures

None
Graphical abstract
Figure 1
Figure 1
Oncometabolite R-2HG inhibits CCA cell proliferation in QBC939 and HuCCT1 cell lines (A and C) MTT assays were conducted to detect cell growth in QBC939 cells (A) and HuCCT1 cells (C). (B and D) Colony formation was used as another strategy to confirm the R-2HG effect on cell growth in QBC939 cells (B) and HuCCT1 cells (D). (E) R-2HG from overexpression of IDH1 mutation impacted QBC939 cell growth. (F) A colony formation assay confirmed the reduced growth of QBC939 cells with the IDH1 mutation. (G) Schematic representation of the CRISPR-Cas9 gene-editing technique in mutating the IDH1 gene. (H) Sequencing result of the IDH1 gene before (upper) and after (lower) the CRISP-Cas9 gene editing. (I) An MTT assay was applied to detect the cell growth difference between wild-type IDH1 (IDH1WT) and IDH1R132H QBC939 cells. (J) Colony formation was conducted to confirm cell growth between IDH1WT and IDH1R132H QBC939 cells. For (B), (D), (F), and (J), quantitation is at the right and presented as mean ± SD (n = 3). ∗p < 0.05, ∗∗p < 0.01; NS, not significant.
Figure 2
Figure 2
ERα is involved in R-2HG suppression of CCA cell growth via decreasing ERα expression (A) We extracted 738 differential genes from a microarray dataset (GEO: GSE107102). Red represents high overexpression, and green represents lower expression of ERα. (B) Top 20 enrichment pathways from the 738 differential genes. (C) ERα, HIF-1α, and GJA1 genes were obtained through overlapping the top four pathways of size related to proliferation. (D) According to overall survival (12 months [12MTH]), TCGA data was divided into two groups; then, we checked the differential expression of three genes (ERα, GJA1, and HIF-1α) between the two groups. (E) ERα expression comparing patients with IDH1/2WT versus mutant IDH1/2 (IDH1/2MUT). (F) Western blot was conducted to examine ERα expression between DMSO and R-2HG treatment in QBC939 and HuCCT1 cell lines. Quantitation in the lower panel. (G and H) Cell proliferation results of HuCCT1 cells transfected with/without (w/wo) oeERα (overexpressing ERα) and subsequently treated with DMSO or R-2HG are shown by an MTT assay (G) and sphere formation with quantitation at the right (H). (I) Western blot was used to detect AR, ERα, and TR4 expression in QBC939 cells treated with R-2HG. (J) QBC939 cells transfected w/wo shERα (knocked down ERα) and subsequently treated with DMSO or R-2HG, after which an MTT assay was performed to examine cell growth. (K) QBC939 cells transfected w/wo shERα and subsequently electro-transfected w/wo Cas9-IDH1-Puro+template, after which an MTT assay was performed to examine cell growth. Data are presented as mean ± SD (n = 3). ∗p < 0.05, ∗∗p < 0.01; NS, not significant.
Figure 3
Figure 3
R-2HG-reduced ERα can suppress CCA cell growth via altering downstream gene YAP1 expression (A and B) A western blot assay was performed to detect the four potential downstream genes that might be regulated by ERα in QBC939 cells w/wo ERα knockdown (A), and in HuCCT1 cells w/wo ERα overexpression (B). (C–E) QBC939 cells were transfected w/wo shERα and subsequently transfected w/wo oeYAP1, after which an MTT assay (C) and colony formation (D) were performed to examine cell growth. A western blot assay (E) was used to reveal ERα and YAP1 expressions. (F–H) HuCCT1 cells were transfected w/wo oeERα and subsequently transfected w/wo shYAP1, after which an MTT assay (F) and colony formation (G) were performed to examine cell proliferation, and ERα and YAP1 expressions were detected by a western blot assay (H). (I–K) The results of an MTT assay (I) and colony formation (J) demonstrate the efficiency of cell growth in QBC939 cells w/wo IDH1R132H and transfected w/wo oeYAP1, and ERα and YAP1 expressions were detected by a western blot assay (K) . For (D), (G), and (J), quantitations are at the right and presented as mean ± SD (n = 3). ∗p < 0.05, ∗∗p < 0.01; NS, not significant.
Figure 4
Figure 4
R-2HG/ERα can decrease YAP1 expression via altering miR16-5P expression (A) Real-time PCR showed YAP1 mRNA expression of shERα in QBC939 cells and oeERα in HuCCT1 cells. (B) Real-time PCR detected YAP1 expression in QBC939 and HuCCT1 cells treated w/wo R-2HG. (C) RIP assay to detect the YAP1 mRNA levels in the Argonaute 2 (Ago2) complex in QBC939 cells transfected with pLKO or shERα (left) and in HuCCT1 cells transfected with pWPI or oeERα (right). (D) Quantitative real-time PCR was used to screen seven potential miRNAs that might be able to regulate YAP1 in QBC939 cells transfected with ERα-shRNA or pLKO (left) and HuCCT1 cells transfected with oeERα or pWPI (right). (E) Western blot was used to examine YAP1 expression from the four groups of QBC939 cells as indicated (with shERα+miR16-5p inhibitor, pLKO+miR16-5p inhibitor, shERα+Ctrl, or pLKO+Ctrl) (left), and another four groups in HuCCT1 cells as indicated (oemiR16-5p+pWPI, oemiR16-5p+oeERα, pLKO+pWPI, pLKO+oeERα) (right). (F) MTT (left) and colony formation (middle) assays were performed in QBC939 cells transfected w/wo shERα and w/wo miR16-5p inhibitor as indicated (left) and in four groups of HuCCT1 cells as indicated (middle). (G) MTT (left) and colony formation (middle) assays were performed in 4 groups of HuCCT1 cells as indicated. For (E, F, and G), quantitations are at the right and presented as mean ± SD (n = 3). ∗p < 0.05, ∗∗p < 0.01; NS, not significant.
Figure 5
Figure 5
ERα may transcriptionally regulate miR16-5p, and miR16-5p may directly target the 3′ UTR of YAP1-mRNA to suppress its protein expression (A) Two putative EREs predicted by JASPAR from the miR16-1 promoter. (B) ChIP assay results of ERE1/2 of the miR16-1 promoter in QBC939 cells. (C) Wild-type and mutant pGL3-miR16-1 promoter reporter constructs. (D) Luciferase activity after transfection of wild-type or mutant EREs on miR16-1 promoter reporter construct in HuCCT1 cells (left) transfected with ERα-cDNA (oeERα) or pWPI and QBC939 cells (right) transfected with ERα-shRNA (shERα) or vector pLKO. (E) Sequence alignment of the YAP1 3′ UTR with wild-type versus mutant potential miR16-5p targeting sites. (F) Luciferase reporter activity after transfection of wild-type or mutant YAP1 3′ UTR reporter construct in HuCCT1 cells w/wo oemiR16-5p (left) and QBC939 cells treated w/wo miR16-5p inhibitor (right). For (D) and (F), quantitations are presented as mean ± SD. ∗p < 0.05; NS, not significant.
Figure 6
Figure 6
R-2HG can suppress ERα expression via inducing high RNA-m6A methylation (A) Quantitative real-time PCR was conducted to detect ERα mRNA expression in HuCCT1 cells and QBC939 cells treated with R-2HG. (B) Quantitative real-time PCR was conducted to detect ERα mRNA expression in QBC939 cells with/without (w/wo) IDH1R132H. (C) The ERα mRNA level was detected in the Ago2 complex and IGF2BP3 complex using a RIP assay in HuCCT1 cells treated with DMSO or R-2HG. (D) ERα protein stability test using cycloheximide (CHX) treatment in HuCCT1 cells treated w/wo R-2HG (left) and quantitation at the right. (E) Quantitative real-time PCR showed 18S rRNA levels in the ERα mRNA-biotin pull-down complex in QBC939 cells treated w/wo R-2HG. (F) The ERα mRNA level was detected in the anti-m6A complex using a RIP assay in QBC939 cells treated w/wo R-2HG. (G) FTO expression in QBC939 (upper) and HuCCT1 (lower) cells after R-2HG treatment. (H) QBC939 cells transfected w/wo shFTO and subsequently treated w/wo R-2HG, after which an MTT assay was performed to examine cell growth. (I) The methylation of ERα mRNA could change its protein expression. A western blot was used to examine ERα expression from the four groups as indicated in QBC939 cells (upper) with quantitation in the lower panel. (J) We knocked down FTO in QBC939 cells and then divided cells into three groups and transfected them with pWPI, oeERαWT, or mutant oeERα (oeERαMT). A western blot was used to detect ERα expression. (K) MTT assay was conducted to examine cell growth among the three groups as indicated in QBC939 cells. Quantitations are presented as mean ± SD. ∗p < 0.05, ∗∗p < 0.01; NS, not significant.
Figure 7
Figure 7
In vivo mouse tumor model showing that the R-2HG-downregulated ERα signals could modulate tumor growth (A) The QBC939 cells transfected with IDH1WT+pLKO, IDH1WT+shERα, IDH1R132H+pLKO, or IDH1R132H+shERα were subcutaneously implanted into female nude mice, and tumor sizes were measured weekly. After 8 weeks, the mice were sacrificed and the tumor growth rates of different groups were compared. (B) Gross comparison of CCA tumor size in the four groups of mice. (C) Quantification of tumor weights. (D) Representative images of the immunohistochemistry staining of YAP1 in each group. Brown signals indicate the positive YAP1 staining. (E) Two samples from each tumor group were randomly chosen to detect YAP1 and ERα using a western blot. (F) Schematic model of modulating the FTO/m6A methylated ERα/miR16-5p/YAP1 signaling by the oncometabolite R-2HG to suppress CCA growth. Quantitations are presented as mean ± SD. ∗p < 0.05, ∗∗p < 0.01; NS, not significant.

Similar articles

Cited by

References

    1. Razumilava N., Gores G.J. Cholangiocarcinoma. Lancet. 2014;383:2168–2179. - PMC - PubMed
    1. Khan S.A., Thomas H.C., Davidson B.R., Taylor-Robinson S.D. Cholangiocarcinoma. Lancet. 2005;366:1303–1314. - PubMed
    1. Watanapa P. Cholangiocarcinoma in patients with opisthorchiasis. Br. J. Surg. 1996;83:1062–1064. - PubMed
    1. Dreyer C., Le Tourneau C., Faivre S., Qian Z., Degos F., Vuillerme M.P., Paradis V., Hammel P., Ruszniewski P., Cortes A. [Cholangiocarcinoma: epidemiology and global management] Rev. Med. Interne. 2008;29:642–651. - PubMed
    1. El-Diwany R., Pawlik T.M., Ejaz A. Intrahepatic cholangiocarcinoma. Surg. Oncol. Clin. N. Am. 2019;28:587–599. - PubMed