. 2021 Sep 22:5:287.
doi: 10.12688/wellcomeopenres.16320.2. eCollection 2020.

Haplotype heterogeneity and low linkage disequilibrium reduce reliable prediction of genotypes for the ‑α 3.7I form of α-thalassaemia using genome-wide microarray data

Affiliations

Haplotype heterogeneity and low linkage disequilibrium reduce reliable prediction of genotypes for the ‑α 3.7I form of α-thalassaemia using genome-wide microarray data

Carolyne M Ndila et al. Wellcome Open Res. .

Abstract

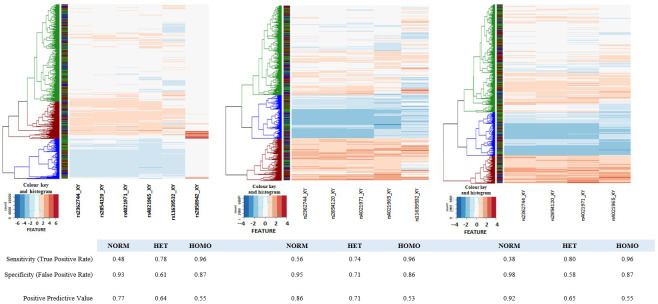
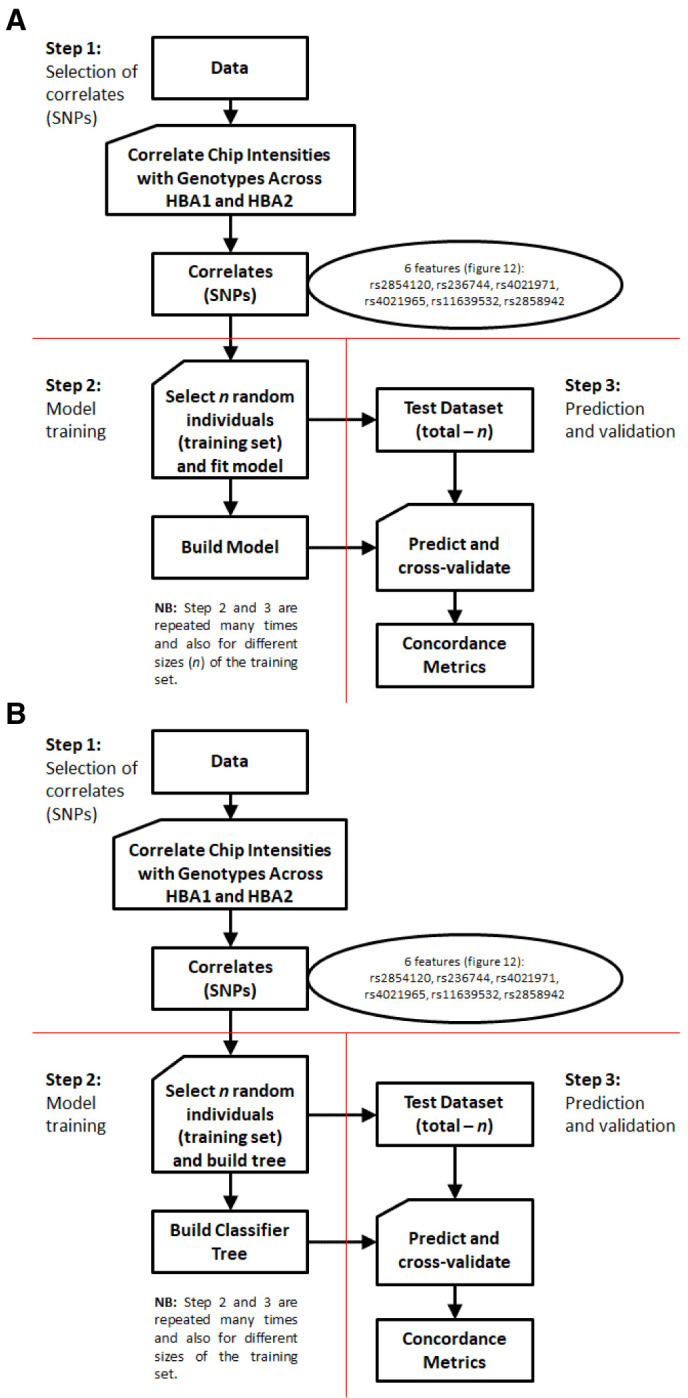
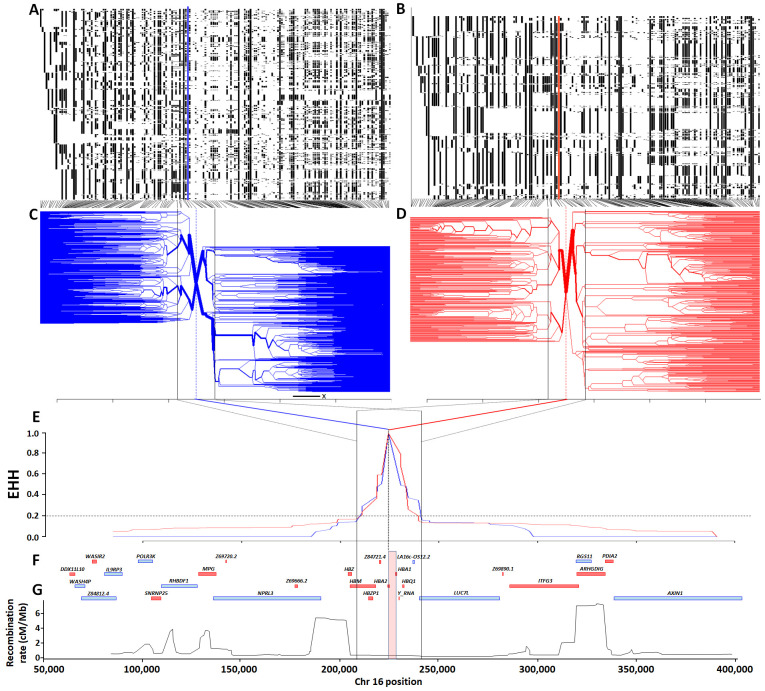
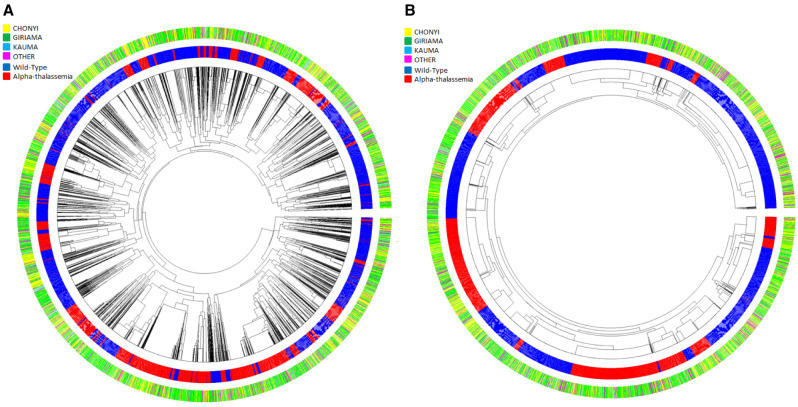
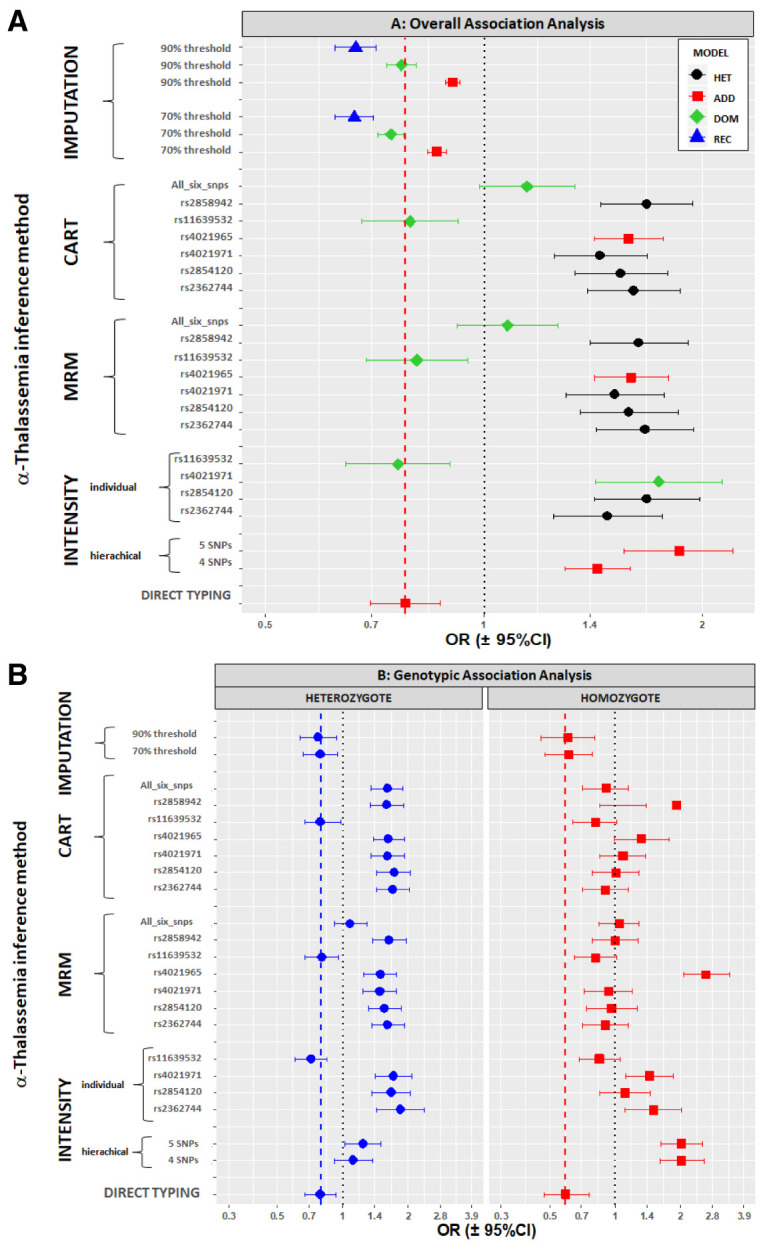
Background: The -α 3.7I-thalassaemia deletion is very common throughout Africa because it protects against malaria. When undertaking studies to investigate human genetic adaptations to malaria or other diseases, it is important to account for any confounding effects of α-thalassaemia to rule out spurious associations. Methods: In this study, we have used direct α-thalassaemia genotyping to understand why GWAS data from a large malaria association study in Kilifi Kenya did not identify the α-thalassaemia signal. We then explored the potential use of a number of new approaches to using GWAS data for imputing α-thalassaemia as an alternative to direct genotyping by PCR. Results: We found very low linkage-disequilibrium of the directly typed data with the GWAS SNP markers around α-thalassaemia and across the haemoglobin-alpha ( HBA) gene region, which along with a complex haplotype structure, could explain the lack of an association signal from the GWAS SNP data. Some indirect typing methods gave results that were in broad agreement with those derived from direct genotyping and could identify an association signal, but none were sufficiently accurate to allow correct interpretation compared with direct typing, leading to confusing or erroneous results. Conclusions: We conclude that going forwards, direct typing methods such as PCR will still be required to account for α-thalassaemia in GWAS studies.

Keywords: Classification and Regression Tree; GWAS; Malaria; Predictive Models; haplotypes; multinomial regression-model; α-thalassaemia.


Conflict of interest statement

No competing interests were disclosed.

Figures

Figure 1.
Figure 1.. Schematic of the HBA region on human chromosome 16.
A: Representation of human chromosome 16 showing the location of the HBA gene region at the p-telomere end (red box). B: The 400kb chromosome region spanned by the SNPs used in this study (16:83,000-400,000) approximately centres around the HBA gene region (red box). C: Chromosome 16:200000-235000 spanning the classical HBA gene region, comprising HBZ [ζ2], HBZP1 [ψζ1], HBM [ψα1], HBA2 [α2], HBA1 [α1] and HBQ1 [θ1]. The -α -3.7I deletion is highlighted between HBA1 and HBA2. D: HBA1 and HBA2 genes showing the location of the primers used for genotyping and Sanger sequencing (see methods and Extended Data); the region of the -α -3.7I deletion; and 15 bases/features that show paralogous differences in the human reference genome between HBA1 and HBA2 sequences and used to identify the -α -3.7 Type I breakpoint (Extended Data).
Figure 2.
Figure 2.. Sequence alignment from Clustal Omega across HBA2 and HBA1 on human chromosome 16 (Sequence data from Ensemble GRCH37).
Sequences were aligned in chromosomal order ( HBA2 [prefix 'A2_16_'] above HBA1 [prefix 'A1_16_']). The HBA2 sequences starts at the 5'-most base of the forward PCR primer (A2/3.7-F position 16:221882) in a unique region and 86 bases 5' of the homologous region with HBA1. The HBA1 sequence starts at position 16:225474 which is 319 bases from the equivalent homologous region with HBA2. The HBA2 sequence ends at position 16:223809 effectively at the end of the homologous region with HBA1, while the HBA1 sequences ends at position 16:22773 and the PCR reverse primer (3.7-R). PCR and sequencing primers ( Table 2) are highlighted (A2/3.7-R,HBA-5'-SEQ-REV, HBA-3'SEQ-FWD and 3.7-R) as are key restriction sites . Paralogous differences between HBA1 and HBA2 reference sequences are highlighted in green for a set of 14 positions. These were used to help identify the -α 3.7 deletion type from Sanger sequencing. The HBA genic region is coloured and shows the transcription start site (TSS), amino-terminal methionine (ATG) and stop codons (TAA); but not separate introns and exons for clarity. The four restriction sites used to distinguish the -α 3.7 deletion types are identified ; the Type I breakpoint was identified as being 5' of the ApaI/IVS2 sequence; the Type II breakpoint lies between the ApaI/IVS2 and BalI restriction sites; The Type III lies between the RsaI and the 'end of HBA duplication unit' (location and identity of HBA duplication unit ). NB: The ApaI/IVS2 sequence comparison between HBA2 and HBA1 has been aligned here to clearly highlight the ApaI restriction site; it may be shown differently in other publications.
Figure 3.
Figure 3.. Map of the HBA region on human chromosome 16 identifying Illumina chip features flanking and internal to the α -3.7kb deletion.
Ensembl GRCh37 chromosome 16 HBA region; Illumina HumanOmni2.5-4 feature match; (red boxes are perfect match of probe with ref sequence; Black boxes are lesser matches; boxes on same row/level are from same probe); SNP name boxes have GRCh37 positions; Green boxes are six features within the deletion region while the three brown boxes are the SNPs immediately flanking the region. Non-highlighted labels are other blast hits. Yellow boxes show regions of breakpoints/crossovers for the three known types of -α 3.7kb deletion; Homology boxes X, Y and Z indicated as per Hess et al. .
Figure 4.
Figure 4.. Chip Intensity (sum[X and Y] channels) density plots for features internal and immediately flanking the α -3.7 deletion.
Features filled in blue are flanking to the deletion (rs2972771 and kgp4999044 are present in the haplotype SNP data, rs2541670 did not pass QC). Features filled in red are within the -α 3.7 deletion. Vertical lines illustrate where both a trough and shoulder are discernible in the distribution and potentially infer the breaks between genotypic groups; rs2362744 0.211 and 0.738; rs2854120 0.215 and 0.869; rs4021971 0.199 and 0.538; rs11639532 0.131 and 0.358.
Figure 5.
Figure 5.. Heatmaps of core deletion feature intensities.
Heatmaps were generated for four, five and six SNP features inside the -α 3.7I deletion region. Sample-intensities were clustered as shown by the dendrograms at the left side of each panel and genotypes assigned (Blue: Homo, Green: Het, Red: Norm). In each case the intensities between SNPs were normalised to create a common intensity profile (Colour key and Histogram inset at the bottom left of each panel). Left-hand panel: all six SNP-features; Middle panel: five SNP-features with rs2858942 removed; Right-hand panel: four SNP-features with rs2858942 and rs11639532 removed. The ribbon between the dendrogram and the SNP features show the directly-typed genotype assignments in the same colour scheme.
Figure 6.
Figure 6.. Multiple-Regression Model (MRM) and Classification And Regression Tree (CART) process flows.
A: MRM process flow. This is a simple extension of binary logistic regression that allows for more than two categories of the dependent or outcome variable. The model can then be applied to new explanatory variables (i.e. without known genotypes) to predict unknown genotypes B: CART process flow. This method builds a binary decision tree (i.e. a series of evaluations based on a single concomitant variable at each point) and aims to split the data such that there is maximal separation of individuals in terms of the variable of interest. At each point, the evaluation of an individual is either positive or negative and the procedure seeks a cut-off point for a range of values of the concomitant variable such that the positive and negative groups contain maximal number of individuals of the same type. These learned series of evaluations can then be applied to a new set of individuals with concomitant variables known (without known types) to predict their unknown types. Here the concomitant variables are the intensities while the “types” are genotypes.
Figure 7.
Figure 7.. Haplotype, extended haplotype homozygosity (EHH) and bifurcation diagrams for the HBA region in Kilifi, Kenya.
Panels A and B show haplotype maps for the -α 3.7I-reference and -α 3.7I-deletion haplotypes respectively (chromosomes are aligned as rows and SNPs in columns; white = reference and black = alternate), while panels C and D show corresponding bifurcation diagrams for the -α 3.7I-reference and -α 3.7I-deletion haplotypes respectively. Panel E shows EHH plots for -α 3.7I-reference and -α 3.7I-deletion haplotypes with the deletion allele as the focal point. Panels F and G show a gene map, and a recombination map based on African sequence data. The red and blue vertical lines in panels C and D denote the position of the -α 3.7I–INDEL, as does the pink vertical box in panel G which is scaled to the width of the deletion.
Figure 8.
Figure 8.. Circular haplotype dendrograms for polymorphisms across the HBA region of chromosome 16 for 6072 chromosomes from coastal Kenyan individuals.
A: Haplotype dendrogram for the full haplotypes of 179 polymorphisms (chr16:84870-398421). B: Haplotype dendrogram for the core 33kb region surrounding the -α 3.7 deletion (16:207909-241210). Centre shows the dendrogram; middle ring shows individual haplotypes (blue = wt, red = α-thalassaemia); outer ring shows the four major ethnic groupings [Yellow = Chonyi, Green = Giriama, Light Blue = Kauma and Magenta = 'other' groups.
Figure 9.
Figure 9.. Circular dendrograms of 'core' HBA regional haplotypes (Chr16:207,909-241,210 comprising 178 polymorphisms and the α -3.7I polymorphism) by ethnicity in Kilifi, Kenya.
This core region is defined by the EHH signal > 0.2 (Extended Data Figure 2). A: Full haplotypes for 178 SNPs and the -α 3.7I-thalassaemia locus for the Kauma ethnic group. B: Full haplotypes for 178 SNPs and the -α 3.7I-thalassaemia locus for the Chonyi ethnic group. C: Full haplotypes for 178 SNPs and the -α 3.7I-thalassaemia locus for the Giriama ethnic group. D: Full haplotypes for 178 SNPs and the -α -3.7I-thalassaemia locus for other ethnic groups having too few haplotypes per group to display individually. -α 3.7I-reference (BLUE) and -α 3.7I-deletion (RED) haplotypes.
Figure 10.
Figure 10.. The association between the -α 3.7I deletion and SNPs within the surrounding region with severe malaria.
Panel A shows pairwise squared correlations (r 2) between genotypes at regional variants. Black lines denote the values for -α 3.7I deletion for SNPs within the region. The angled lines at the base of the linkage disequilibrium map identify each SNP and where it aligns to the chromosome. Panel B shows a Manhattan plot illustrating the p-values for the associations between individual SNPs within the HBA region and severe falciparum malaria; the horizontal dotted line shows the Bonferroni-correction significance threshold (p<0.0003); r 2 shows the correlation between α-thalassaemia and the other SNPs. Panels C and D show the gene map and recombination map, respectively. The pink vertical box in panels B, C and D shows the location of -α 3.7I deletion.
Figure 11.
Figure 11.. Mean of the Sum(X + Y) intensities for 3036 samples for SNP features on chromosome 16.
A: Mean channel intensities (X + Y) for 3036 samples used in the study, averaged over 100kb bins for chromosome16 B: Mean channel intensities (X + Y) for 3036 samples for individual SNPs in the 5’ 0-1Mb telomereic region of chromosome 16 C: Mean channel intensities (X + Y) for 3036 samples for individual SNPs in the HBA gene region of chromosome 16 The red rectangle in each plot shows the location of the -a 3.7 deletion.
Figure 12.
Figure 12.. Intensity plots of the Illumina 2.5M chip features across the -α 3.7kb deletion.
A: Map of the Human HBA2 and HBA1 region on chromosome 16 ( http://www.ensembl.org/index.html), with respect to the forward strand (GRCh37 coordinates). B: Primers used for the α WT and -α 3.7kb deletion are shown by red arrows below the gene map (A2/3.7 FWD, A2 REV, 3.7 REV). C: The -α 3.7 deletions are shown below the gene map and are highlighted according to Hill et al. and data from this study (see main text). D: Feature probes with 100% match to the reference sequence are shown below the gene map by red boxes with a black vertical line. E: Coordinates for each feature are given for both GRCh37 and GRCH38 coordinates. F: Plots of the sum of the X + Y channel intensities (Y-axis) from the chip and PCR-typed genotype (X-axis) for each SNP (αα/αα WT; -α/αα -3.7kb HET, -α/-α -3.7kb HOM).
Figure 13.
Figure 13.
Association of α-thalassaemia with severe malaria by an overall test ( A) and by genotypic tests ( B). We used various methods to infer α-thalassaemia genotypes and then tested for association with severe malaria as detailed in the y-axis labels (see also main text). For the imputation results, these are mean results across the 1000 runs (see Methods); overall association results are split by the best association model results from each run while genotypic results are for all runs (Extended Data Section 6). The black dashed vertical line shows the no-effect position, while the red or blue vertical dashed lines show the direct typing effects.

References

    1. Flint J, Hill AV, Bowden DK, et al. : High frequencies of alpha-thalassaemia are the result of natural selection by malaria. Nature. 1986;321(6072):744–750. 10.1038/321744a0 - DOI - PubMed
    1. Sepúlveda N, Manjurano A, Drakeley C, et al. : On the performance of multiple imputation based on chained equations in tackling missing data of the African alpha3.7 -globin deletion in a malaria association study. Ann Hum Genet. 2014;78(4):277–289. 10.1111/ahg.12065 - DOI - PMC - PubMed
    1. Malaria Genomic Epidemiology Network: Insights into malaria susceptibility using genome-wide data on 17,000 individuals from Africa, Asia and Oceania. Nat Commun. 2019;10(1):5732. 10.1038/s41467-019-13480-z - DOI - PMC - PubMed
    1. Weatherall DJ, Clegg JB: The thalassaemia syndromes. Blackwell Scientific Publications, Oxford,2002. 10.1002/9780470696705 - DOI
    1. Lam KW, Jeffreys AJ: Processes of copy-number change in human DNA: the dynamics of {alpha}-globin gene deletion. Proc Natl Acad Sci U S A. 2006;103(24):8921–8927. 10.1073/pnas.0602690103 - DOI - PMC - PubMed