. 2021 Nov 19;24(11):103215.
doi: 10.1016/j.isci.2021.103215. Epub 2021 Oct 2.

The immune landscape of SARS-CoV-2-associated Multisystem Inflammatory Syndrome in Children (MIS-C) from acute disease to recovery

Affiliations

The immune landscape of SARS-CoV-2-associated Multisystem Inflammatory Syndrome in Children (MIS-C) from acute disease to recovery

Eleni Syrimi et al. iScience. .

Abstract

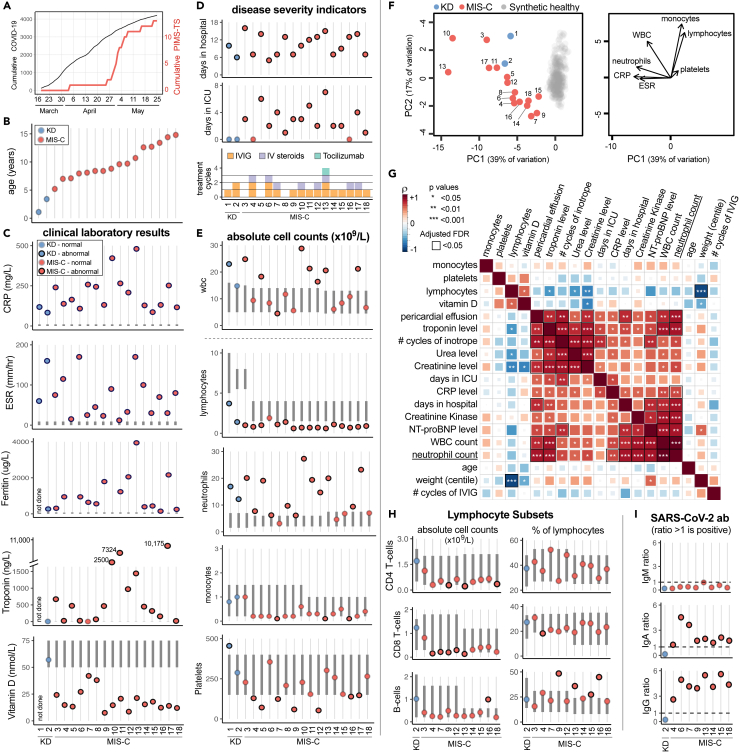
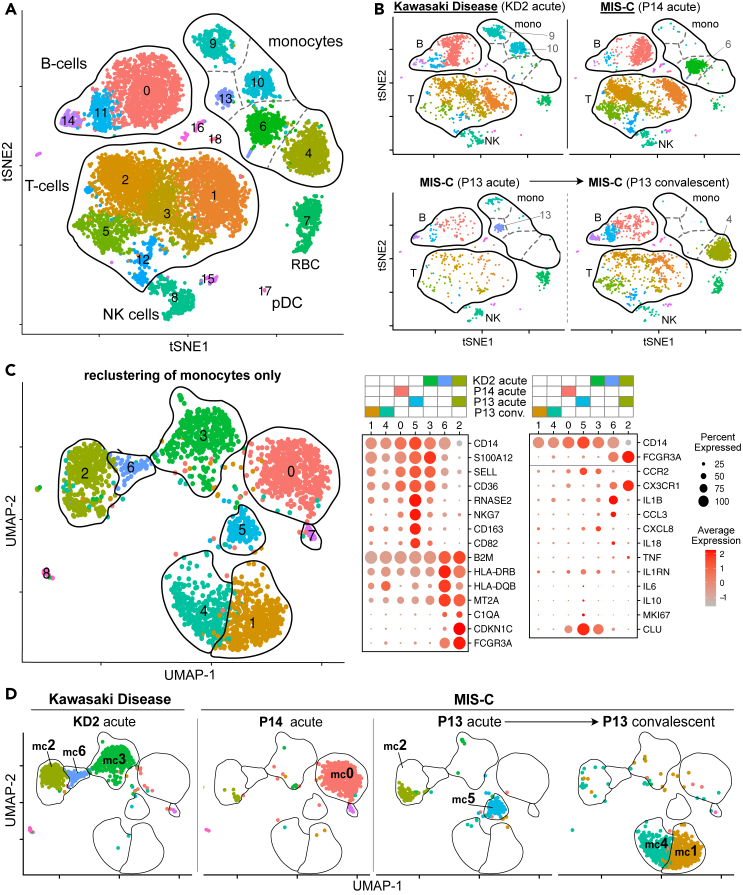
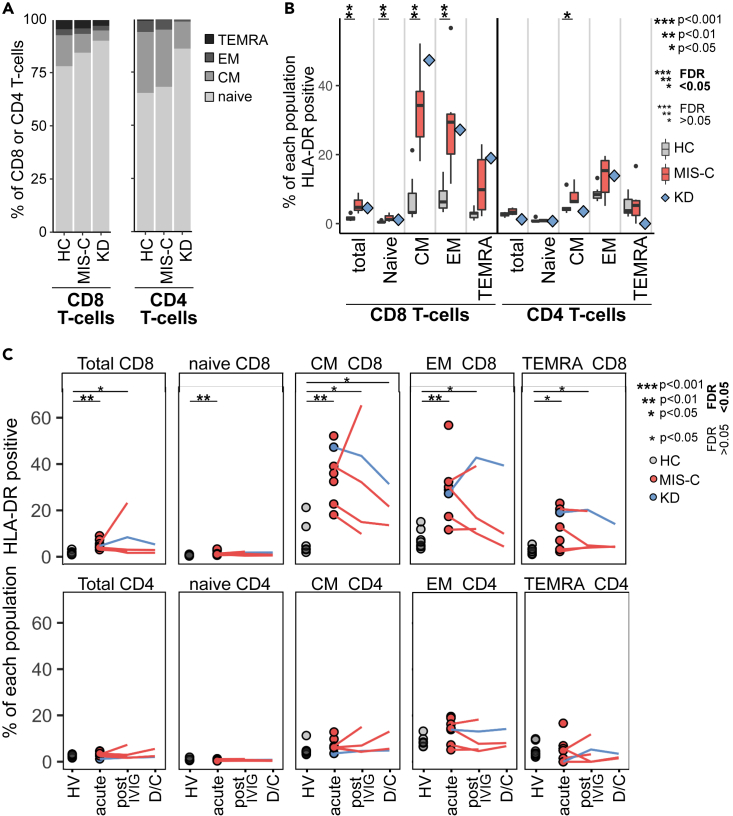
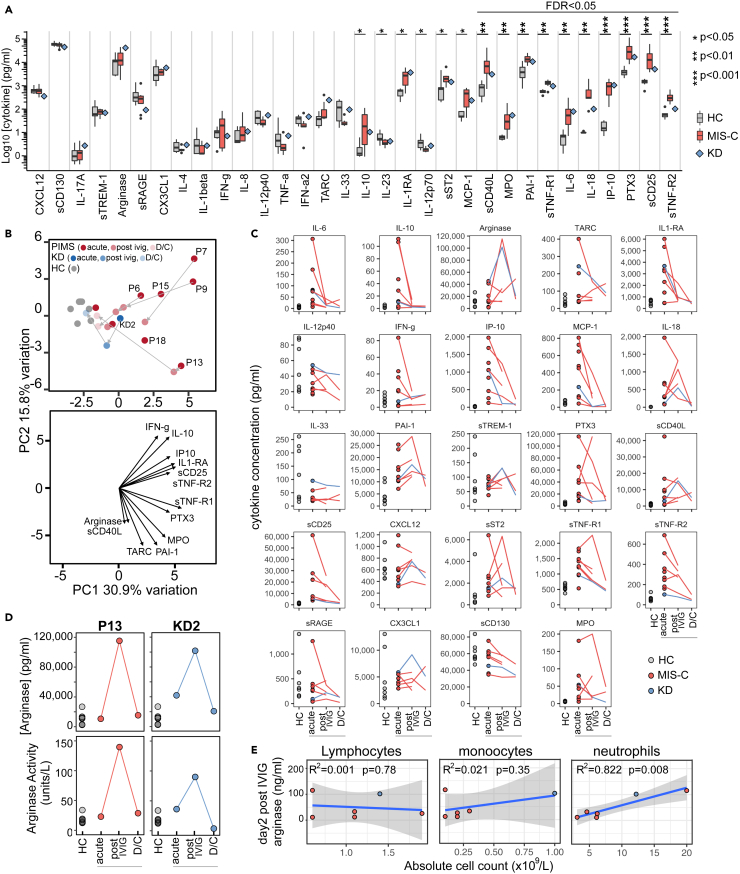
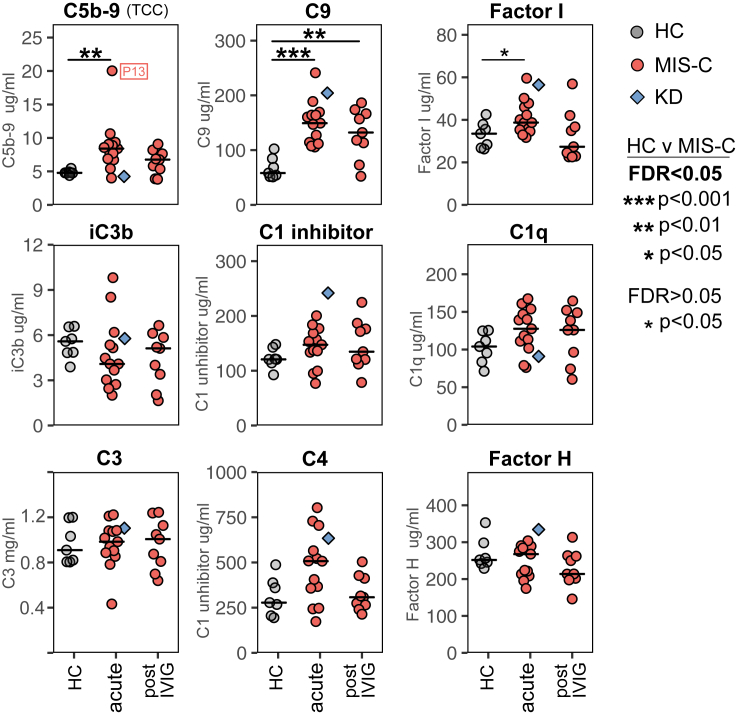
Multisystem inflammatory syndrome in children (MIS-C) is a life-threatening disease occurring several weeks after severe acute respiratory syndrome coronavirus 2 (SARS-CoV-2) infection. Deep immune profiling showed acute MIS-C patients had highly activated neutrophils, classical monocytes and memory CD8+ T-cells, with increased frequencies of B-cell plasmablasts and double-negative B-cells. Post treatment samples from the same patients, taken during symptom resolution, identified recovery-associated immune features including increased monocyte CD163 levels, emergence of a new population of immature neutrophils and, in some patients, transiently increased plasma arginase. Plasma profiling identified multiple features shared by MIS-C, Kawasaki Disease and COVID-19 and that therapeutic inhibition of IL-6 may be preferable to IL-1 or TNF-α. We identified several potential mechanisms of action for IVIG, the most commonly used drug to treat MIS-C. Finally, we showed systemic complement activation with high plasma C5b-9 levels is common in MIS-C suggesting complement inhibitors could be used to treat the disease.

Keywords: Genomics; Immune response; Immune system disorder; Immunology.


Conflict of interest statement

The authors declare no competing interests.

Figures

None
Graphical abstract
Figure 1
Figure 1
Demographic, clinical and immunological status of 18 pediatric patients with Kawasaki disease or MIS-C (A) Cumulative SARS-CoV-2 positive cases identified by PCR testing within the Birmingham area compared to MIS-C cases admitted to Birmingham Children's Hospital PICU. (B) Age of KD and MIS-C patients recruited to this study. (C) Clinical laboratory results shown for C-reactive protein (CRP), erythrocyte sedimentation rate (ESR), ferritin, troponin, and vitamin D. (D) Disease severity indicators shown as days hospitalized, days in PICU and treatment cycles of IVIG, intravenous steroids, and Tocilizumab. (E) Pretreatment absolute count of different immune cell subsets expressed as 109 cells/L. (F) Left: Principal component analysis biplot of clinical laboratory features for patients with MIS-C or KD and synthetic healthy controls derived from normal range data. Right: Loading plot showing the top 7 features contributing to principal components one and two. (G) Correlation matrix of clinical features, immune parameters and demographics for the 16 MIS-C patients. The strength of each correlation is indicated by color and statistical significance by asterisks: ∗p < 0.05, ∗∗P < 0.01, ∗∗∗P < 0.001. Black outline indicates a significant result after 5% false discovery rate correction using the Benjamini-Hochberg method. (H) Pretreatment frequency of lymphocyte subsets expressed as the absolute number of cells x109/L (left column) or percentage of total lymphocytes (right column). (I) SARS-CoV-2 ab responses for IgM, IgA, and IgG. In panels C, E, and H the normal range for each patient, based on their age, is shown by the vertical dark gray bar. Data points outside the normal range are drawn with a black outline. See also Figure S1.
Figure 2
Figure 2
Single cell RNA sequence analysis of MIS-C and KD PBMC (A) tSNE representation of major cell types and associated FlowSOM clusters in acute stage PBMCs from patients KD2, P13, and P14 and a convalescent sample from P13 at discharge from PICU. All four samples were processed and sequenced in a single experiment. (B) tSNE representation of PBMCs from each patient sample. (C) UMAP representation of monocyte cells after re-clustering on monocytes alone in acute stage samples from patients KD2, P13, and P14 and a convalescent sample from P13 at discharge from PICU. Right hand panel shows the expression level of selected genes within each cluster. (D) UMAP representation of monocyte clusters from each patient sample. See also Figures S2–S8.
Figure 3
Figure 3
Mass cytometry analysis of mononuclear cells in whole blood samples from healthy children and patients with MIS-C or KD (A) tSNE plots of concatenated flow cytometry data from six MIS-C patients or one KD patient at the acute stage of their disease alongside seven healthy children (HC). Each meta-cluster is represented by a different color and key populations are indicated on the plots. Results from these concatenated datafiles are shown throughout this figure. (B) The frequency of each FlowSOM metacluster in the same donors expressed as a percentage of total non-granulocyte mononuclear cells are shown as box and whisker plots (healthy children and MIS-C) or a blue diamond (KD patient KD2). Results of Wilcoxon rank-sum tests comparing the frequency of each cluster in healthy children to the frequency in acute MIS-C patients are indicated by: ∗p < 0.05, ∗∗p < 0.01, ∗∗∗p < 0.001. Non-significant results are not shown and emboldened p value symbols indicate significant results after 5% false discovery rate correction using the Benjamini-Hochberg method. (C) tSNE plots showing cells within monocyte clusters 17, 20 and 12 for MIS-C patients at the acute stage, post IVIG and at discharge from PICU alongside plots showing cells from a single KD patient or seven healthy children. (D) Trajectory of each of the three monocyte clusters over time in seven healthy children or MIS-C patients over time (acute stage, post IVIG, and PICU discharge). Data from patient P13 is indicated on the plots. (E) Heatmaps showing the median metal intensity (MMI) of markers expressed on monocyte clusters 17, 20, and 12. (F) Biaxial plots of CD64 and CD163 expression on cluster 17 monocytes cells in healthy children or patients with MIS-C or KD at the acute, post-IVIG, or PICU/hospital discharge stages of disease. Note that all data in the Figure were generated from the same seven healthy children, six MIS-C patients (6 acute stage, 4 post IVIG, and 2 discharge samples) or a single KD patient. See also Figures S8–S10.
Figure 4
Figure 4
Mass cytometry of mononuclear cells analyzed by manual gating on canonical T cell subpopulations (A) Percentage of CD8+ and CD4+ T-cells in each of the four canonical T cell sub-populations for seven healthy children, six acute MIS-C patients or a single acute KD patient. (B) The percentage of each T cell subpopulation (from the same donors shown in panel A) that were positive for HLA-DR are shown as box and whisker plots (health donors or MIS-C patients) or a blue diamond (KD patient KD2). (C) Percentage of each T cell subpopulation positive for HLA-DR over the course of disease. For all panels the data were from seven healthy children, six MIS-C patients (6 acute stage, 4 post IVIG and 2 discharge (D/C) samples) or a single KD patient. In panels B and C the results of Wilcoxon ranked sum tests comparing the frequency of each cluster in healthy children to MIS-C patients (acute stage only in panel B or acute, post-IVIG or discharge stages in panel C) are indicated: ∗p < 0.05, ∗∗p < 0.01, ∗∗∗p < 0.001. Non-significant results are not shown. Emboldened p value symbols indicate significant results after 5% false discovery rate correction using the Benjamini-Hochberg method. See also Figure S11.
Figure 5
Figure 5
Mass cytometry analysis of granulocytes in whole blood samples from healthy children and patients with MIS-C or KD (A) Gating strategy used to manually gate and analyze neutrophil activation in whole blood. (B) Heatmaps showing median metal intensity (MMI) of markers expressed on manually gated neutrophils. Data are from concatenated FCS files from seven healthy children, six MIS-C patients (acute n = 6, post-IVIG n = 4, discharge n = 2) and a single KD patient (KD2). (C) tSNE plots of granulocytes from the same donors analyzed by unsupervised clustering. Top row: FlowSom metaclusters. Middle row: CD64 expression. Bottom row: CD10 expression. (D) Upper panels: heatmaps showing expression level of different markers in each metacluster for the same donors. Lower panels: Trajectory of each metacluster over time, expressed as a percentage of total granulocytes, for each of the healthy children and patients. The results of Wilcoxon ranked sum tests comparing the frequency of each cluster in healthy children to seven patients (six MIS-C and one KD patient) at the acute (n = 7), post-IVIG (n = 5) and discharge (n = 3) timepoints as indicated: ∗p < 0.05, ∗∗p < 0.01, ∗∗∗p < 0.001. Non-significant results are not shown and emboldened p value symbols indicate significant results after 5% false discovery rate correction using the Benjamini-Hochberg method. See also Figure S8.
Figure 6
Figure 6
Analysis of cytokines in plasma samples from healthy children and patients (A) Levels of cytokines in plasma from seven healthy children or eight MIS-C patients at the acute stage of disease are shown as boxes and whiskers alongside a blue diamond indicating results from a single KD patient (KD2) also at the acute stage. Results of Wilcoxon rank-sum tests comparing the concentration of each cytokine in seven healthy children to the concentration in eight acute MIS-C patients are indicated by: ∗p < 0.05, ∗∗p < 0.01, ∗∗∗p < 0.001. Non-significant results are not shown and emboldened p value symbols indicate significant results after 5% false discovery rate correction using the Benjamini-Hochberg method. (B) Upper panel: principal component analysis biplot of cytokines. Lower panel: loading plot showing the top 13 features contributing to principal components one and two. (C) Trajectory of cytokines over time for the same healthy children and patients shown in panel A at the acute, post-IVIG and discharge timepoints. No statistical testing was performed. (D) Plots showing the concentration (upper panel) and enzyme activity (lower panel) of arginase over time in plasma samples from seven healthy children, MIS-C patient P13 and KD patient KD2. (E) Results of linear regression analysis of the acute disease stage absolute counts of lymphocytes, monocytes or neutrophils against the plasma arginase concentration after IVIG treatment. The R2 and statistical significance of each regression model is shown on the plot with the shaded area indicating the 95% confidence interval. See also Figure S8.
Figure 7
Figure 7
Analysis of complement in plasma samples from healthy children and patients Levels of the indicated complement components (C1q, C3, C4, C9), regulators (factor H, factor I) and activation products (iC3b, C5b-9/TCC) in plasma samples from seven healthy children (HC), thirteen MIS-C patients at the acute stage of disease and nine of these patients shortly after IVIG treatment. The horizontal line indicates the median value for patients and controls. Results of Wilcoxon rank-sum tests comparing the frequency of each cluster in healthy children to that in MIS-C patients at the acute or the post IVIG timepoints are indicated by: ∗p < 0.05, ∗∗p < 0.01, ∗∗∗p < 0.001. Non-significant results are not shown and emboldened p value symbols indicate significant results after 5% false discovery rate correction using the Benjamini-Hochberg method. Also shown on the plot, but not included in the statistical analysis, are the results from a single acute stage KD patient (blue diamond symbol, patient KD2). The level of C5b-9 for patient P13, who had severe disease, is indicated on the plot.

References

    1. Ahmed M., Advani S., Moreira A., Zoretic S., Martinez J., Chorath K., Acosta S., Naqvi R., Burmeister-Morton F., Burmeister F. Multisystem inflammatory syndrome in children: a systematic review. EClinicalMedicine. 2020;26:100527. doi: 10.1016/j.eclinm.2020.100527. - DOI - PMC - PubMed
    1. Auffray C., Fogg D., Garfa M., Elain G., Join-Lambert O., Kayal S., Sarnacki S., Cumano A., Lauvau G., Geissmann F. Monitoring of blood vessels and tissues by a population of monocytes with patrolling behavior. Science. 2007;317:666–670. doi: 10.1126/science.1142883. - DOI - PubMed
    1. Balcewicz-Sablinska M.K., Keane J., Kornfeld H., Remold H.G. Pathogenic Mycobacterium tuberculosis evades apoptosis of host macrophages by release of TNF-R2, resulting in inactivation of TNF-alpha. J. Immunol. 1998;161:2636–2641. - PubMed
    1. Brunetta E., Folci M., Bottazzi B., De Santis M., Gritti G., Protti A., Mapelli S.N., Bonovas S., Piovani D., Leone R. Macrophage expression and prognostic significance of the long pentraxin PTX3 in COVID-19. Nat. Immunol. 2020;22:19–24. doi: 10.1038/s41590-020-00832-x. - DOI - PubMed
    1. Butler A., Hoffman P., Smibert P., Papalexi E., Satija R. Integrating single-cell transcriptomic data across different conditions, technologies, and species. Nat. Biotech. 2018;36:411–420. doi: 10.1038/nbt.4096. - DOI - PMC - PubMed