. 2021 Sep 15;24(10):103133.
doi: 10.1016/j.isci.2021.103133. eCollection 2021 Oct 22.

Cancer cell immune mimicry delineates onco-immunologic modulation

Affiliations

Cancer cell immune mimicry delineates onco-immunologic modulation

Rui Gao et al. iScience. .

Abstract

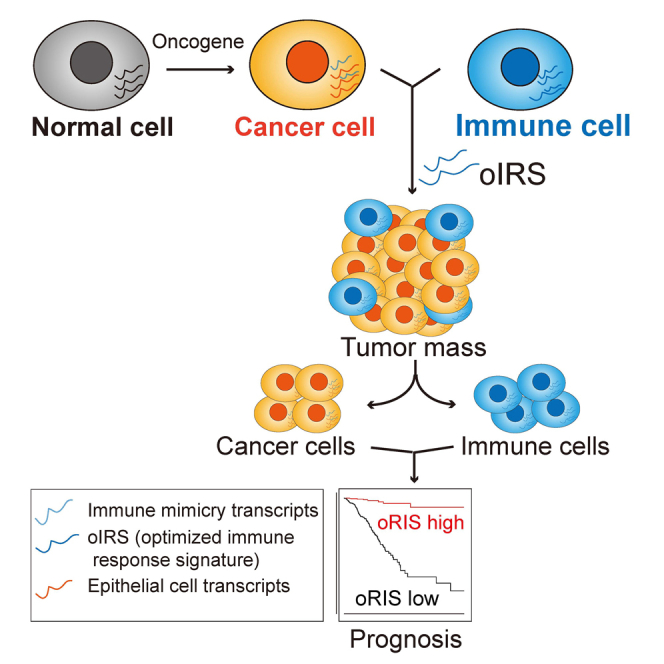
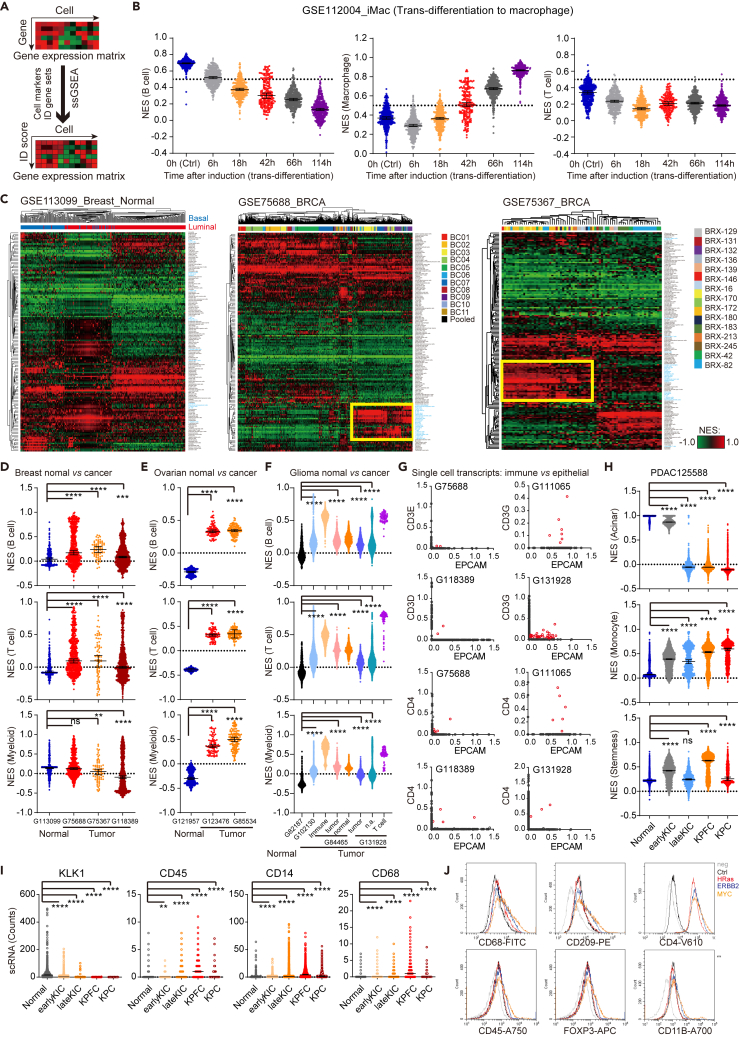
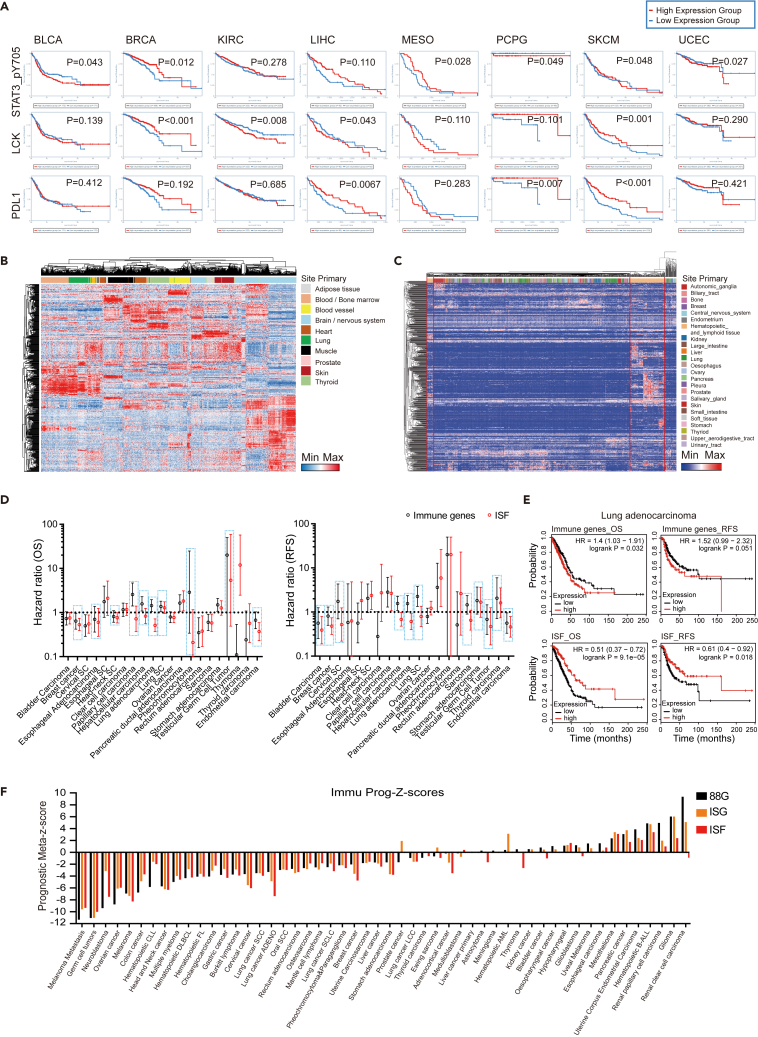
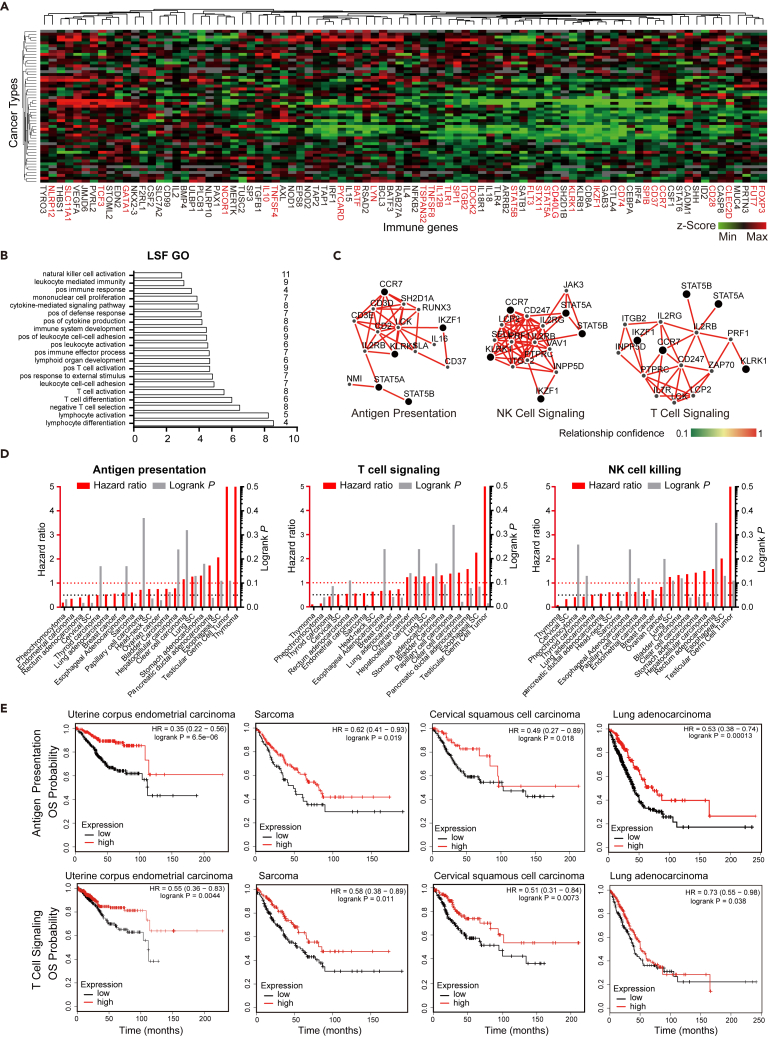
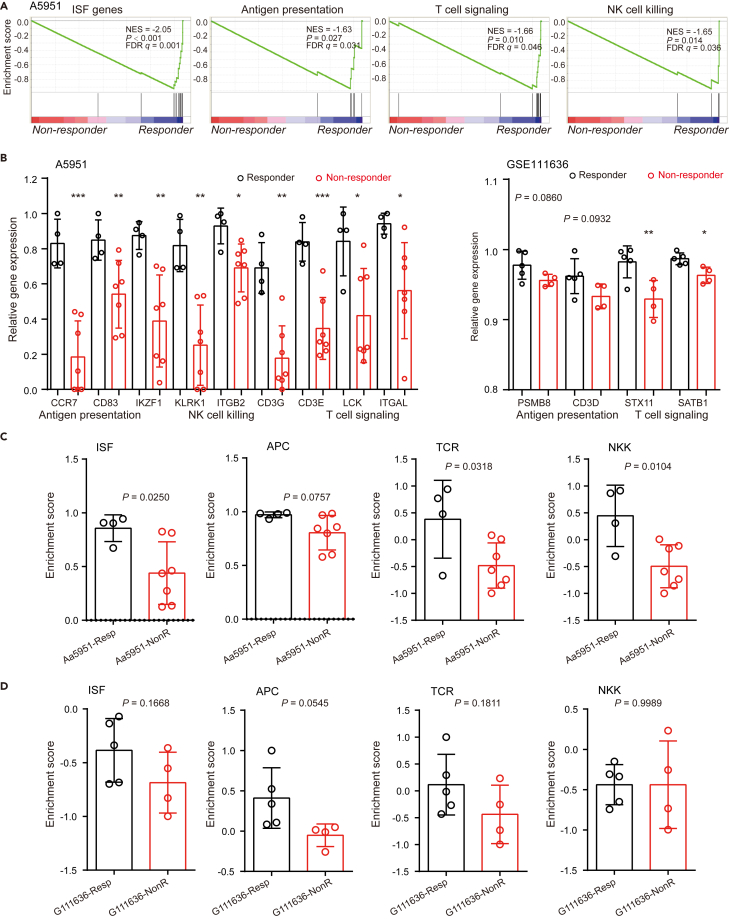
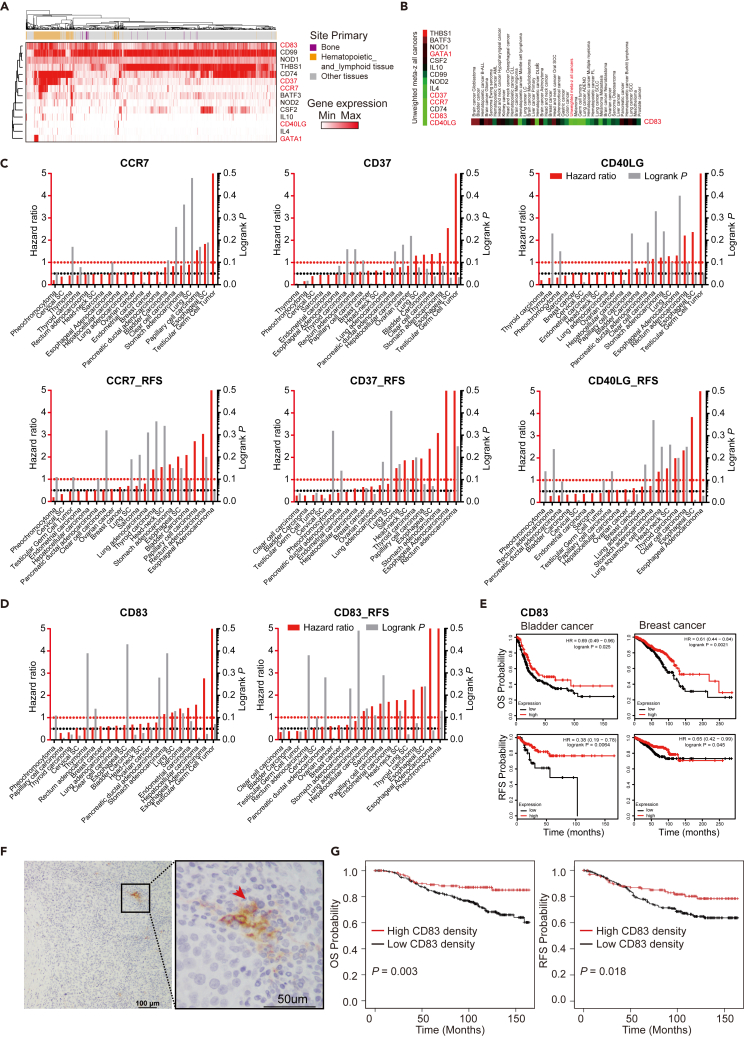
Immune transcripts are essential for depicting onco-immunologic interactions. However, whether cancer cells mimic immune transcripts to reprogram onco-immunologic interaction remains unclear. Here, single-cell transcriptomic analyses of 7,737 normal and 37,476 cancer cells reveal increased immune transcripts in cancer cells. Cells gradually acquire immune transcripts in malignant transformation. Notably, cancer cell-derived immune transcripts contribute to distinct prognoses of immune gene signatures. Optimized immune response signature (oIRS), obtained by excluding cancer-related immune genes from immune gene signatures, and offers a more reliable prognostic value. oIRS reveals that antigen presentation, NK cell killing and T cell signaling are associated with favorable prognosis. Patients with higher oIRS expression are associated with favorable responses to immunotherapy. Indeed, CD83+ cell infiltration, which indicates antigen presentation activity, predicts favorable prognosis in breast cancer. These findings unveil that immune mimicry is a distinct cancer hallmark, providing an example of cancer cell plasticity and a refined view of tumor microenvironment.

Keywords: Biological sciences; Genomics; Immunology.


Conflict of interest statement

The authors declare no competing interests.

Figures

None
Graphical abstract
Figure 1
Figure 1
Single-cell immune-like reprogramming in cancer cells (A) Illustration of single-cell transcription-based deconvolution of cellular differentiation genes by the single sample GSEA (ssGSEA). (B) The dynamics of single-cell ssGSEA scores in cells trans-differentiating from B cells to macrophages (GSE112004). The B cell (left), macrophage (middle) and T cell (right) normalized scores are present at different time points (hours, h) after induction. (C) Normalized ssGSEA scores of breast epithelial cells (left panel) and breast cancer cells. Color bars indicate cell types of different origin. (D–F) Immune cell genes, including B cell (upper panel), T cell (middle panel), and myeloid (lower panel) genes between normal and cancer cells in breast cancer (D), ovarian cancer (E), and glioma (F). Normalized ssGSEA scores of individual cancer cells compared with normal cells from the same tissues. Cells in GSE84465 and GSE131928 were split into different subsets according to the predefined groups in the dataset. (G) Plots showing the normalized expression of immune genes (CD4, CD3D, CD3E, and CD3G) and epithelial marker (EPCAM) in individual cells among different datasets. The expression values were normalized according to GAPDH levels. Red dots indicate cells expressing both immune and epithelial marker genes. (H) Plots showing the ssGSEA scores of acinar, stemness, and monocyte in different stages of pancreatic ductal adenocarcinoma (PDAC) development dataset (GSE125588). (I) Expression of acinar (KLK1) and immune cell (CD45, CD14, and CD68) markers in PDAC dataset. (J) Flow cytometry analysis of immune cell markers in MCF-10A or MCF10A cells expressing doxycycline (Dox) inducible expression of ERBB2, HRASG12V and MYC. Cells were treated with Dox for 8 days before analysis. Error bars in (B), (C–F), and (G and H) represent median and 95% CI. p values, two-sided Mann Whitney Wilcoxon test (ns, not significant; ∗∗, p < 0.01; ∗∗∗, p < 0.001; ∗∗∗∗, and p < 0.0001). See also Figure S1.
Figure 2
Figure 2
Cancer-derived transcriptional noise contributes to inconsistent immune prognoses (A) Kaplan Meier analysis of patients with low (blue curve) and high (red curve) expression of STAT3_ pY05, LCK and PDL1 in the TCPA datasets. p values were determined by log rank test. (B) Hierarchical clustering of leukocyte gene signature matrix (CIBERSORT) genes in the GTEX dataset. Column sidebar represents tissue origin. (C) Hierarchical clustering of CIBERSORT genes in the CCLE dataset. Red line indicates hematopoietic and lymphoid derived cell lines. Column sidebar represents the tissue origin of cell lines. (D) Hazard ratio based on the OS and RFS data in all cancers. Hazard ratio (95% CI) for immune gene (upper panel) or ISF (lower panel) gene signature in the Kaplan Meier plotter datasets. Cancers with lower hazard ratio (left y axis) were marked with blue boxes. p values (right y axis) were determined by log rank test. (E) Kaplan Meier analysis of patients with low (black curve) and high (red curve) expression of immune gene (upper panel) or ISF (lower panel) gene signature in the Kaplan Meier plotter datasets. p values, log rank test. (F) The prognostic meta-z sores of immune gene signatures among different cancer types. Meta-z scores were calculated by unweighted prognostic z scores of individual genes in each signature. Black bars, immune genes; orange bars, optimized immune response signature (oIRS, 32 genes); and red bars, immune-specific favorable gene set (ISF,19 genes). See also Figure S2
Figure 3
Figure 3
Favorable prognoses of core anti-tumor immune processes (A) Hierarchical clustering of immune genes according to PRECOG z-scores in 52 tumor cohorts. (B) Histogram showing the 16 favorable ISF genes enriched in Gene Ontology biological processes. The numbers of enriched genes in the GO term are listed on the right. p values were EASE scores (modified Fisher Exact p value) provided in the DAVID database. (C) Networks of the top 5 favorable ISF genes (CCR7, STAT5B, IKZF1, STAT5A, and KLRK1) in the ImmuNet database. The enriched network for antigen processing and presentation is shown on the left, the natural killer cell mediated cytotoxicity network is given in the middle, and the T cell signaling is shown on the right. Sidebar: relationship confidence (0.1–1.0). (D) Hazard ratio based on the OS data in all cancers. Hazard ratio for antigen presentation (left panel), T cell signaling (middle panel) and NK cell mediated cytotoxicity (right panel) gene signatures in the Kaplan Meier plotter datasets was shown. Cancers with lower hazard ratio (left y axis) were marked with blue boxes. p values (right y axis) were determined by log rank test. (E) Kaplan Meier analysis of overall survival in patients with low (black curve) and high (red curve) expression gene signatures. Antigen presentation (upper panel) and T cell signaling (lower panel) gene signatures were assessed in the Kaplan Meier plotter datasets. p values, log rank test. See also Figure S3.
Figure 4
Figure 4
Anti-tumor immune processes correlate with immunotherapy response (A) Representative enrichment plots for ISF, antigen presentation, T cell signaling and NK cell killing gene sets. Normalized enrichment scores (NES), false discovery rate (FDR) and p values were determined by GSEA in gene expression profiles of responders and non-responder in the in Aa5951 dataset. (B) Histogram showing the expression of antigen presentation, T cell signaling and NK cell killing genes in immunotherapy responder or non-responder patients from Aa5951 (left panel) and GSE111636 (right panel) datasets. (C and D) Enrichment scores of ISF, antigen presentation cells (APC), T cell receptor signaling (TCR) and NK cell killing (NKK) in immunotherapy responders (Resp) or non-responders (NonR). Enrichment scores were determined by single-sample GSEA in Aa5951 (C) and GSE111636 (D). Data in (B–D) are represented as mean ± SD. p values, two-tailed Student's t test (∗, p < 0.05; ∗∗, p < 0.01; ∗∗∗, p < 0.001).
Figure 5
Figure 5
Antigen presentation predicts favorable prognosis in breast cancer (A) Hierarchical clustering of antigen presentation genes according to their expression in cancer cell lines (CCLE dataset). Genes showing lymphocyte specific expression patterns were labeled in red. (B) The pan-cancer PRECOG z-scores of antigen presentation genes (left panel). PRECOG z-score of CD83 in different cancer types (right panel). (C) Hazard ratio based on the OS (upper panel) and RFS (lower panel) data in all cancers. Hazard ratio for CCR7, CD37 and CD40LG in the Kaplan Meier plotter datasets was shown. p values (right y axis) were determined by log rank test. (D) Hazard ratio of CD83 based on the OS (left panel) and RFS (right panel) data in all cancers. p values (right y axis) were determined by log rank test. (E) Kaplan Meier analysis of relapse free survival (RFS) in patients with low (black curve) and high (red curve) expression of CD83 in the Kaplan Meier plotter datasets. p values, log rank test. (F) Representative IHC staining of CD83 in breast cancer specimens. Arrow indicates CD83 + cells. Scale bar represents 50μm. (G) Kaplan Meier curves of estimated overall survival (OS, left panel) and disease-free survival (DFS, right panel) of breast cancer patients with low (<1 per view of field, n = 238) and high (≥1 per view of field, n = 128) CD83 + cell density (p < 0.01 by the log rank test). See also Figure S4.

Similar articles

Cited by

References

    1. Barbie D.A., Tamayo P., Boehm J.S., Kim S.Y., Moody S.E., Dunn I.F., Schinzel A.C., Sandy P., Meylan E., Scholl C., et al. Systematic RNA interference reveals that oncogenic KRAS-driven cancers require TBK1. Nature. 2009;462:108–112. - PMC - PubMed
    1. Barretina J., Caponigro G., Stransky N., Venkatesan K., Margolin A.A., Kim S., Wilson C.J., Lehar J., Kryukov G.V., Sonkin D., et al. The Cancer Cell Line Encyclopedia enables predictive modelling of anticancer drug sensitivity. Nature. 2012;483:603–607. - PMC - PubMed
    1. Bruni D., Angell H.K., Galon J. The immune contexture and Immunoscore in cancer prognosis and therapeutic efficacy. Nat. Rev. Cancer. 2020;20:662–680. - PubMed
    1. Chung W., Eum H.H., Lee H.O., Lee K.M., Lee H.B., Kim K.T., Ryu H.S., Kim S., Lee J.E., Park Y.H., et al. Single-cell RNA-seq enables comprehensive tumour and immune cell profiling in primary breast cancer. Nat. Commun. 2017;8:15081. - PMC - PubMed
    1. Darmanis S., Sloan S.A., Croote D., Mignardi M., Chernikova S., Samghababi P., Zhang Y., Neff N., Kowarsky M., Caneda C., et al. Single-cell RNA-seq analysis of infiltrating neoplastic cells at the migrating front of human glioblastoma. Cell Rep. 2017;21:1399–1410. - PMC - PubMed

LinkOut - more resources