

Elemental characterization of sparkling wine and cork stoppers
- PMID: 34632409
- PMCID: PMC8488460
- DOI: 10.1016/j.crfs.2021.09.006
Elemental characterization of sparkling wine and cork stoppers
Abstract
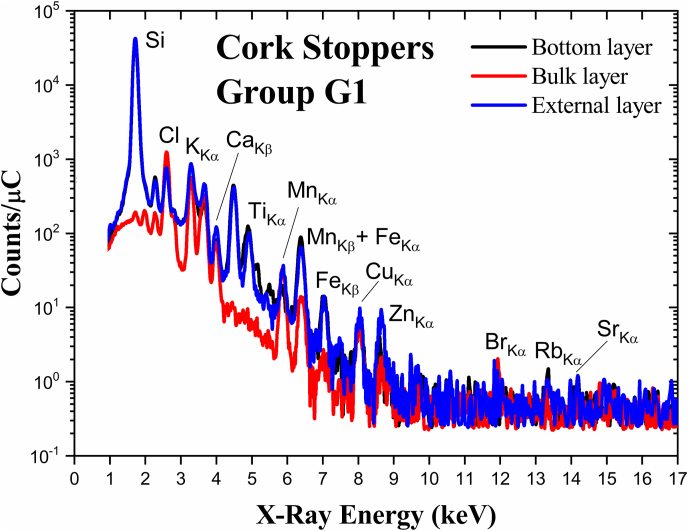
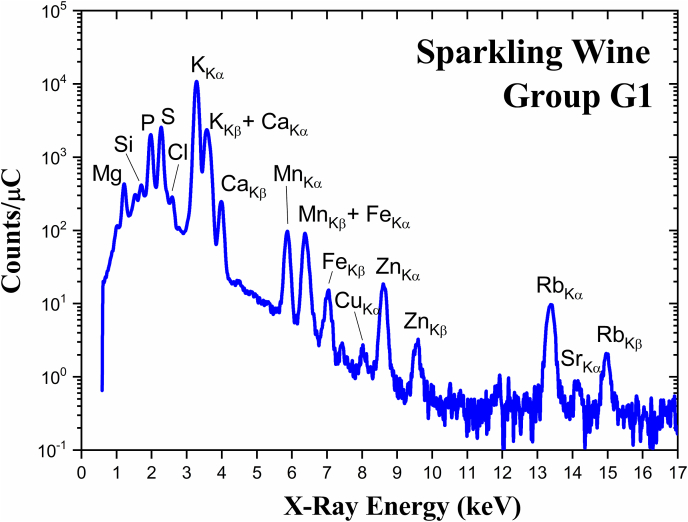
The variations of the elemental concentrations in sparkling white wine and respective cork stoppers throughout 18 months of storage time were determined with the PIXE (Particle-Induced X-ray Emission) technique. Three portions of the cork stoppers were analyzed: the top part (external layer), the inner part (bulk layer) and the bottom layer (which was in contact with the sparkling wine). Elements such as Na, Mg, Si, P, S, Cl, K, Ca, Mn, Fe, Zn and Rb were determined for both cork stoppers and sparkling wine samples. Similar concentrations of Si, P, S, Cl and Ca were found in the external and bottom layers of the corks. Distinct behaviors of the changes in the elemental concentrations as a function of the time were observed for cork stoppers and sparkling wines. The concentrations of Mg, S, K, Ca, Cu, Sr and Ba increased in the bottom layer of the cork as a function of storage time. On the other hand, concentrations of Al, Si, Cl, Ti, Zn and Br proved to be invariant, while the concentrations of P and Fe showed a slight decrease. Concerning the sparkling wine, an increasing trend of elemental concentrations was observed for most elements throughout the storage time. A diffusion mechanism of elements in the cork and the role of the secondary fermentation in the bottle are discussed.
Keywords: Cork stopper; Elemental analysis; PIXE; Sparkling wine; Wine aging.
© 2021 The Authors.
Conflict of interest statement
The authors declare that they have no known competing financial interests or personal relationships that could have appeared to influence the work reported in this paper.
Figures


References
-
- Campbell J.L., Hopman T.L., Maxwell J.A., Nejedly Z. The Guelph PIXE software package III: alternative proton database. Nucl. Instrum. Methods Phys. Res. Sect. B Beam Interact. Mater. Atoms. 2000;170(1–2):193–204. doi: 10.1016/S0168-583X(00)00156-7. - DOI
-
- Caniza D.A.A., Turatti A.M., Fernandes F., Dias J.F., dos Santos C.E.I. Geochemical markers of Ilex paraguariensis determined by PIXE. Nucl. Instrum. Methods Phys. Res. Sect. B Beam Interact. Mater. Atoms. 2020;477:163–168. doi: 10.1016/j.nimb.2019.10.015. - DOI
-
- Cerdán T.G., Goni D.T., Azpilicueta C.A. Accumulation of volatile compounds during ageing of two red wines with different composition. J. Food Eng. 2004;65:349–356. doi: 10.1016/j.jfoodeng.2004.01.032. - DOI
-
- Chung H.-J., Son J.-H., Park E.-Y., Lim S.-T. Effect of vibration and storage on some physico-chemical properties of a commercial red wine. J. Food Compos. Anal. 2008;21:655–659. doi: 10.1016/j.jfca.2008.07.004. - DOI
-
- Cloete K.J., Šmit Ž., Minnis-Ndimba R., Vavpetič P., du Plessis A., le Roux S.G., Pelicon P. Physico-elemental analysis of roasted organic coffee beans from Ethiopia, Colombia, Honduras, and Mexico using X-ray micro-computed tomography and external beam particle induced X-ray emission. Food Chem. X. 2019;2 doi: 10.1016/j.fochx.2019.100032. - DOI - PMC - PubMed
LinkOut - more resources
Full Text Sources
Research Materials
