. 2021 Sep 27;1(5):100080.
doi: 10.1016/j.crmeth.2021.100080. Epub 2021 Sep 16.

A mouse model for the study of anti-tumor T cell responses in Kras-driven lung adenocarcinoma

Affiliations

A mouse model for the study of anti-tumor T cell responses in Kras-driven lung adenocarcinoma

Brittany Fitzgerald et al. Cell Rep Methods. .

Abstract

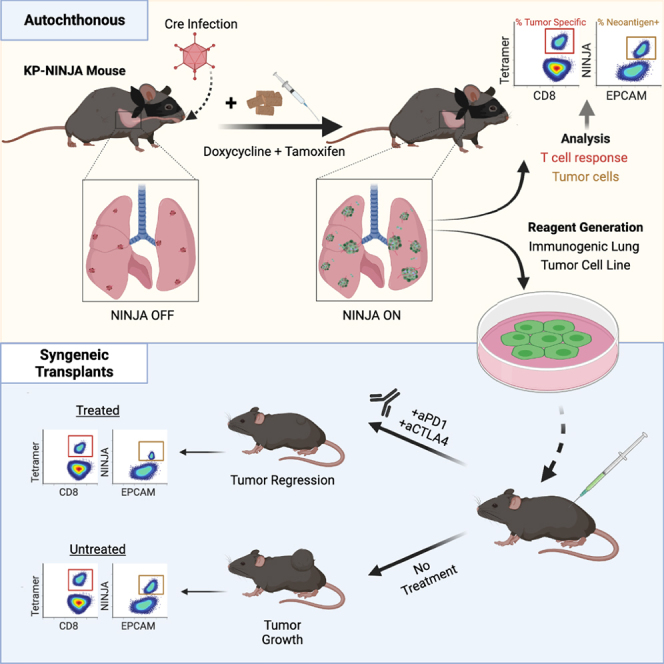
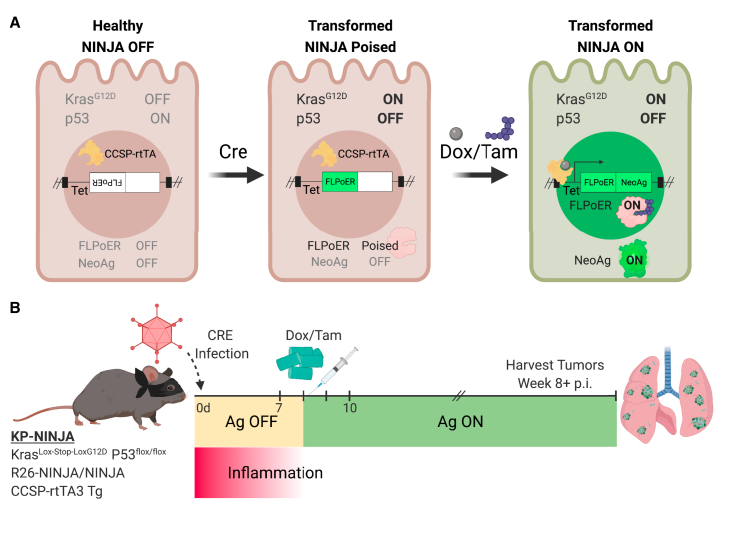
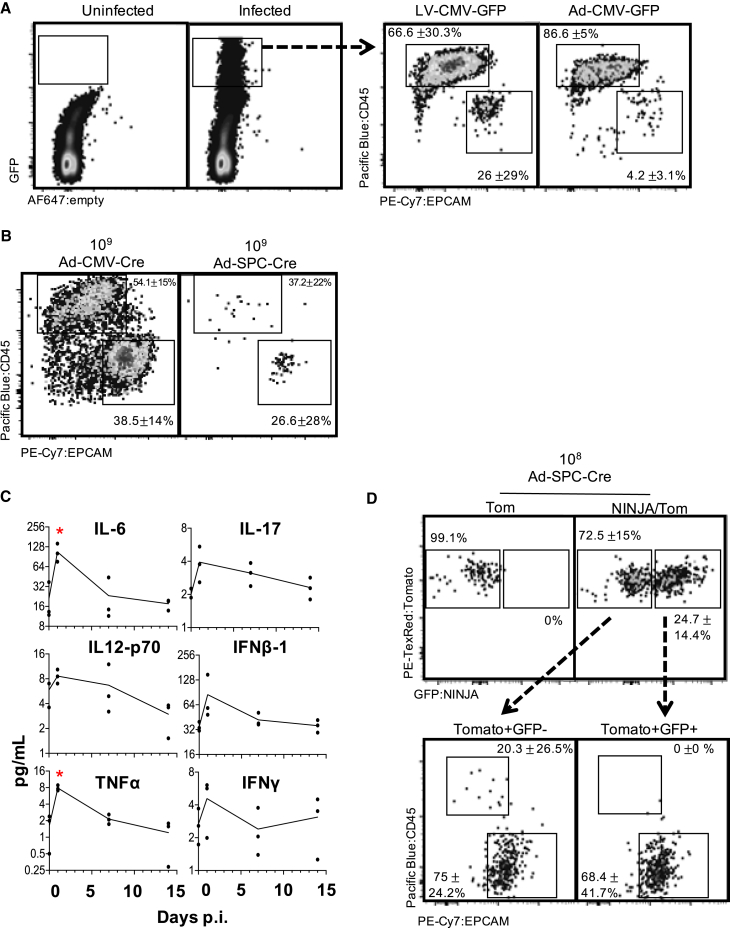
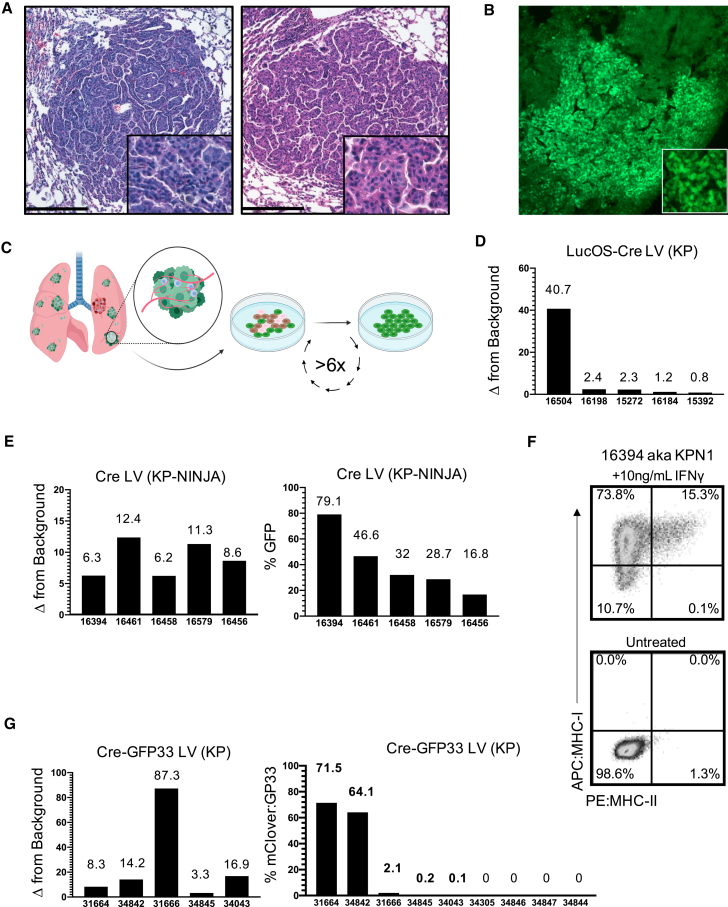
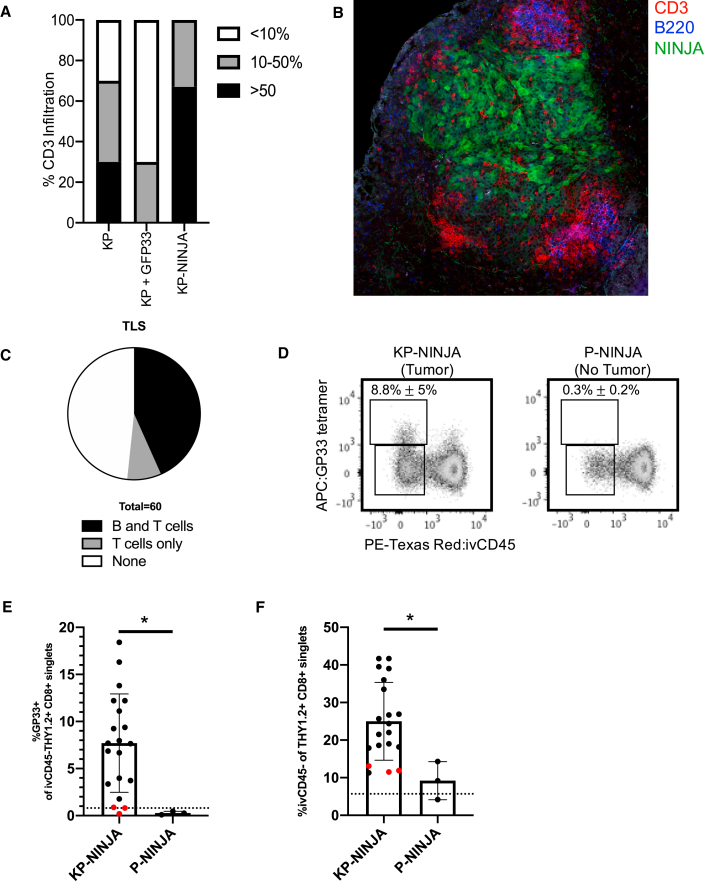
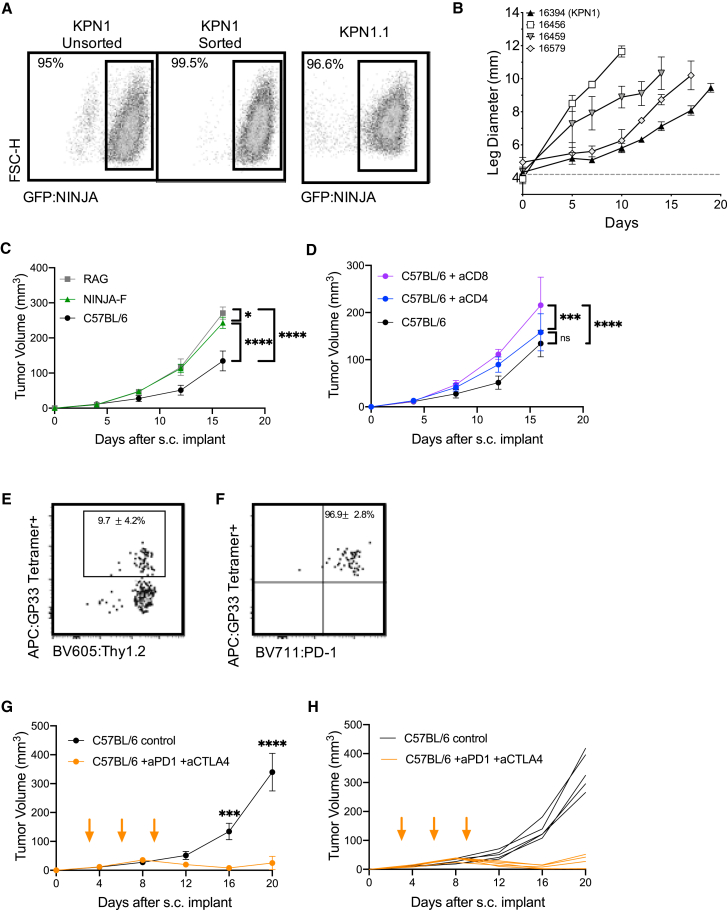
Kras-driven lung adenocarcinoma (LUAD) is the most common lung cancer. A significant fraction of patients with Kras-driven LUAD respond to immunotherapy, but mechanistic studies of immune responses against LUAD have been limited because of a lack of immunotherapy-responsive models. We report the development of the immunogenic KP × NINJA (inversion inducible joined neoantigen) (KP-NINJA) LUAD model. This model allows temporal uncoupling of antigen and tumor induction, which allows one to wait until after infection-induced inflammation has subsided to induce neoantigen expression by tumors. Neoantigen expression is restricted to EPCAM+ cells in the lung and expression of neoantigen was more consistent between tumors than when neoantigens were encoded on lentiviruses. Moreover, tumors were infiltrated by tumor-specific CD8 T cells. Finally, LUAD cell lines derived from KP-NINJA mice were immunogenic and responded to immune checkpoint therapy (anti-PD1 and anti-CTLA4), providing means for future studies into the immunobiology of therapeutic responses in LUAD.


Conflict of interest statement

DECLARATION OF INTERESTS The authors declare no competing interests.

Figures

None
Graphical abstract
Figure 1
Figure 1
KP-NINJA lung tumor neoantigen induction model (A) Schematic of NINJA and KP allele induction activity. KrasLox-Stop-Lox (LSL)G12D is activated and p53flox/flox is deleted after Cre recombinase activity, and the FLPoER in NINJA flips to being in-frame for transcription. After doxycycline and tamoxifen (Dox/Tam) administration, Dox binds the lung-specific CCSP-rtTA to allow the Tet-controlled FLPoER promoter to express, and Tam binds FLPoER to allow nuclear entry and recombination and expression of the NINJA neoantigen. (B) KP-NINJA mouse tumor and antigen induction protocol timeline, with Adeno- or Lenti-Cre induction at day 0, followed by antigen induction by Dox/Tam at days 7–10. Inflammation approximation is based on data presented in Table 1.
Figure 2
Figure 2
Neoantigen induction in KP-NINJA occurs in lung epithelial cells after overt inflammation is resolved (A) Infected (GFP+) cells 4–7 days after Lenti- or Adeno-CMV-GFP infection in lung, showing CD45+ and EPCAM+ populations. Percentages are average ± standard deviation; Lenti-CMV-GFP, n = 8 mice; Ad-CMV-GFP, n = 2 mice, from two independent repeats. (B) Infected (previously gated Tom+) lung cells gated for CD45 and EPCAM 4–7 days p.i. (high dose, 109 PFU; percentages are average ± standard deviation; Ad-SPC-Cre, n = 4 mice; Ad-CMV-Cre, n = 5 mice, from two independent repeats). (C) Selected cytokines from Luminex cytokine panel, assessed for concentration in lung homogenate at 24 h, 7 days, or 14 days p.i. with 2.5 × 107 PFU Adeno-SPC-Cre. n = 3 mice/time point. ∗p < 0.05, unpaired t test versus uninfected. (D) Expression of tomato and NINJA in T cell-depleted KP-NINJA/tomato (NINJA/Tom) lungs or KP-tomato control mouse (Tom) 21 days p.i., with mid-dose 108 PFU Adeno-SPC-Cre and Dox/Tam administration. Percentages shown are out of all infected cells (Tom+) average ± standard deviation, n = 7. Arrows point to expression of EPCAM+ and CD45+ on cells from NINJA/Tom gates in the top right.
Figure 3
Figure 3
Antigen expression in KP-NINJA tumors has more uniform expression versus Lenti-neoantigen tumors (A) Representative H&E images of lung tumors 25 weeks p.i. Left panel: Adeno-SPC-Cre in KP-NINJA; representative of n = 15 tumors imaged (34/34 mice had tumors by necropsy, 100% penetrance). Right panel: LucOS-Cre LV (Lenti-ubc-LucOS-pgk-Cre) in KP; representative of n = 16 tumors imaged (20×). Scale bar, 200 μm. (B) Immunofluorescence image of KP-NINJA lung tumor. Green, endogenous NINJA-GFP (10×). (C) Schematic of cell line generation from primary lung tumors. All analysis occurred after a minimum of six passages in culture. (D) Fold change relative to background of neoantigen-luciferase intensity, in LucOS-Cre LV cell lines derived from 20 week p.i. KP lung tumors. (E) KP-NINJA cell lines. Left panel: fold change in NINJA-GFP expression is measured by geometric mean of GFP+/GFP– MFI. Right panel: percent of cells in each cell line positive for neoantigen expression by flow cytometry. Cre LV (Lenti-pgk-Cre) in KP-NINJA+ Dox/Tam lines from 8 week p.i. tumors. (F) MHC-I and MHC-II expression on a KP-NINJA cell line from (E) after overnight stimulation with IFNγ. A single representative experiment shown. (G) Cre-GFP33 LV cell lines. Left panel: fold change in GFP expression by MFI. Right panel: percentage of cells in each cell line positive for neoantigen expression by flow cytometry. Cre-GFP33 LV (Lenti-CMV-Cre-sv40-GP33) in KP lines from 8 week p.i. tumors.
Figure 4
Figure 4
KP-NINJA tumors generate tumor neoantigen-specific T cell responses (A) Proportion of CD3 infiltration in tumors 8 weeks p.i. by IHC, blindly scored in KP Cre LV (KP) versus KP Cre-GFP33 LV (KP + GFP33) versus KP-NINJA Cre LV (KP-NINJA) for <10%, 10%–50%, or >50% tumor infiltration (n = 10 KP-NINJA, n = 12 KP + GFP33, n = 10 KP + Cre). (B) Immunofluorescence image of a KP-NINJA tumor. Green, endogenous NINJA-GFP; blue, B220 (B cells); red, CD3 (T cells) (40×, 4 × 4 tiled, 20 weeks p.i.). (C) Proportion of tumors scored in KP-NINJA that were associated with TLS; T cells only (5/60; 8.3%), T and B cells (26/60; 43.3%), or none (29/60; 48.3%). (D) Representative flow cytometry plots of Thy1.2+ CD8+ T cells gated for antigen specificity (GP33+) in tumor-bearing (KP-NINJA) or non-tumor-bearing (P-NINJA) lung. Note, i.v. CD45– indicates tissue infiltration. Percentages are averages ± standard deviation of n = 3 mice (P-NINJA) or n = 20 mice (KP-NINJA). (E) Quantification of lung-infiltrating antigen-specific T cells in (D) (%GP33+ i.v. CD45– Thy1.2+ CD8+) 8 weeks p.i. with Ad-SPC-Cre. The dotted line represents a control C57BL/6J mouse. Red dots represent mice where %GP33+ was not higher than the FMO control (3/20). ∗p < 0.05 in unpaired t test. (F) Quantification of total endogenous T cell infiltration in tumor-bearing or non-tumor-bearing lung in (D) (i.v. CD45– Th1.2+ CD8+). The dotted line represents a control C57BL/6J mouse. Red dots are the same mice as shown in (E). ∗p < 0.05 in unpaired t test.
Figure 5
Figure 5
KP-NINJA tumor cell lines are immunogenic and respond to checkpoint therapy (A) Expression of NINJA-GFP in one of the KP-NINJA primary cell lines (16394, also known as KPN1). Left two panels: KPN1 before and after sorting for GFP+. Right panel: after one passage through C57BL/6J mice and rederivation of the cell line as KPN1.1. (B) Mean intramuscular growth of 200K cells of four transplanted primary KP-NINJA lung cell lines in NSG mice (16394, 16459, and 16579 all n = 3 mice; 16456 n = 5; error bars are SD). (C) Mean subcutaneous growth of 500K KPN1.1 in Rag1−/−, wild-type C57BL/6J, or NINJA-F (antigen-tolerant) mice. Representative of two independent experiments (RAG n = 5 mice, NINJA-F n = 8, C57BL/6J n = 10; the same C57BL/6J untreated control) is shown in (D). (D) Mean subcutaneous growth of 500K KPN1.1 in wild-type C57BL/6J with or without CD4 or CD8 depletion (200 μg/mouse/antibody were administered i.p. every 3 days, from day −3 until study endpoints, indicated on the x axis). aCD8 and aCD4 n = 5 mice each; C57BL/6J untreated control is also shown in (C). (E) Representative flow cytometry plots of CD8+ CD4− tumor-infiltrating T cells from KPN1.1 subcutaneous transplant tumors, gated for antigen specificity (GP33+). Percentages shown are averages ± standard deviation; n = 3 mice for tumors and n = 5 for lymph nodes (LNs). (F) PD1 expression on T cells from the GP33+ Thy1.2+ gate in (E). Percentages shown are averages ± standard deviation; n = 3 mice for tumors and n = 5 for LNs. (G) Mean subcutaneous growth of 500K KPN1.1 in wild-type C57BL/6J mice, with or without anti-PD1 200 μg and anti-CTLA4 200 μg dosing. Orange arrows indicate treatment; days 3, 6, and 9. Anti-PD1 + anti-CTLA4 n = 10 mice, C57BL/6J n = 10, from two independent experiments. (H) Individual tumor curves from (G). In (C), (D), (G), and (H), ∗p < 0.05, ∗∗p < 0.01, ∗∗∗p < 0.001, ∗∗∗∗p < 0.0001; two-way ANOVA.

Similar articles

Cited by

References

    1. Adeegbe D.O., Liu S., Hattersley M.M., Bowden M., Zhou C.W., Li S., Vlahos R., Grondine M., Dolgalev I., Ivanova E.V., et al. BET bromodomain inhibition cooperates with PD-1 blockade to facilitate antitumor response in Kras-mutant non-small cell lung cancer. Cancer Immunol. Res. 2018;6:1234–1245. - PMC - PubMed
    1. Aguirre A.J., Bardeesy N., Sinha M., Lopez L., Tuveson D.A., Horner J., Redston M.S., DePinho R.A. Activated Kras and Ink4a/Arf deficiency cooperate to produce metastatic pancreatic ductal adenocarcinoma. Genes Dev. 2003;17:3112–3126. - PMC - PubMed
    1. Alonso R., Flament H., Lemoine S., Sedlik C., Bottasso E., Peguillet I., Premel V., Denizeau J., Salou M., Darbois A., et al. Induction of anergic or regulatory tumor-specific CD4(+) T cells in the tumor-draining lymph node. Nat. Commun. 2018;9:2113. - PMC - PubMed
    1. Blasco M.T., Navas C., Martin-Serrano G., Grana-Castro O., Lechuga C.G., Martin-Diaz L., Djurec M., Li J., Morales-Cacho L., Esteban-Burgos L., et al. Complete regression of advanced pancreatic ductal adenocarcinomas upon combined inhibition of EGFR and C-RAF. Cancer Cell. 2019;35:573–587 e576. - PMC - PubMed
    1. Brinster R.L., Chen H.Y., Messing A., van Dyke T., Levine A.J., Palmiter R.D. Transgenic mice harboring SV40 T-antigen genes develop characteristic brain tumors. Cell. 1984;37:367–379. - PMC - PubMed

Publication types